Category Stone Matrix Asphalt. Theory and Practice

Zichner’s and DAV’s SMA versus 30-20-10 Rule

The 30-20-10 rule has more or less rigid proportions of gradation (expressed by

amounts passing through selected sieves). Zichner proposed the amount of coarse

a

Подпись:Подпись:Подпись: 10 20 30 40 50 60 70 80 90 100 Подпись:Подпись:image51a

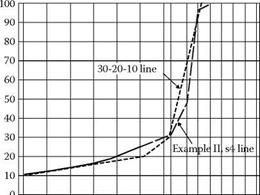
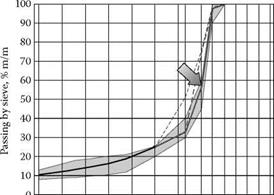
FIGURE 6.9 An SMA mix of Example II, Stage 4, compared with the line of the 30-20-10 rule.

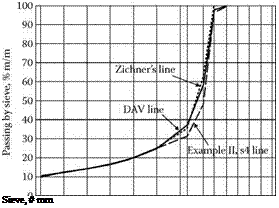
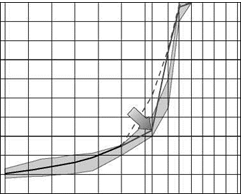
aggregates over a very wide range (65-80%), with a recommendation for 70-75%. His MASTIPHALT (SMA 0/12.5, mm) with 75% of grains larger than 2 mm has a gentle gap gradation with also more or less fixed proportions. There is no doubt that the 30-20-10 rule creates quite different mixtures than those created according to Zichner’s ideas. The other issue is with DAV’s proportions (Table 6.10) because these express the proportions between aggregates inside the coarse fraction. Hence the proportions mentioned can be applied to the amount of coarse aggregates fraction within the permitted range (e. g., 70-80%). In Figure 6.8 we compared the DAV line applied with a fixed 75% of coarse aggregates as we designed in Example II. Now we can evaluate the DAV proportions applied to a new content: 80% of coarse aggregates (similar to the 30-20-10 rule). After calculation of the gradation larger than the 2.0 mm sieve, according to DAV rules we can see grading curves as shown in Figure 6.10. The final assessment of the 30-20-10 rule line is slightly below the extreme line permitted by DAV propor­tions at 80% of coarse aggregate fraction. As is the case in Germany, there is a trend to decrease the amount of coarse aggregate content to 73-76% (Druschner, 2005). Taking into account this assumption, the 30-20-10 rule line is too low.

One can see in Figure 6.10 that the latest German regulations TL Asphalt-StB 07 for SMA 11S requires 35-45% of material passing a 5.6 mm sieve. It shows that Zichner’s or DAV’s proportions (for 70-76% of stones) are still in use.

6.3.2.2.2 Summary of Example II

The following is a list of the conclusions drawn from analyzing Example II: [24]
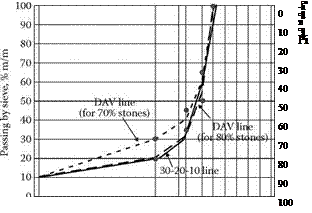
image52

FIGURE 6.10 Comparison of SMA gradations: 30-20-10 rule (solid line) and DAV lines for 70% and 80% of coarse fraction (dotted lines). The points show gradation limits in coarse fraction established in the newest German TL Asphalt-StB 07 for SMA 11S.

• The ratios of the coarse aggregate fractions cannot be even because this causes a loss of the necessary discontinuity of gradation.

• Quantities of the finest grains in the coarse fraction should be reduced when composing the total coarse aggregate fraction.

• The content of grains larger than 2 mm (the coarse aggregate) in an SMA aggregate mix do not explicitly determine its aggregate skeleton and prop­erties; aggregates passing the 5 or 8 mm sieves are also needed.

• Increasing the quantity of particles larger than 5 mm leads to opening the mix; this effect is even more noticeable when raising the content of particles larger than 8 mm.

Comparison of Results of Example II with the 30-20-10 rule of SMA Composition

According to the rule described in Section 6.2.2, proper stone-to-stone contact is created if the percentage of aggregate passing the 0.075 mm, 2.36 mm, and

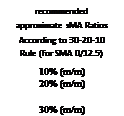
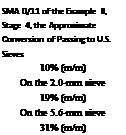
4.75 mm sieves equals 10%, 20%, and 30%, respectively. Table 6.11 shows the comparison between the achieved result of Stage 4 and ratios according to the 30-20-10 rule.

There are some noticeable differences. First, the 30-20-10 SMA should contain more aggregates larger than 2.36 mm (80%), whereas the relevant SMA of Example I was designed at only 75% on the 2.0 mm sieve. With regard to particles larger than

Recommended Ratios of SMA 0/11S according to German DAV Handbook Compared with the result of sMA design in example ii

TABLE 6.10

sMA coarse

original

zichner’s

recommended ratios within SMA coarse Aggregates’ Fraction According to the german guidelines for

SMA of

ratios of the Mix converted According to the german DAv guidelines (for 75%

Fraction

proportions of

SMA 0/11S (Mass

example

of grains retained

components

mastiphalp

Fractions)b

II, Stage 4

on Sieve 2.0 mm)

Fraction 2/5.6

10%

1 part

5%

10.7%

Fraction 5.6/8

27%

2 parts

15%

21.4%

Fraction 8/11.2

38%

4 parts

55%

42.9%

Total

75%

7 parts

75%

75.0%

a See Table 6.4.

b From Druschner, L., Schafer, V., Splittmastixasphalt. DAV Leitfaden. Deutscher Asphaltverband, 2000.

0

Подпись:10

Подпись: a a CD _<D '£> c о 43 CD c "ns CD Cl 20

30

40

50

60

70

80

90

100

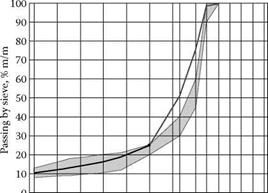
FIGURE 6.8 SMA mix of Example II, Stage 4, adjusted to the ratios recommended by the German DAV handbook compared with its original gradation and Zichner’s proportions.

TABLE 6.11

Подпись: recommended approximate SMA Ratios According to 30-20-10 Rule (for SMA 0/12.5) 10% (m/m) 20% (m/m) 30% (m/m) Подпись: SMA 0/11 of the Example II, Stage 4, the Approximate Conversion of Passing to U.S. Sieves 10% (m/m) On the 2.0-mm sieve 19% (m/m) On the 5.6-mm sieve 31% (m/m)
Подпись: gradation Passing by the 0.075-mm sieve Passing by the 2.36-mm sieve Passing by the 4.75-mm sieve

Recommended SMA Ratios according to the 30-20-10 rule Compared with the result of sMA Designed in example ii

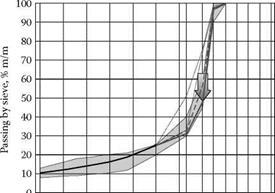
4.75 mm, the result obtained in Example II is consistent with the requirement con­cerning 30%. Figure 6.9 shows the SMA corrected in such a way that its ratios are in conformity with the assumptions of the 30-20-10 rule.

The SMA designed according to the 30-20-10 rule is more gap graded than our SMA in Example II, which is especially evident in the percent passing the 2.0-mm sieve. In general, mixtures with such a strong gap in grading are harder to compact and are more permeable. On the other hand, one can get very strong skeleton with such a clear gap grading (stone-to-stone contact).

Comparison of Results of Example II Using German Proportions of SMA Composition

In Chapter 2, Table 2.1 cites the recommended ratios of individual SMA coarse aggregate fractions from the German DAV handbook (Druschner and Schafer, 2000). The comparison of the achieved result from Example II with ratios required in Germany is shown in Table 6.10.

The comparison in Table 6.10 shows that our SMA differs both from the origi­nal Zichner proportions and the contemporary ones recommended in Germany. The original German SMA does not contain such a great amount of the coarsest grains. Therefore let us design the same mix according to the German DAV proportions. The result is shown in Figure 6.8. The gradation curves of DAV and Zichner have a gentler shape, making laydown and compaction easier. Not using the maximum quantities of the coarsest grains makes the mix less open graded. Such an SMA mixture will probably be less permeable to water.

Finalizing the Changes in the Aggregate Mix

As a result of the actions undertaken during Stages 1-4, the present mix is distin­guished by a very high proportion of coarse particles (the strong skeleton) and the maximum discontinuity of gradation allowed by the gradation curves of SMA 0/11 according to ZW-SMA-2001. The share of the coarse aggregate fraction was fixed all the time at the level of 75% (m/m). Keeping in mind the impact of the size of coarse aggregate fraction on the content of voids and binder, specimens can be prepared and then tested to check their characteristics, and finally some final refinements to the fraction in question can be made.

But there is still a question, is it a good SMA mixture? Let us compare our newly designed very coarse SMA to the German recommendation and the 30-20-10 rule.

Stage 4

After examining the gradation curve in Figure 6.6, we can conclude that lower­ing the curve on the 8-mm sieve simply means a reduction in passing from 55 to 45%, which is an increase in the quantity of particles bigger than 8 mm from 45 to 55%. This move means that we should increase the content of 8/11.2 by 10%. This action should be balanced, so 10% has to be taken off the aggregate 5.6/8. As a result, the achieved composition of the mix is shown in Table 6.9 and the gradation curve in Figure 6.7.

TABLE 6.9

Example of the SMA Mix with an Uneven Distribution of the Coarse aggregate Fraction among Three Fractions— predominantly chippings 8/11.2 (example II, stage 4)

Подпись:component of aggregate mixture content, (m/m)
Filler 10%

Crushed sand 0/2 15%

Coarse aggregate 2/5.6 mm 5%

Coarse aggregate 5.6/8 mm 15%

Coarse aggregate 8/11.2 mm 55%

Подпись: CO lO lO lO О СЧ ЙМ SO lO lO CO )£, 22 d in I_lr2 ^ CN ^ so 4 . О H M CO о о Подпись: *S й о 43 CD c rt CD Cl Подпись: Sieve, # mmimage490

10

Подпись:20

30

40

50

60

70

80

90

100

FIGuRE 6.7 Example of SMA mix with an uneven distribution of the coarse aggre­gate fraction among three fractions—the effect of the decrease in quantity of aggregate 2/5.6 and 5.6/8 combined with adding 10% aggregate 8/11.2 (Example II, Stage 4).

STAGE 3

This time, let us add that 20% removed from 2/5.6 mm chippings to 8/11.2 mm chippings (that makes 25% + 20% = 45%), leaving the content of fraction 5.6/8 the same as in Stage I (25%). The composition of the new mix is shown in Table 6.8, while its gradation curve is shown in Figure 6.6.

The achieved mix falls between the upper and lower gradation limits. Obviously it still needs some refining within the sand fraction, but at the moment the main topic is the coarse aggregate. Perfectionists would say that a bit of "messing about" with the coarse fraction could be useful, by lowering the grada­tion curve even more on the 8 mm sieve, for example. But the question is, is it worth it?

After all, lowering the gradation curve on the 8 mm sieve will increase the share of particles larger than 8 mm, which means a more coarse gradation. The mix with a predominant share of the fraction 8/11.2 will make a strong skeleton; however, it will be characterized by a high value of voids in mineral aggregate (VMA) that requires a high binder content to achieve a suitably low content of air voids. We also obtain better (deeper) macrotexture, which means better skid resistance with high speed measurements. The down side is that such a mixture will have considerably higher permeability. So is this worth doing?

Despite this, let us make the last correction of the mix.

TABLE 6.8

Example of the SMA Mix with an Uneven Distribution of the Coarse aggregate Fraction among Three Fractions— predominantly chippings 8/11.2 (example II, stage 3)

Подпись:component of aggregate mixture content, (m/m)

Filler 10%

Crushed sand 0/2 15%

Coarse aggregate 2/5.6 mm 5%

Coarse aggregate 5.6/8 mm 25%

Coarse aggregate 8/11.2 mm 45%

Подпись: о d Подпись: CS ^0 ^ W Ln CO ‘ MH'I' - СЧ COПодпись: 10 20 30 40 50 60 70 80 90 100 Подпись: 0image480

Sieve, # mm

FIGuRE 6.6 Example of SMA mix with an uneven distribution of the coarse aggre­gate fraction among three fractions—the effect of the decrease in quantity of aggregate 2/5.6 and the supplement of 20% aggregate 8/11.2 (Example II, Stage 3).

Part II: Gradation within the Coarse Aggregate Fraction

When designing the shape of a gradation curve in the coarse aggregate fraction (larger than 2 mm), it is worthwhile to pay attention not only to the percentage of grains larger than 2 mm (retained on a 2 mm sieve) but also to the ratios of contents of various coarse aggregate fractions. According to many recommendations (i. e.,

Schroeder and Kluge, 1992; Voskuilen, 2000), mixtures characterized by a certain deficiency of smaller coarse aggregates, or even a lack of them, should be preferred. So, let us proceed to Example II to discuss changes in the gradation within the coarse aggregates’ fraction. This example is not complicated, therefore we will not encounter any difficulties in its interpretation; this is especially for anyone who often designs using the gradation limits method.

Example ii: Changes in Gradation within the Coarse Aggregate Fraction

Let us start analyzing an SMA mixture that has fixed contents of particles larger than 2 mm at 75% (m/m), filler at 10%, and fine aggregate at 15%. The grada­tion curves of SMA 0/11 according to ZW-SMA-2001, fine aggregate 0/2, a filler, and 3 fractions of the coarse aggregate (2/5.6, 5.6/8, and 8/11.2) will be used for the analysis. To make the task easier, an assumption has been made that none of the aggregate fractions has any undersized or oversized particles. All percentage values of this example apply to percentage by mass (i. e., mass fraction [m/m]).

stage 1

Briefly, should equal shares of each of the coarse aggregate fractions—2/5.6, 5.6/8 and 8/11.2—be secured, the mixture presented in Table 6.6 is the result.

Even though the coarse aggregate fraction totals 75% (m/m) of the mixture and everything seems to be all right with regard to its content, the desired discontinu­ity of gradation is impossible to achieve by the use of this uniform distribution of constituents (at 25% each) (Figure 6.4). We can even safely say that there is a kind of continuity of gradation within the coarse aggregate fraction.

stage 2

Now let us divide the coarse aggregate fraction into other proportions. According to the conclusions of Example I, more coarse aggregate have to be added but material 2/5.6 mm has to be removed to break the gradation curve and pull it down at the 5.6 mm sieve. In Example II, Stage 1, 25% of the coarse particles pass through the 2-mm sieve (the fixed quantity, as assumed) and 50% through the 5.6-mm sieve (Figure 6.4). The expected level of particles larger than

TABLE 6.6

Example of the sMA Mixture with a uniform Distribution of the coarse Aggregate Fraction among Three Fractions (Example ii, stage 1)

component of an Aggregate mixture

content, (m/m)

comments

Filler

10%

Aggregates for mastic

Crushed sand 0/2

15%

Coarse aggregate 2/5.6 mm

25%

Coarse aggregate >2 mm

Coarse aggregate 5.6/8 mm

25%

(total 75% [m/m])

Coarse aggregate 8/11.2 mm

25%

5.6 mm exceeds 50% (e. g., 70% [passing through the sieve 5.6 mm at 30%]). The result is that the increase in material between sieves 2 and 5.6 (passing at 25% and 30%, respectively) should amount to approximately 5%, which is tantamount to the statement that screening of the fraction 2/5.6 mm in the given aggregate mix should be approximately 5%. Screening of the fraction 2/5.6 mm here is identical with the aggregate 2/5.6 mm. Therefore chippings of 2/5.6 mm have been reduced from 25 to 5%.

The only thing remaining is to decide where to add the regained 20% of the coarse aggregate—to chippings of 5.6/8 or to 8/11.2 mm?

Let us suppose that the regained 20% is being added to 5.6/8 mm chippings, leaving the fraction 8/11.2 unchanged. Table 6.7 presents the mix composition at that stage, while Figure 6.5 illustrates its gradation curve. It should be remembered that the share of material larger than 2 mm remains unchanged and still amounts to 75% (m/m).

Подпись:Подпись:Подпись:Подпись:Подпись:image460

10

20

30

40

50

60

70

80

90

100

FIGURE 6.4 Example of an SMA mixture with an even distribution of the coarse aggregate fraction among three fractions (Example II, Stage 1).

TABLE 6.7

Example of the SMA Mix with an Uneven Distribution of the Coarse aggregate Fraction among Three Fractions— predominantly aggregates 5.6/8 (example ii, stage 2)

Подпись: component of aggregate mixture Filler Crushed sand 0/2 Coarse aggregate 2/5.6 mm Coarse aggregate 5.6/8 mm Coarse aggregate 8/11.2 mm content, (m/m) comments

10% Aggregates for mastic

15%

5% Coarse aggregate >2 mm

45% (total 75% [m/m])

25%

Подпись: 90 80 70 60 50 40 30 20 10 0 image47 Подпись: CO 40 40 VO CN CN c—і ,—і ^
Подпись: и Part II: Gradation within the Coarse Aggregate Fraction

Sieve, # mm

FIGURE 6.5 Example of SMA mix with an uneven distribution of the coarse aggre­gate fraction among three fractions—the effect of a decrease in quantity of aggregate 2/5.6 and the supplement of 20% chippings 5.6/8 (Example II, Stage 2).

A better gap-gradation is a distinctive feature of the achieved gradation curve. The broken shape of the gradation curve of that mix is clearly noticeable. Despite that improvement, the mix is still not acceptable because there is too little material larger than 8 mm. So replacing the 20% chippings 2/5.6 removed with only chip­pings 5.6/8 has not led to the defined goal. Therefore let us try another variant.

Part i: Coarse Aggregate Content

Designing the coarse aggregate part of an SMA mix differs widely from designing an asphalt concrete (AC) mix. The unexpected difference lies in the various results of similar actions. Let us consider the example of SMA gradation curves.

It should be kept in mind that SMA has a strong aggregate skeleton with little to none of the medium aggregate fraction. Different distributions of sizes within the coarse aggregate fraction can lead to greater or smaller discontinuities in the overall gradation in a course, which can lead to some pretty interesting consequences for the mixture.

Example i

MIXTURE S

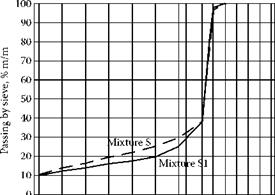
Thus let us take the gradation limits of SMA 0/12.8 mm and insert a gradation curve between them, marking that design as S (Figure 6.2). Grading parameters of the mixture S are shown in Table 6.5.

MIXTURE S1

Let us perform the operation of adding coarse aggregates to the mixture. Now, more coarse graded grains have been added as can best be seen on 2.0- and 4.0-mm sieves. This creates mixture S1 (Figure 6.2). The gradation characteristics of a new mixture S1 may also be found in Table 6.5. The gradation curve for mix­ture S1 has been moved downward in the area of sieves larger than 2 mm relative to mixture S.

image44"0

10

20

30

40

50

60

70

80

90

100

Sieve, # mm

FIGURE 6.2 Grading curves of S (the dotted line) and S1 (the solid line) mixes – SMA of Example I.

TABLE 6.5

Grading Characteristics of Mixtures S and S1

Gradation properties

mixture s

mixture s1

Filler fraction content (grains <0.063 mm), % (m/m)

10.5

10.1

Sand fraction content (grains 0.063-2.0 mm), % (m/m)

14.4

9.8

Coarse aggregate content (grains >2.0 mm), % (m/m)

75.5

80.1

Coarse aggregate content (grains >4.0 mm), % (m/m)

70.0

74.3

Specific surface area of the mixture, cm2/g

189

170

Подпись: FIGURE 6.3 SMA mixtures with increasingly higher contents of the coarse aggregate fraction. Part i: Coarse Aggregate Content

Conclusions of the Example I SMA mixture

Conclusions drawn from the analysis of Example I include the following:

• The increase in coarse grains in a mix brings about the lowering of curves in the area of sieves larger than 2 mm. There then follows an increase in par­ticles retained on the 2-mm sieve; all in all, SMA gradation curves behave the same way as those of AC.

• The main difference in gradation between mixtures S and S1 is that the sand fraction (0.063/2.0 mm) of mixture S1 is less by about 5% than that of mixture S, and this percentage of material is moved to fraction 2.0/8 mm of S1 mixture.

• It is easy to observe that the amount of coarse aggregates of fraction 8/11.2 mm is almost the same in mixtures S and S1; this means that the main changes occurred between sieves 0.063 and 8 mm.

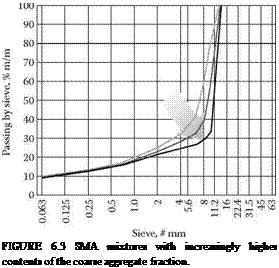
• There are more coarse aggregates in mixture S1, hence the quantity of coarse aggregates carries with it an increase in the air voids in the aggre­gate mix and an increase in the quantity of binder needed in the SMA. Meanwhile, let us look at Figure 6.3, which shows numerous gradings of SMA mixtures. Each of them contains more and more coarse particles, and the gradation curves move in the direction of the arrow. Naturally, the con­sequences of such movements are more and more spacious voids among coarse particles.

Designing the Aggregate Mix Larger than 2 мм

Let us design the SMA coarse aggregate fraction (particles larger than 2.0 mm). The majority of guidelines recommend its content should be about 70-80% (m/m) of the whole aggregate mix, making it the major component. It may seem that there is little room to maneuver; however, there is a huge potential for controlling the SMA properties by making changes within this narrow range.

Some issues are worth deliberating, namely the impact on a mix exerted by the following:

• A change in the content of coarse aggregates (grains retained on a 2 mm sieve)

• The actual gradation of the coarse aggregate fraction (distribution of coarse aggregate on sieves larger than 2 mm)

• The density of the coarse aggregate particles

To illustrate these issues, two model mixes of coarse aggregates, calculated in a laboratory, will be discussed. One point should be mentioned at the beginning. We will use the following sieve set for coarse fraction: 2.0 mm, 4.0 mm, 5.6 mm,

8.0 mm, 11.2 mm, and 16.0 mm.

Designing a Gradation Curve

Some hold the opinion that the best gradation curve is the one passing exactly in the middle of the space between the upper and lower gradation limits. To a certain extent in some cases this may be true; however, in the majority of cases it is not. The shape of a design gradation curve exerts a significant impact on mix properties. For example, by looking at its shape, one may determine if the mix is more or less coarse or has the probability of being overfilled with mastic. Therefore the shape of a design gradation curve is not an unimportant question.

The subsequent phases of design will be discussed later, starting with the coarse aggregate fraction, going through the sand fraction, and ending with the filler content. A familiarity with the basic rules of designing aggregate mixes, including the algorithm and calculations, is assumed. To brush up on these rules, refer to a basic text, such as The Asphalt Handbook (MS-4), a publication of Asphalt Institute.