Stage 4
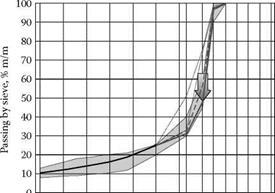
After examining the gradation curve in Figure 6.6, we can conclude that lowering the curve on the 8-mm sieve simply means a reduction in passing from 55 to 45%, which is an increase in the quantity of particles bigger than 8 mm from 45 to 55%. This move means that we should increase the content of 8/11.2 by 10%. This action should be balanced, so 10% has to be taken off the aggregate 5.6/8. As a result, the achieved composition of the mix is shown in Table 6.9 and the gradation curve in Figure 6.7.
Example of the SMA Mix with an Uneven Distribution of the Coarse aggregate Fraction among Three Fractions— predominantly chippings 8/11.2 (example II, stage 4)
 component of aggregate mixture content, (m/m)
Filler 10%
Crushed sand 0/2 15%
Coarse aggregate 2/5.6 mm 5%
Coarse aggregate 5.6/8 mm 15%
Coarse aggregate 8/11.2 mm 55%

![]()
![]()
 0
0
10
![]() 20
20
30
40
50
60
70
80
90
100
FIGuRE 6.7 Example of SMA mix with an uneven distribution of the coarse aggregate fraction among three fractions—the effect of the decrease in quantity of aggregate 2/5.6 and 5.6/8 combined with adding 10% aggregate 8/11.2 (Example II, Stage 4).


Leave a reply