Part i: Coarse Aggregate Content
Designing the coarse aggregate part of an SMA mix differs widely from designing an asphalt concrete (AC) mix. The unexpected difference lies in the various results of similar actions. Let us consider the example of SMA gradation curves.
It should be kept in mind that SMA has a strong aggregate skeleton with little to none of the medium aggregate fraction. Different distributions of sizes within the coarse aggregate fraction can lead to greater or smaller discontinuities in the overall gradation in a course, which can lead to some pretty interesting consequences for the mixture.
MIXTURE S
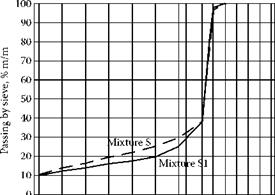
Thus let us take the gradation limits of SMA 0/12.8 mm and insert a gradation curve between them, marking that design as S (Figure 6.2). Grading parameters of the mixture S are shown in Table 6.5.
MIXTURE S1
Let us perform the operation of adding coarse aggregates to the mixture. Now, more coarse graded grains have been added as can best be seen on 2.0- and 4.0-mm sieves. This creates mixture S1 (Figure 6.2). The gradation characteristics of a new mixture S1 may also be found in Table 6.5. The gradation curve for mixture S1 has been moved downward in the area of sieves larger than 2 mm relative to mixture S.
 0
0
10
20
30
40
50
60
70
80
90
100
Sieve, # mm
FIGURE 6.2 Grading curves of S (the dotted line) and S1 (the solid line) mixes – SMA of Example I.
|
TABLE 6.5 |
||
|
Grading Characteristics of Mixtures S and S1 |
||
|
Gradation properties |
mixture s |
mixture s1 |
|
Filler fraction content (grains <0.063 mm), % (m/m) |
10.5 |
10.1 |
|
Sand fraction content (grains 0.063-2.0 mm), % (m/m) |
14.4 |
9.8 |
|
Coarse aggregate content (grains >2.0 mm), % (m/m) |
75.5 |
80.1 |
|
Coarse aggregate content (grains >4.0 mm), % (m/m) |
70.0 |
74.3 |
|
Specific surface area of the mixture, cm2/g |
189 |
170 |
 |
|
Conclusions of the Example I SMA mixture
Conclusions drawn from the analysis of Example I include the following:
• The increase in coarse grains in a mix brings about the lowering of curves in the area of sieves larger than 2 mm. There then follows an increase in particles retained on the 2-mm sieve; all in all, SMA gradation curves behave the same way as those of AC.
• The main difference in gradation between mixtures S and S1 is that the sand fraction (0.063/2.0 mm) of mixture S1 is less by about 5% than that of mixture S, and this percentage of material is moved to fraction 2.0/8 mm of S1 mixture.
• It is easy to observe that the amount of coarse aggregates of fraction 8/11.2 mm is almost the same in mixtures S and S1; this means that the main changes occurred between sieves 0.063 and 8 mm.
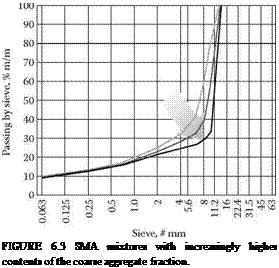
• There are more coarse aggregates in mixture S1, hence the quantity of coarse aggregates carries with it an increase in the air voids in the aggregate mix and an increase in the quantity of binder needed in the SMA. Meanwhile, let us look at Figure 6.3, which shows numerous gradings of SMA mixtures. Each of them contains more and more coarse particles, and the gradation curves move in the direction of the arrow. Naturally, the consequences of such movements are more and more spacious voids among coarse particles.


Leave a reply