Part II: Gradation within the Coarse Aggregate Fraction
When designing the shape of a gradation curve in the coarse aggregate fraction (larger than 2 mm), it is worthwhile to pay attention not only to the percentage of grains larger than 2 mm (retained on a 2 mm sieve) but also to the ratios of contents of various coarse aggregate fractions. According to many recommendations (i. e.,
Schroeder and Kluge, 1992; Voskuilen, 2000), mixtures characterized by a certain deficiency of smaller coarse aggregates, or even a lack of them, should be preferred. So, let us proceed to Example II to discuss changes in the gradation within the coarse aggregates’ fraction. This example is not complicated, therefore we will not encounter any difficulties in its interpretation; this is especially for anyone who often designs using the gradation limits method.
Example ii: Changes in Gradation within the Coarse Aggregate Fraction
Let us start analyzing an SMA mixture that has fixed contents of particles larger than 2 mm at 75% (m/m), filler at 10%, and fine aggregate at 15%. The gradation curves of SMA 0/11 according to ZW-SMA-2001, fine aggregate 0/2, a filler, and 3 fractions of the coarse aggregate (2/5.6, 5.6/8, and 8/11.2) will be used for the analysis. To make the task easier, an assumption has been made that none of the aggregate fractions has any undersized or oversized particles. All percentage values of this example apply to percentage by mass (i. e., mass fraction [m/m]).
stage 1
Briefly, should equal shares of each of the coarse aggregate fractions—2/5.6, 5.6/8 and 8/11.2—be secured, the mixture presented in Table 6.6 is the result.
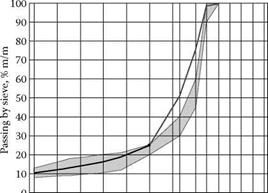
Even though the coarse aggregate fraction totals 75% (m/m) of the mixture and everything seems to be all right with regard to its content, the desired discontinuity of gradation is impossible to achieve by the use of this uniform distribution of constituents (at 25% each) (Figure 6.4). We can even safely say that there is a kind of continuity of gradation within the coarse aggregate fraction.
stage 2
Now let us divide the coarse aggregate fraction into other proportions. According to the conclusions of Example I, more coarse aggregate have to be added but material 2/5.6 mm has to be removed to break the gradation curve and pull it down at the 5.6 mm sieve. In Example II, Stage 1, 25% of the coarse particles pass through the 2-mm sieve (the fixed quantity, as assumed) and 50% through the 5.6-mm sieve (Figure 6.4). The expected level of particles larger than
|
TABLE 6.6 Example of the sMA Mixture with a uniform Distribution of the coarse Aggregate Fraction among Three Fractions (Example ii, stage 1)
|
5.6 mm exceeds 50% (e. g., 70% [passing through the sieve 5.6 mm at 30%]). The result is that the increase in material between sieves 2 and 5.6 (passing at 25% and 30%, respectively) should amount to approximately 5%, which is tantamount to the statement that screening of the fraction 2/5.6 mm in the given aggregate mix should be approximately 5%. Screening of the fraction 2/5.6 mm here is identical with the aggregate 2/5.6 mm. Therefore chippings of 2/5.6 mm have been reduced from 25 to 5%.
The only thing remaining is to decide where to add the regained 20% of the coarse aggregate—to chippings of 5.6/8 or to 8/11.2 mm?
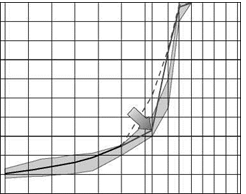
Let us suppose that the regained 20% is being added to 5.6/8 mm chippings, leaving the fraction 8/11.2 unchanged. Table 6.7 presents the mix composition at that stage, while Figure 6.5 illustrates its gradation curve. It should be remembered that the share of material larger than 2 mm remains unchanged and still amounts to 75% (m/m).

![]()

![]()

 0
0
10
20
30
40
50
60
70
80
90
100
FIGURE 6.4 Example of an SMA mixture with an even distribution of the coarse aggregate fraction among three fractions (Example II, Stage 1).
Example of the SMA Mix with an Uneven Distribution of the Coarse aggregate Fraction among Three Fractions— predominantly aggregates 5.6/8 (example ii, stage 2)
 content, (m/m) comments
10% Aggregates for mastic
15%
5% Coarse aggregate >2 mm
45% (total 75% [m/m])
25%
 |
||
Sieve, # mm
FIGURE 6.5 Example of SMA mix with an uneven distribution of the coarse aggregate fraction among three fractions—the effect of a decrease in quantity of aggregate 2/5.6 and the supplement of 20% chippings 5.6/8 (Example II, Stage 2).
A better gap-gradation is a distinctive feature of the achieved gradation curve. The broken shape of the gradation curve of that mix is clearly noticeable. Despite that improvement, the mix is still not acceptable because there is too little material larger than 8 mm. So replacing the 20% chippings 2/5.6 removed with only chippings 5.6/8 has not led to the defined goal. Therefore let us try another variant.


Leave a reply