Category Stone Matrix Asphalt. Theory and Practice

REQUIREMENTS FOR AN SMA MIXTURE DESIGN

Volumetric properties are among the most frequently cited requirements for SMA mixtures checked at the laboratory level. The primary requirement is to ensure the needed content of voids in compacted samples. Mechanical requirements (e. g., stability) are seldom determined, whereas performance-related properties (e. g., resistance to rutting) can be more often seen in specifications. Table 6.13 shows a short summary of different types of requirements. The corresponding summary of requirements for SMA in accordance with the European classification system after EN 13108-5 can be found in Chapter 14.

Requirements for laboratory-designed SMA mixtures according to the European standard EN 13108-5 can be found in Chapter 14 (see Table 14.3).

Upon completing the design of an aggregate mix and the contents of binder and stabilizer (see Chapter 8), it is worth investigating whether the properties of a newly prepared SMA mixture can yield the characteristics required by the customer after construction. A more detailed description of those qualities and related research may be found in Chapters 10 and 12.

Summary of Requirements for SMA Mixtures in Various Countries

TABLE 6.13

property

requirement

example of occurrence

comments

Air void content in

2.0%-4.0% (v/v)

Majority of

Declared recommended

compacted SMA

3.0%-4.5%

countries

range

samples

(v/v) for heavy traffic

<5.0% (v/v)

New Zealand

Declared upper limit

-5.0% (v/v)

Netherlands

(related to so-called refusal density) Recommended value for

VMA mixture

>17% (v/v)

United States

SMA 0/11 in heavy duty pavements

17% threshold used at the

>19% (v/v);

South Korea

stage of production control; 17.5 or 18.0% (v/v) threshold recommended at the recipe stage 19% limit for SMA 0/10;

Voids filled with

>20% (v/v) 70%-85%

Slovenia

20% limit for SMA 0/8 SMA for heavy duty traffic

binder (VFB)

80%-90%

Finland

Recommended 85%

Air voids content in

>2.0% (v/v)

New Zealand

Depending on design

compacted SMA samples with

>2.5% (v/v)

Czech Republic b

methoda

Determined when

maximum compaction energy

Marshall stability

>6.0 kN

Czech Republic b

compacting Marshall samples with the effort 2×100

Only when applying

Uniaxial creep

>16 MPa

Poland b

Marshall method for designing SMA

Used before implementation

stiffness modulus (static mode)

Wheel tracking test

<5%

Poland b

of WTT apparatus EN 12697-22 method—

Austria b

small device; temperature

60°C; 10,000 cycles, method B (PRDa! r or WTSajr)

(Continued)

TABLE 6.13 (CONTINUED)

Summary of Requirements for SMA Mixtures in Various Countries

property

Requirement

example of occurrence

comments

Resistance to water

> 70%

United States

AASHTO T283 method (see

(ITSR)

> 80%

Slovakia b

Chapter 12)

EN 12697-12 method (see

Binder/mastic drainage

> 90%

< 0.3% (m/m)

Poland b The majority of

Chapter 12)

Testing with Schellenberg’s

countries

method or similar

Note: AASHTO = American Association of State Highway and Transportation Officials; PRD = Proportional Rut Depth, result of WTT; SMA = stone matrix asphalt; VMA = voids in mineral aggregate; WTS = wheel tracking slope, result of WTT; WTT = wheel tracking test.

a If samples are prepared with gyratory compactor, the maximum density is read after 300 or 350 gyrations.

b Since 2006 requirements in European CEN members have to be established according to EN 13108-5 and test methods in EN 12697 with test conditions as in EN 13108-20.

6.5 summary

• SMA mixtures may be used both in wearing and intermediate layers.

• The suggested minimum thickness of a course equals 3.5-4 times the max­imum aggregate size.

• As a general rule, heavy traffic loadings require coarser mixtures. In these cases the mixtures 0/11 and 0/12.5 mm are the most popular solutions. Unfortunately, such mixtures also have weak points, including low noise reduction, higher permeability, and worse antiskidding properties in com­parison with finer mixtures.

• The coarse aggregate fraction

• When one designs the composition of the coarse aggregate fraction, to achieve the best gap-gradation the percentages of the finest and inter­mediate fractions should be reduced but the proportion of the coarsest ones should be increased.

• An increase in the content of air voids in the aggregate mix and the amount of binder in SMA result from an increase in the coarse aggre­gate content. Specifying the content of particles larger than 2 mm in an SMA aggregate mix does not explicitly determine either its aggregate structure or its properties; it is necessary to supply information on the amount of particles larger than 5 or 8 mm (or similar sieves).

• Increasing the share of particles larger than 5 mm leads to opening the mix; that effect is even more obvious when increasing the content of particles larger than 8 mm. Therefore, manipulating the content of the coarsest grains offsets the strongest impact on changes in the content of air voids within the coarse aggregate fraction.

• Designing SMA with a very high content of the coarsest particles brings about the necessity of adding a larger amount of binder, and possibly more stabilizer too. Such mixtures are also characterized by higher per­meability and greater compaction resistance.

• Increasing the quantity of flat and elongated particles in a mixture has the following effects:

– Increases the content of air voids in an aggregate mix

– Diminishes the workability of the mix

– Increases the risk of crushing the flat and elongated particles during compaction (followed by squeezing mastic out)

• The sand fraction and filler

• Designing an SMA using the maximum quantity of filler and the mini­mum amount of fine aggregate is disadvantageous

• The quantity of filler should generally be near the middle of the allow­able range, which means about 9-10% (m/m), to enable an appropriate amount of 0.063/2-mm material on sieves less than 1.0 mm.

• Using high quantities of natural (non-crushed) sand should be avoided, and for SMAs created for heavy traffic, its use should be generally excluded.

• A surplus of mastic in comparison with the void space among chip – pings causes the appearance of fat spots and a local decrease in antiskid properties.

• Too low a quantity of mastic means a too large an air void content in a compacted course, high absorption and water permeability, and conse­quently a shorter life.

• The binder content

• Corrective coefficients of the binder content that are dependent on the aggregate density should be used.

• The content of air voids in an SMA mixture design should not be adjusted by changing the binder content; it should be done with cor­rections of contents and gradation of the aggregate fractions, including the following:

– The content of the coarse aggregate fraction (see Section 6.3.1.1)

– The ratios of constituents within the coarse aggregate fraction (see Section 6.З.1.2.)

– Filler content

– Binder content, as a final resort

• The content of VMA can be evidence of problems with air voids in com­pacted SMA specimens; an increase in VMA should be achieved by add­ing coarser chippings (more material retained on a 4 mm or 5 mm sieve) or by decreasing the amount of filler, while a decrease in VMA should be achieved by adding finer chippings.

• When comparing volume requirements of various guidelines, one should keep in mind major differences in procedures for determining density, which eventually change the range of results.

REQUIREMENTS FOR AN SMA MIXTURE DESIGN

DESIGNING A BINDER CONTENT

Selecting the binder content in a design SMA mixture is relatively easy. With a cor­rectly designed aggregate mix, it is enough to remember an appropriate content of voids in compacted samples. A thorough understanding of that subject will surely be made much easier by reading Chapter 7, including the description of both the U. S. and Dutch methods, and the section in Chapter 8 on preparing samples.

The majority of SMA guidelines have stipulated minimum contents of binder for a specific SMA mixture, and a limitation on the maximum quantity of binder has occasionally appeared. In each case, it should be kept in mind that these limits have been introduced in relation to the expected density of an aggregate mix (see Section 6.3.1.4).

Designing the binder content in SMA is the next stage of work after fixing the composition of an aggregate mix (using any method). Normally, the aim is to deter­mine the content of the binder, that enables achieving the expected level of voids in compacted mix samples.

The method of compaction (Marshall versus gyratory) influences the final opti­mum binder content, therefore it is very important to use equivalent compactive efforts. For example, the number of rotations should equal 2 x 50 blows in Marshall or, alternatively, the number of gyratory revolutions should be standardized and used consistently. Improper parameters of gyratory compaction lead to misleading results of optimum binder content. The description of this topic is in Chapter 8.

Using analytical formulae that enable the determination of the optimum quan­tity of binder in a mixture is increasingly rare. These equations were invented based on the conversion of the specific surface area of an aggregate mix, and the determination of the film thickness needed to coat the aggregate. Nevertheless, it is necessary to say clearly that the probability of finding the optimum quantity of binder is not high because the most frequently used conversion factors were adopted for AC but not for SMA. Naturally, they do not take into account the specificity of forming voids among particles of a skeleton as we saw in Part I.

The a priori assumption of a specific content of binder in SMA is another very interesting aspect of selecting an optimum quantity of binder. Given an optimum binder content, an adequate aggregate mix is selected to allow the required amount of binder, making use of rules already known by the reader. The first of these rela­tions is between the content of voids and gradation of the coarse aggregate fraction. This approach is used in the Dutch method (see Chapter 7).

Filler Content

In the majority of worldwide regulations for SMA, the content of particles passing through the smallest sieve (0.075 or 0.063 mm ) generally ranges between 8% to 13% (m/m). However, adopting extreme quantities may be a risky business—that is, 8% can lead to building too little mastic. On the other hand, a large quantity of filler (e. g., approximately 13%) may generate too high a content of mastic, making it susceptible to overstiffening or increasing the risk of forming fat spots.

It has been discussed in Chapter 3 that the optimum relationship between quanti­ties of filler and binder is best illustrated by the filler-to-binder ratio (by weight or volume). This means that each quantity of filler corresponds to a certain optimum amount of binder. The details behind this assumption are inexact, resulting per­haps from experience with a run-of-the-mill filler in a given country. After reading Chapter 3, it should be clear that there are all sorts of fillers and the differences between them do not lie only in one specific area (e. g., gradation, degree of grind­ing) but also in the different content of voids in the compacted filler (determined using Rigden’s method).

Content of the Fine Aggregate Fraction

In classic SMA composition and in regulations introduced all over the world, the total content of grains smaller than 2 mm has generally been in the range of 15-30% (m/m). When we add the typical filler content (8-13%), we receive up to 22% from the sand fraction (0.063/2.0 mm). But when designing the content of fine aggregate in SMA, one should remember the increase in the content of fine particles during compaction due to crushing and wearing of the coarse particles.

Is the sand fraction desired in a mix? Looking at the shape of an example SMA gradation, we can imagine a mix designer adding all the permitted quantity of filler (i. e., approximately 13% [m/m]) instead of 0.063/2.0 material. This example is illus­trated in Figure 6.13. As can be seen, the gradation curve stays within the limits up to the 0.85 mm sieve. Then it takes the “low route,” meaning that there are too few fine particles, which are needed for mastic creation. Undoubtedly, composing an SMA without the material 0.063/2.0 is not possible.

The sand fraction is indispensable because building a mastic with only filler grains makes achievement of the expected features of a newly designed SMA impossible. So is it possible to determine the best course of a gradation curve in the area below

Подпись: VO О d Подпись: Sieve, # mmПодпись: a a > .<o Подпись: "ns Сі 100

0

Подпись: FIGURE 6.13Example of a SMA aggregate mix gradation without fine aggregate (0/2 mm).

2 mm? There is not an unequivocal answer to this question because a lot depends on the type and properties of filler and features of the 0.063/2.0 material, too. The intended use of the designed mix is also of great significance. However, the follow­ing is worth bearing in mind:

• Guiding the curve upward enhances the risk of closing the mix and raises the threat of excessive mastic and the appearance of fat spots.

• Guiding the curve downward enhances the risk of an excessive opening of the mix.

• Designing using the maximum quantity of filler and the minimum amount of the sand fraction is disadvantageous and risky.

• Care ought to be taken so that an increase of the sand fraction can be observed on subsequent sieves to supply enough material for making mastic.

• The quantity of filler should fluctuate around the middle of the allowable range (i. e., about 9-10% [m/m]) to make possible the collection of material on sieves smaller than 1.0 mm and to prevent the gradation curve from ris­ing upward.

• Non manufactured (natural) sand may be applied only for SMA layers on roads with low traffic volumes.

Designing an Aggregate Mix Less than 2 мм

When designing the gradation of aggregate smaller than 2 mm (filler and fine aggre­gate), it should be kept in mind that the excellent properties that allow SMA to resist permanent deformation are connected mainly with a coarse aggregate skeleton. Mastic made of filler, fine aggregate, and binder should play the role of bonding and sealing the coarse aggregate, while its quantity cannot be greater than the free space left among the compacted active grains. See Chapter 7 for a discussion of the Dutch method of designing the volume of mastic in SMA.

Laboratory Example

The relationship between the contents of air voids and coarse grains is well-illus­trated by the laboratory example described next.

Two mixes, identified by letters E and F, were produced in laboratory conditions to demonstrate the differences between SMA mixtures with the following different gradations:

• Mix E is characterized by a lesser discontinuity (more uniformity) of gradation.

• Mix F, designed according to U. S. gradation curves using NAPA SMA Guidelines QIS-122, has a much higher content of coarse aggregate particles.

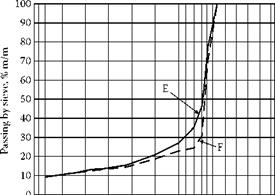
Both mixes were prepared with the use of a combination of sieves. The same combination has been applied to present gradation curves and to perform analyses of the aggregate mixes. The gradation curves of aggregate mixes E and F are shown in Figure 6.11. The aggregate mixes are compared in Table 6.12.

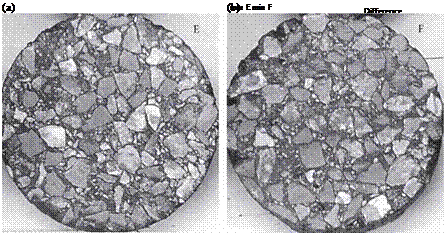
Figure 6.12 shows photographs of cross sections of the Marshall specimens of mixes E and F.

Mix F is distinguished by a higher discontinuity of gradation (aggregate 5.6/8 is missing from the composition) and a lower content of the sand fraction (by 2.5%). It is worth observing that the difference between contents of the fraction larger than 2 mm amounts only to 1.9%. The most significant differences appear on the 6.3 and

8.0 mm sieves. Differences between the mixes increase along with an increase in the sieve size. Mix F has been made in accordance with the U. S. gradation curves using NAPA QIS-122, which is based on an assumption that the direct contact within coarse

Подпись: so t--. o о d dПодпись: •Ф so со oom c-Подпись: Sieve, # mmПодпись: FIGURE 6.11 Grading curves of mixtures: E (solid line), F (dotted line)image530

10

20

30

40

50

60

70

80

90

100

TABLE 6.12

Laboratory Example

Composition of the Aggregate Mixes E and F

FIGuRE 6.12 Photograph of cross sections of Marshall specimens of mixes E and F. (Photo courtesy of Halina Sarlinska.).

chippings should be guaranteed—that is, the condition of stone-to-stone contact has to be satisfied. Both SMA mixtures were manufactured with the same fixed amount of binder (6.4% by mass), while the differences between them are obvious when com­paring the contents of voids in the Marshall specimens. The air void contents are as follows: mix E had 4.7% (v/v) and mix F had 5.2% (v/v).

Thus an increase in the content of coarse particles—and furthermore in the coarsest fraction of the coarse particles—brings about a definite opening of the SMA mixture. In other words, when moving the gradation curve toward higher contents of coarse grains, one should take into account the increase in the binder content, and probably the stabilizer as well.

Part iv: impact of the Grains’ Density

The appearance of significant differences in density among individual fractions of the aggregate mix compels us to discuss volume relations in the aggregate mix and necessary adjustments to the binder content

Substantial differences in the densities of aggregates combined in an SMA can cause numerous problems. This situation happens rather seldom; however, it is pos­sible to find very light material combined with very heavy aggregate (e. g., densities of approximately 2.400 and 3.100 Mg/m3, respectively). When designing a particular mix, results of the sieve analysis of constituent aggregates, as well as the overall gradation curve of a mix, indicate the gradation sieve distribution in mass units. In fact, mass and volume distributions do not correspond with each other if there are substantial differences in the densities of aggregates. Hence, guidelines have been created to regulate the allowable difference between densities. For example, a differ­ence of approximately 0.2 Mg/m3 is allowed according to AASHTO M 325-08; if it is higher, the sieve distribution should be converted into volume units. Conducting the sieve analysis and determining the results in volume units have not always been practiced outside the United States

Besides problems with the aggregate mix, the use of aggregates with differ­ent densities brings about the necessity of correcting the binder content. For that purpose, correction coefficients have been used all over the world. Approximate, or “framework,” binder contents in SMAs have been detailed in various reference documents (e. g., standards, guidelines, recommendations) from many countries. The given minimum quantities of binder have been established based on a reference den­sity of an aggregate mix.

For example, in the NAPA SMA guidelines QIS-122 the minimum content of binder in SMA amounts to 6.0% (m/m), but that is the value for a reference aggregate density equal to 2.750 Mg/m3. If the aggregate mixture density is different from the reference one, an adjustment should be made according to the following principles:

• 0.1% of the binder for each 0.05 Mg/m3 of difference between the density of an aggregate mix and the reference density (2.75) could be added or subtracted.

• For a density smaller than 2.75 Mg/m3, the correction bears the plus sign (+); for a density larger than 2.75 Mg/m3, it bears the minus sign (-).

Since 2006 the rules for correcting binder contents have been standardized in European member states of the CEN. The correction coefficient a for aggregate mixes with densities different than 2.650 Mg/m3 has been adopted in the European standard EN 13108-5 on SMA. The minimum content of binder stipulated by the requirements of this standard should be adjusted depending on a calculated as follows:

2.650 a =

Pa

where:

• a = The coefficient adjusting the binder content

• pa = The density of the aggregate mix determined according to EN 1097-6

For a thorough description of the requirements of the EN 13108-5 standard, see Chapter 14.

Part iii: Shape of Particles of the Coarse Aggregate Fraction

The shape of the aggregate particles, from flat and elongated to cubical ones, exer­cises a certain influence on the SMA mixture. A high content of flat and elongated particles has the following effects:

• Increases the content of air voids in a compacted mixture of coarse (active) aggregates

• Decreases the workability of a mixture

• Increases the risk of fat spots appearing when compacting the SMA course

In the German DAV handbook (Druschner and Schafer, 2000), attention has been paid to the impact of the shape of particles from the fraction 2/5.6 mm on the content of voids in SMA, especially with reference to the SMA mixtures 0/8 and 0/8S.

Summary of Part II on the Gradation of the Coarse Aggregate Fraction

A fixed coarse aggregate content was assumed in Part II of the design example. We explored the subdividing of the coarse aggregate fraction and its subsequent conse­quences. We saw that the shape of the gradation curve in the area larger than 2 mm has great significance on the properties of an SMA mixture. Thus, by increasing the predominance of very coarse grains, we increase the following:

• Resistance to permanent deformation (in general, but not in all cases)

• The content of VMA

• The binder quantity

• The permeability of a course

A final remark: setting up the skeleton using only the coarsest particles—namely, creating a single-sized mixture—will bring about possible problems with the inter­locking of the skeleton grains; contrary to expectations, such a course will be of poor quality.

Grading of the Coarse Aggregate Fraction versus the Distribution of Air Voids

Investigations carried out in the Netherlands (Voskuilen, 2000) have proved that the gradation within the coarse aggregate fraction exerts an impact on the distri­bution of voids in a mix. Briefly, the conclusions drawn in the Netherlands are as follows: [25]

6.3.2.2.3 Determining the Size of Active Particles

After exercises in changing ratios within the coarse aggregate fraction, it is time to explore the question of the influence of the size of active particles on the mix. As we remember from Chapter 2, active grains are those making an aggregate structure that carries loads. The problem of actively setting up the SMA skel­eton by particles of a certain fraction—say, 2/4 (or 2/5.6) mm—was discussed there. According to the German approach to SMA, that size of particle could be used for that purpose, though to a limited extent (as the German ratios suggest that in SMA 0/11 only one seventh of all coarse aggregates should be of size 2-5mm). According to the U. S. approach, this size should not be used, although that depends on the maximum size of the SMA aggregates, or NMAS. The lower limit sieve, from which active particles are counted, is called the breakpoint (BP) sieve in the United States.

Подпись: NMAS: 25 mm NMAS: 19 mm NMAS: 12.5 mm NMAS: 9.5 mm NMAS: 4.75 mm Подпись: BP sieve = 4.75 mm BP sieve = 4.75 mm BP sieve = 4.75 mm BP sieve = 2.36 mm BP sieve = 1.18 mm

The adopted classification in the United States—in NAPA SMA Guidelines QIS – 122—imposes lower size limits for coarse (active) particles based on NMAS as follows:

At any rate, coarse particles 2.36/4.75 mm (below 4.75) have been regarded as active ones in SMA 0/9.5 mm. In SMA 0/4.75 mm, the fraction 1.18/2.36 mm is also considered an active one (as are all larger ones). In coarser mixes, aggregates above

4.75 mm are regarded as active.

The selection of the BP sieve influences not only on the shape of the gradation curve but also the properties of SMA mixtures. Generally, the larger the BP sieve, the stronger the predominance of coarse (active) particles in a mix. One can safely say that the coarse aggregate fraction becomes more single sized as the discontinu­ity of gradation becomes stronger. When estimating gradation curves for various BP sieves, the conclusion can be drawn that the larger the BP sieve, the further the position of the breaking point of the gradation curve is moved to the right. And thus one can also say that the larger the BP sieve, the more open the mix and the more binder is required.

Results of some work in the United States (Cooley and Brown, 2006) justify say­ing that raising the size of the BP sieve results in the following consequences to the properties of an SMA mixture because it increases: [26]

• Permeability of the mixture—with the same content of voids in a com­pacted SMA mixture, the permeability is higher with a larger BP (for more on permeability, see Chapter 12).