Laboratory Example
The relationship between the contents of air voids and coarse grains is well-illustrated by the laboratory example described next.
Two mixes, identified by letters E and F, were produced in laboratory conditions to demonstrate the differences between SMA mixtures with the following different gradations:
• Mix E is characterized by a lesser discontinuity (more uniformity) of gradation.
• Mix F, designed according to U. S. gradation curves using NAPA SMA Guidelines QIS-122, has a much higher content of coarse aggregate particles.
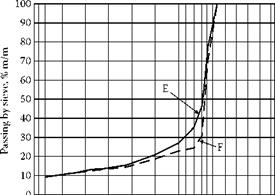
Both mixes were prepared with the use of a combination of sieves. The same combination has been applied to present gradation curves and to perform analyses of the aggregate mixes. The gradation curves of aggregate mixes E and F are shown in Figure 6.11. The aggregate mixes are compared in Table 6.12.
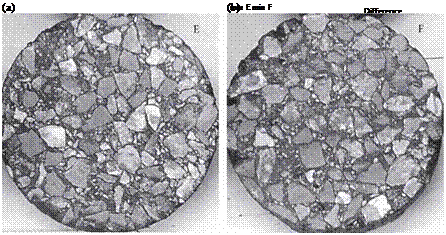
Figure 6.12 shows photographs of cross sections of the Marshall specimens of mixes E and F.
Mix F is distinguished by a higher discontinuity of gradation (aggregate 5.6/8 is missing from the composition) and a lower content of the sand fraction (by 2.5%). It is worth observing that the difference between contents of the fraction larger than 2 mm amounts only to 1.9%. The most significant differences appear on the 6.3 and
8.0 mm sieves. Differences between the mixes increase along with an increase in the sieve size. Mix F has been made in accordance with the U. S. gradation curves using NAPA QIS-122, which is based on an assumption that the direct contact within coarse
![]()
![]()


 0
0
10
20
30
40
50
60
70
80
90
100
 |
Composition of the Aggregate Mixes E and F
FIGuRE 6.12 Photograph of cross sections of Marshall specimens of mixes E and F. (Photo courtesy of Halina Sarlinska.).
chippings should be guaranteed—that is, the condition of stone-to-stone contact has to be satisfied. Both SMA mixtures were manufactured with the same fixed amount of binder (6.4% by mass), while the differences between them are obvious when comparing the contents of voids in the Marshall specimens. The air void contents are as follows: mix E had 4.7% (v/v) and mix F had 5.2% (v/v).
Thus an increase in the content of coarse particles—and furthermore in the coarsest fraction of the coarse particles—brings about a definite opening of the SMA mixture. In other words, when moving the gradation curve toward higher contents of coarse grains, one should take into account the increase in the binder content, and probably the stabilizer as well.


Leave a reply