Category Stone Matrix Asphalt. Theory and Practice

Production process

Suppose that we have already developed the job mix formula and that well-perform­ing batching devices, a screen deck, balances, and so on are at our disposal. Then we are ready to start production. A common occurrence with starting up an asphalt plant is the instability of the mixture temperature during the first production period. Therefore one should take into account that some batches will be underheated, while others will be slightly overheated. Such waste material should be rejected.

9.3.1 SMA Production Temperature

Two components of an SMA mixture must be heated—the aggregate and the binder. This heating is aimed at (1) eliminating moisture from the aggregate to a level that enables the proper coating of the aggregate grains and (2) maintaining the appropri­ate temperature of the mixture delivered to the laydown site, which allows for its proper placement and compaction. The coating temperature is directly related to the viscosity of the chosen binder. The harder the binder or the more highly modified the binder is, the higher the production temperature must be. That is why the SMA production temperature is most often specified as a function of the type of binder.

The SMA production temperature has been diversely defined in different coun­tries in the following manner: [56]

reveal data and ensure substantially uniform conditions for SMA produc­tion; EN standard 13108-5 (which applies only to unmodified binder) is a good example of such a document.

• Variant 2—the manufacturer of the binder discloses information on the rec­ommended production temperature; this method has been used for modi­fied and special binders.

• Variant 3—the viscosity range of the binder is used as the basis for the inde­pendent determination of the production temperature; in this case the vis­cosity-temperature relationship should be defined to allow determination of the range of temperatures that produces the needed binder viscosity.

An overview of SMA production temperatures according to selected documents is displayed in Table 9.1. A wide range of temperatures is specified in this table. One should remember that each increase of the mixing temperature enhances the risk of binder-mastic draining off the aggregate while also increasing the binder aging. The classic draindown test with Schellenberg’s method is carried out at 170°C, producing incomplete information about its behavior at higher temperatures. That is why it is a good idea to conduct another draindown test at a higher temperature that reflects the possible SMA production temperature (see Chapter 8).

PRACTICAL CONSIDERATIONS OF THE SMA PRODUCTION PROCESS

By and large, the production of an SMA in contemporary asphalt plants does not present particular problems. The following are a few general tips about the production of SMA:

• SMA requires some production consistency with no breaks, stoppages, or similar “jerking” of the production process. Any alterations to the type of mixture being produced require adjustments of the batching device con­trols, the weight of mixture constituents for the mixer, and so on. Potentially more troublesome, any stoppages necessitate restarting the machine and beginning the production again.

• The moisture content of the aggregate leaving the dryer should not be higher than 0.5%, optimally less than 0.2% (USACE Handbook, 2000).

• When initial batching (cold feeders) limits the machine’s output, an addi­tional batching device should be considered; bear in mind that coarse aggregates constitute more than 70% (m/m) of the mixture and may require more than one bin to feed that large a quantity.

• Due to the small amount of sand in an SMA, coarse aggregates passing through the dryer’s drum are exposed to more intense heating; therefore it is important to make sure that the asphalt mixture is not overheated.

The Production of SMA

Having designed and checked the SMA mixture, the time has come to produce it according to the job mix formula (JMF). In this chapter we shall deal with

• Requirements for the organization of an asphalt plant

• Assumptions and control over the SMA production process

• Production of the SMA mixture in a batch plant or in a drum-mix plant

• Storage of manufactured SMA in a silo

9.1 REQUIREMENTS FOR THE ORGANIZATION OF AN ASPHALT MIXING PLANT

The organizational requirements of an asphalt mixing plant and its surround­ings are much the same for the production of SMA as for other asphalt mixtures. Some special issues may arise, however, when dealing with SMA, such as the following:

• Storage of aggregates

• Stockpiled aggregate should not be mixed with underlying-soil material.

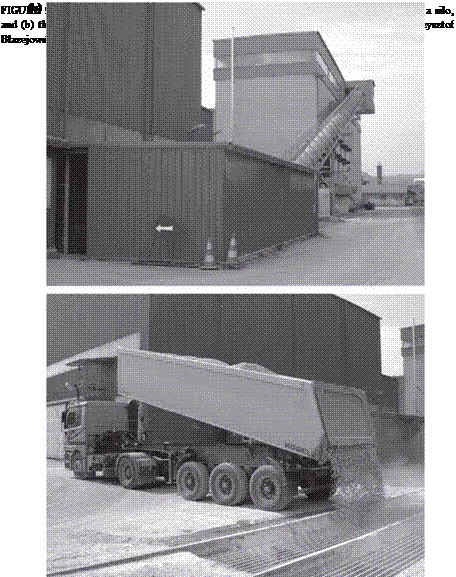
• Covered aggregate stockpiles may be desirable, especially for the fine aggregate stockpiles; a lower aggregate moisture content improves the plant’s output; aggregates may also be stored in silos, after preliminary drying, but this is still rarely done (see Figure 9.1).

• Storage of stabilizers—covered storerooms may be used; dry storage is especially important when storing loose stabilizers (nongranulated).

Two types of asphalt plants may be singled out with regard to the manner of mixing components—batch plants and drum-mix plants. Batch plants are the most popular in Europe, whereas drum-mix plants may be seen elsewhere in the world. Drum-mix plants can be adapted for SMA production, however, they require some special solutions for batching stabilizers.

The output of a particular asphalt plant should be adjusted to the intended place­ment efficiency (e. g., the width and thickness of a course, the distance from the work site, and the number of trucks for transportation) in order to organize the SMA laydown so that the stops of the paver are kept to a minimum. Keeping the paver moving forward steadily helps improve the smoothness of the final pavement and limits differential cooling of the mat.

image81

It is easier to produce the SMA mixture in conformity with a job mix formula if the sieves in the screen deck of a batch asphalt plant are properly selected, making control of the mineral mix easier. Improperly selected sieves may results in too wide a hot-bin size range (e. g., 2/10 mm for SMA 0/12.5), which may cause problems with adequately controlling the mix production in accordance with the mix design.

Method for Testing the Increase in Mortar Viscosity

Some references to a method consisting of the testing of mortar viscosity and com­paring it with the pure binder viscosity may be found in the literature. By and large, such a comparison would be a stiffening factor. However, as it has been pointed out in Anderson’s work (Anderson, 1987), not only do the filler properties affect that factor but the properties of the binder used for testing do as well. Certainly the reli­ability of that method is controversial.

8.3.2 Other Factors and Filler Tests

8.3.4.1 German Filler Test

An interesting and simple method of testing fillers is that discussed in the study by Kandhal et al. (1998). Called the German Filler Test,[55] it consists of determining the amount of filler required to absorb 15 g of hydraulic oil and is carried out as follows:

1. Put 15 g of hydraulic oil into a small melting pot, add 45 g of filler, and mix them together.

2. Shape the mixture into a ball.

3. If shaping the ball is successful (i. e., it does not break down) put it into the pot again and add another 5 g of the filler.

4. Having mixed both components, shape the ball one more time and inspect its cohesion.

5. Repeat with another 5 g filler batch until the ball breaks down (lost cohesion).

It is then assumed that the 15 g of hydraulic oil have been completely absorbed by the filler air voids. The test also indicates there is a lack of free oil (similar to free binder) in the mixture that might bond the mortar together. In that case, the result shows the quantity of filler (in grams) required to achieve that condition. The results of this test show a very good correlation to results from the modified Rigden test (Kandhal et al., 1998).

Other Methods

Various methods of testing for an increase in the softening point are used in many countries. For example, in Germany, two methods are applied: the R&B method and Wilhelmi’s method. According to an U. S. review of fillers (Harris and Stuart, 1995), in Germany an acceptable range of AR&B of 10-20°C has been adopted for the R&B method, with components selected at the filler-binder content ratio (F:B) equal to 65:35, % (v/v). Mortars with AR&B greater than 20°C are too stiff and are not accepted. Similarly, mortars with AR&B less than 10°C are not accepted due to their excessive plasticity.

Another interesting test applied in Germany is the determination of a stiffen­ing factor (in Germany Stabilisierungindex) (Schellenberger, 2002). It is an F:B for which the mortar AR&B increase is equal to + 20.0°C. It is necessary to make a series of filler-binder mixtures with different F:B ratios (e. g., 1:1, 1.5:1, and 2:1) and then determine a AR&B increase compared with the pure binder R&B. As a result, we obtain a graph showing the increase versus the F:B ratio; this can be interpreted as the relationship of the stiffening power of a given filler. When studying the results of stiffening factor tests, it is taken as a general rule in Germany that the results should be higher than approximately 1.9. The lower the stiffening factor, the stronger the stiffening impact of that filler on an asphalt mix.

Basically, the results of the tests lead to the conclusion that research on the increase in a softening point does not always reveal all the negative properties of a filler (e. g., swelling). Nevertheless, their merits lie in the ease with which the softening point can be measured through the R&B method.

Tests of Filler Stiffening Properties Filler stiffening properties may be tested with the following methods

• Methods of increasing of softening point—ring and ball (R&B) method, according to EN 13179-1 (delta ring and ball), and similar methods

• Rigden’s method, according to EN 1097-4, and Rigden-Anderson’s method

• The method of increasing mortar viscosity

The two European tests cited in EN 13043 (EN 13179-1 and EN 1097-4) are carried out for an added filler and the 0/0.125 mm fraction sieved out of the fine aggregate (or an aggregate of continuous grading with D less than or equal to 8 mm) that contains more than 10% dust. Let us dedicate some time to discussing those tests since under­standing them will help determine the expected values of a good filler.

8.3.3.1 Method of a Softening Point Difference

8.3.3.1.1 Method EN 13179-1 (Delta Ring and Ball)

What is delta ring and ball (AR&B)? According to EN 13179-1, it is an increase in the R&B softening point of a binder-filler mixture consisting of 37.5 parts of filler and 62.5 parts of binder by volume, related to the R&B softening point of the pure binder used for testing. The part of the filler passing through the 0.125 mm sieve and, according to EN 1259, road binder type 70/100 are used for testing. Measurements are taken according to EN 1427. The final result is denoted AR&B (or in simplified terms, delta).

European countries, which created their requirements for fillers according to the common EN 13043 standard, mostly require a class AR&B8/25, which signifies a stiff­ening power between 8°C and 25°C.

Ridgen’s method modified by Anderson

The U. S. method (here called Rigden-Anderson) described in Anderson (1987) stipulates 25 strokes of the 100 g dead weight. Results of the measurements form the basis for calculating the volume of air voids in a dry compacted filler. Only 1.0-1.3 g of filler is needed to conduct the testing. After determining the content of air voids in the compacted filler, the calculation of free and fixed binder may be per­formed (by mass and by volume). The concept of free and fixed binder is presented in Chapter 3.

8.3.2.2 comparison of methods

Rigden’s method (the European procedure) and Ridgen’s as modified by Anderson (the U. S. procedure) produce different contents of air voids in the same compacted [54] filler. This is caused by a lower compacting effort in the U. S. method (25 strokes) than in the European one (100 strokes). Much research, particularly in the United States, has been carried out with the use of Ridgen-Anderson’s method. The results would be very valuable for Europeans, but test conditions differ to such an extent that a simple comparison of results is rather impossible.

Determination of Compacted Filler Air Voids after. Rigden’s and Rigden-Anderson’s Methods

Rigden’s and Rigden-Anderson’s methods apply to any fine material used as a filler in hot mixes (e. g., bag-house fines and added filler). Filler air voids make up an air volume occurring among grains of filler compacted with a special apparatus by a standardized method. Test methods according to the EN standard (Rigden) and the U. S. procedure (Rigden-Anderson [Anderson, 1987]) differ markedly, which makes the direct comparison of results impossible. The only feature they have in common is their principle—dry compaction of filler.

8.3.2.1 Rigden’s Method after EN-1097-4

The EN method provides for compaction of a dry sample of filler by 100 strokes of a dead weight every second. The mass of sample is 10 g, and the mass of the dead weight is 350 g.

The volume of air voids is estimated, taking into account the mass of the com­pacted sample, its volume, and the filler density. European countries have used the EN 13043 standard for aggregates for asphalt mixes. The most frequently adopted requirement for a filler tested according to EN 1097-4 is the category V28/45, which means the content of air voids should be within 28-45% (v/v).

Summary and Comments on Draindown Testing

The methods of draindown testing described in this chapter differ in details. Table 8.4 shows the most important differences among them. Table 8.5 depicts commonly adopted assessment criteria of draindown testing results.

The following remarks deserve mention: [50]

TABLE 8.3

Drain-Off Test Parameters for Schellenberg’s Method according to EN 12697-18

Подпись: Number of samples Test temperature Подпись: Sample weight Подпись: Test time duration Test procedure Test three samples of the same mix with the same binder content.

Test temperatures depend on the binder type:

1. For road binder—at the production temperature of a mix defined according to EN 12697-35 and raised by 25°C

2. For modified binder—at the production temperature of a mix defined by the binder supplier and raised by 15°C

• Mass of an aggregate mix sample—1000 g for a mix with the density of 2.65-2.75 g/cm3

• If the density of an aggregate mix is different from the given reference density, a sample mass should be calculated to obtain the same test material volume

60 ± 1 minutes

1. Prepare three batches of aggregate (batches 1, 2, 3) and place batch in a metal container.

2. Put the beakers in the oven at the test temperature for 15 minutes minimum; then remove them, weigh them with an accuracy of 0.1 g, and return them to the oven.

3. Mix 1 kg of a bituminous mixture at the fixed temperature according to EN 12697-35.

4. Remove the beaker for batch 1 from the oven, quickly put the prepared mix in the beaker, weigh the beaker with the mix with an accuracy of 0.1 g, write down the time and the beaker number, and return the beaker to the oven (it should not be left outside the oven for longer than 60 seconds)

5. Prepare the two remaining batches of the mix in the same way and put them in the beakers.

6. Keep each beaker with the mix in the oven for 60 ± 1 minutes.

7. Remove the first beaker with the mix, measure its temperature, and put the mix aside.

8. Remove the remaining two beakers with the mix from the oven and empty them out by tilting them upside down and holding them in that position for 10 ±1 seconds.

9. After cooling beakers No. 2 and No. 3, weigh them together with the remaining binder with an accuracy of 0.1 g.

10. If more than 0.5% of the initial mass of the mix remains on the beaker walls (including aggregate grains and mastic), the material remaining in the beaker should be washed with the solvent and passed through a 1-mm sieve; next, the material remaining on the sieve should be dried and weighed with an accuracy of 0.1 g.

11. Determine draindown as the percentage of the binder mass remaining in the beaker compared with the mass of the mix.

12. Calculate the material draindown, D, and when appropriate, the material remaining on the 1-mm sieve, R:

Подпись:(W – W – W4)

(W2 – W1)

(Continued)

TABLE 8.3 (CONTINUED)

Drain-Off Test Parameters for Schellenberg’s Method according to EN 12697-18

Подпись: R = 100 xW,

(W – W)

where

D = Material draindown (% m/m)

R = Material remaining on the sieve 1.0 mm (% m/m)

W1 = Mass of the empty beaker (g)

W2 = Mass of the beaker with the mix (g)

W3 = Mass of the empty beaker together with remaining mastic (g)

W4 = Mass of the dry material remaining on the 1.0-mm sieve (g)

13. The average result of two measurements should be given with an accuracy of 0.1%.

14. Results for D and R (if applicable) should be reported.

Подпись: RemarksNone of the three beakers containing the mix may be kept in the oven for longer than 60 ± 1 minutes.

• While mixing components of the mix, pay attention to the proper sequence of their dosages, particularly fibers, polymers, and so on.

• In the case of modified binder, a lot of mastic can stick to the walls of the beaker and remain there when emptied out (due to increased tackiness of a mix). In such a case, retesting should be conducted at a temperature 5°C higher. If the new result is lower than the previous one, it should recorded in a report.

• If the difference between the test results for two samples of the same mix with the same binder content exceeds 0.5%, a new pair of samples should be tested. [51] [52]

TABLE 8.4

A List of Differences among Methods of Draindown Testing

Test Time Duration

method

Test Temperature (°С)

(min)

Container

Original Schellenberg’s

170 ± 1

60 ± 1

Glass beaker

method

AASHTO T 305-97

Depends on the SMA production

60 ± 5

Wire basket

temperature and type of binder

or 70 ± 5

EN 12697-18 (Part 2)

Depends on the type of binder

60 ± 1

Glass beaker

TABLE 8.5

assessment criteria of draindown Testing Results

drain-off Testing result, % (m/m) assessment

>0.3 Risk of binder draindown

0.2-0.3 Acceptable value

<0.2 Recommended value [53]

8.2 FILLER TESTS

8.3.1 Tests of Specific Surface with the Use of Blaine’s Method

Blaine’s method is chiefly used when testing cement (grinding gradation control). It consists of the measurement of time necessary for air to flow through a compressed layer of tested material of a given size and porosity. At standard conditions, the specific surface is directly proportional to 4t (t = time of air flow). A master sample with a known specific surface is required to calibrate testing. The test can be carried out according to EN 196-6.*

Method after AASHTO T 305-97

The U. S. method of mastic draindown testing has been described in the standard AASHTO T 305-97. It is used for porous asphalt mixes (also called open-graded friction course [OGFC]) and SMA mixes. Test parameters are shown in Table 8.2.

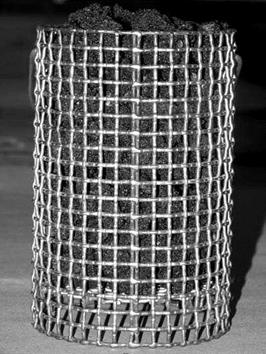
Samples of the mix are placed in wire baskets (Figure 8.3). For SMA mixes equal to and larger than 9.5 mm maximum aggregate size, the basket should have

6.3 mm holes in the mesh, and for 0/4.75 mm SMA mixes, the holes should be 2.36 mm.

8.2.3 Methods after EN 12697-18

The two methods of draindown testing that are given in the European standard EN 12697-18 are the method with a basket and Schellenberg’s method. The method with a basket after EN 12697-18 (Part 1) is mainly used for draindown testing of porous asphalt. In principle, it is possible to determine only binder draindown but not mastic

TABLE 8.2

Draindown Test Parameters according to AASHTO T 305-97

Подпись: Number of samples Test temperatureПодпись: Sample weight Test time duration Test procedureПодпись:Four total; test two samples of a mix at each of the two test temperatures.

Samples are to be tested at two temperatures:

1. The expected production temperature in an asphalt plant (two samples)

2. A temperature higher by 15°C than the expected production temperature (two samples)

1200 ± 200 g

60 ± 5 minutes (or 70 ± 5 minutes in case of oven cooling)

1. Weigh the tray to catch flowing mastic to an accuracy of 0.1 g.

2. Mix components of an SMA mix at a fixed temperature.

3. Put the prepared mix into a weighed wire basket; do not pack the mix into the basket, and do not postcompact it either.

4. Measure the basket mass with an accuracy of 0.1 g.

5. Check the temperature of the mix; it should not drop by more than 25°C below the desired test temperature. If it does cool too much, the mix should be kept in the oven for 10 minutes longer, (i. e., up to 70 minutes).

6. Place the basket with the mix on the tray, and then put it into the oven for 60 ± 5 minutes.

7. Remove the tray with the basket from the oven, and weigh the basket with the mix or the tray itself with an accuracy of 0.1 g.

8. Determine draindown as a percentage of the mastic mass remaining on the tray in relation to the total mass of the mix before testing.

• When stirring the mix components, pay attention to the proper sequence of their dosages, particularly fibers, polymers, and so on.

• The temperature of aggregate in the oven (before mixing) cannot exceed the desired production temperature of a mix by more than 28°C.

• The final result is the arithmetic average of the two samples at each test temperature.

image80

FIGURE 8.3 The wire basket for draindown testing according to AASHTO T 305-97. (Photo courtesy of Karol Kowalski and Adam Rudy, Purdue University.)

because the basket used here has small perforated holes. Moreover, these holes may be blocked during the testing of mixes containing larger quantities of mastic and fiber stabilizers. This is the reason why that method has limited application for SMA draindown testing.

Schellenberg’s method according to EN 12697-18 (Part 2) has been applied in draindown testing of porous asphalt containing fibers and other asphalt mixes like SMA. The essential information on that method is shown in Table 8.3.