Category Stone Matrix Asphalt. Theory and Practice

Creep Tests

Encouraging results of SMA resistance to deformation are being confirmed both in laboratory tests and on trial sections of pavements in operation. Clearly, in the majority of cases an SMA mixture is actually better than asphalt concrete (AC). Conversely, not every test method confirms that SMA possesses the better charac­teristics. The outcome depends on the loading mode and conditions of testing. The SMA tests resulting in divergent outcomes include

• Uniaxial creep test with a constant load (also called static creep), unconfined

• Uniaxial creep test with a repeated mode of loading (also called dynamic creep or repeated load axial test [RLAT]), unconfined

The classic versions of both tests have been carried out on 100 mm diameter speci­mens with a 100 mm loading platen (the so-called variant 100/100).

Figure 12.1 shows the mode of loading a 100 mm diameter cylindrical specimen with a 100 mm diameter platen. The whole top face of the cylinder is being loaded in an unconfined conditions (i. e., with no side support). Bearing in mind Figure 2.3, it is obvious that the power of an SMA structure also depends on the strength of the side support (Said et al., 2000). There is no such support in an unconfined creep test and loading the sample’s entire cross-sectional area. That is why, when testing SMA with this test, the results may suggest that SMA is a worse mixture than an AC mixture which has an aggregate mix characterized by a different type of particle interlocking. The fundamental assumptions of creep testing with no side support have been criticized for a long time (e. g., in Ulmgren, 1996). In spite of this, a large number of test results based on unconfined creep testing may be found in many publications.

The same tests with a different sample loading system produce different com­parative results between AC and SMA. The following are two other creep tests that incorporate side support:

• Uniaxial creep test with a repeated mode of load with side support (also called indentation repeated load axial test [IRLAT])—variant 100/150

• Uniaxial creep test with a repeated mode of load with vacuum confinement (also called vacuum repeated load axial test [VRLAT]; see also triaxial test).
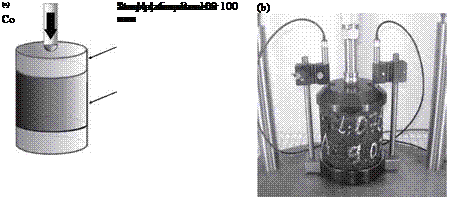
image145

If a 100 mm diameter cylindrical specimen is replaced by a larger one (i. e., with one that has a 150 mm diameter [Figure 12.2]) and the loading plate has a diameter of 100 mm, then the loaded area of the specimen will be laterally supported. The
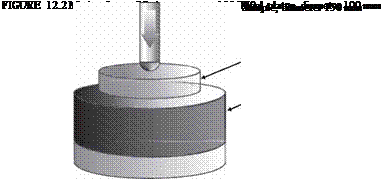
image147

FIGURE 12.1 Creep test with no side support, variant 100/100: (a) test scheme and (b) test­ing in Nottingham Asphalt Tester. (Photo courtesy of Krzysztof BlaZejowski.)

loading scheme (variant 100/150) and test results are, in this instance, closer to the real performance of a pavement on a road. In many countries, a modified creep test with a repeated mode of load (IRLAT or VRLAT) has been adopted for an assess­ment of the resistance to deformation of mixtures. Consequently, proper correlations between results of creep tests and wheel-tracking tests have been developed (Said et al., 2000; Ulmgren, 1996).

It is worth knowing that there is a substantial difference between the results of static creep tests of cylindrical specimens compacted in a laboratory for design pur­poses and specimens cut out of a finished course. Despite having the same composi­tion and similar densities, specimens cut out of a course are characterized by lower values of the creep modulus than Marshall and gyratory compacted specimens pre­pared in a laboratory (Renken, 2000).

According to the standard EN 13108-20, static and dynamic creep tests do not apply to SMA. The cyclical compression test (100/150—IRLAT) has been described in EN 12697-25 as method A, with test parameters as follows:

• Square loading pulse

• Frequency of 0.5 Hz (load 1 sec, rest period 1 sec)

• Load of 100 ± 2 kPa

• Typical test temperature of 40°C

• Total test duration of 3600 cycles (2 hours)

The Impact of Mixture Parameters

Basically, the type of aggregate mix, the type and content of binder, and the amount of air voids (Va), voids in mineral aggregate (VMA), voids filled with binder (VFB) are taken into account when analyzing the resistance to deformation of an asphalt mixture course. The development of rutting is a fairly complex process depending on, among other things, the relationships among the three aforementioned factors. Hence the resistance to deformation depends on the shear strength of an asphalt mix (Kandhal et al., 1998), which is the result of binder and aggregate (aggregate blend) interactions.

With mixtures like SMA, it would seem to be a justified statement that with such a strong aggregate structure, the role of the binder should be substantially reduced. However, practice has proved that functionally better binders like polymer modified binder (PMB) or multigrade binders are being used in more and more countries. They provide for better cohesion at high service temperatures and also improve pavement characteristics (e. g., crack resistance) at low temperatures.

Resistance to deformation has been tested for many years. Many assessment meth­ods have been developed, from the simplest and the oldest ones like an assessment based on Marshall stability, through the so-called Marshall quotient (the ratio of stability to flow), to sophisticated up-to-date test methods including triaxial dynamic compression and shear machines.

Next, the following test methods will be discussed:

• Creep tests with constant and repeated loads

• Triaxial dynamic compression test

• Wheel-tracking test

• Asphalt Pavement Analyzer (APA)

RUTTING RESISTANCE

Resistance to permanent deformation is the best known and most recognizable fea­ture of courses made from SMA mixtures. This resistance has its origins in the very strong skeleton of coarse particles of an aggregate mix. This issue was already thor­oughly deliberated in Chapters 2, 3, and 6, therefore only some additional informa­tion about testing that feature is provided below.

TABLE 12.1

A Comparison of Essential Functional Properties of Some Popular Asphalt Mixtures for Wearing courses

preferred

Functional

Required Fundamental mix

Typical values of various surfacing Types 0/13 mm size

properties

properties

oca

UTFC

SMA

cca

High skid

High surface

2-3 mm

1.5-3 mm

1-2 mm

0.2-0.5

resistance

texture

High

18-25%

12-20%

0%

mm

0%

interconnected internal voids High aggregate

Aggregate

Aggregate

Aggregate

Aggregate

polishing

dependent

dependent

dependent

dependent

Low tire-road

resistance Negative texture

Yes

Yes

Partially

No

noise

Low spray

Macrotexture

2-3 mm

1.5-3 mm

1-2 mm

0.2-0.5

generation Low construction

Low layer

30-40 mm

18-20 mm

30-40 mm

mm

30-40 mm

and

maintenance

thickness High durability

Medium-

Medium-

High

High

cost and construction delays and

(low maintenance cost)

Long functional

high

8-12 years

high

8-12 years

10-12

Lowa

vehicle damage

life

Early trafficking

Yes

Yes

years

Yes

Yes

Low windscreen

Low

Low

None

None

breakages

Source: From Pretorius F. J., Wise J. C., and Henderson M., Proceedings of the 8th Conference on Asphalt Pavements for Southern Africa (CAPSA’04), 12-16 September 2004.

Note: CGA = Continuous graded asphalt; OGA = open graded asphalt; SMA = stone matrix asphalt;

UTFC = ultra-thin friction courses.

a Functional life is low or non-existing relative to spray reduction and wet weather friction.

Characteristics of the SMA Course

Constituent materials, design, production, and placement of a stone matrix asphalt (SMA) mixture were discussed in previous chapters. It would not make sense to spend this much time discussing the mix if SMA courses had not been characterized with many strong points. Conversely, it should be openly admitted that it is not a perfect mixture, and it also has a couple of run-of-the-mill or slightly poorer proper­ties among some very remarkable and even outstanding ones. In any case, its lack of perfection does not affect the final appraisal of SMA as a very useful material for pavements. After all, the rapid increase in SMA applications all over the world has not been exclusively brought about by fashion.

Next, the following operation and maintenance properties of SMA courses will be elaborated on

• Resistance to permanent deformation

• Crack resistance

• Fatigue limit

• Antinoise properties

• Antispray and antiglare properties

• Antiskid properties

• Durability

• Permeability

• Impact on fuel consumption while driving

• Economic effectiveness

This discussion will begin with a short comparison of SMA and other competi­tive mixtures that are used for wearing courses. Table 12.1 shows a comparison of selected properties of SMA, open graded asphalt, ultra-thin friction courses, and continuous graded asphalt mixtures (Pretorius et al., 2004). One can see from this table that SMA mixtures generally compare very favorably with the other types of mixtures but that SMA may not be the best choice for all applications.

OVERDOSAGE OF AN ANTISTRIP ADDITIVE

It happens occasionally that an additive dosing system does not work correctly. When that happens, there is either too much or too little antistrip additive in the mixture. Its deficiency does not directly affect the quality of the mixture during production or placement. Effects may appear in the form of a lower durability of the course under traffic. However, an excess of the antistrip additive can manifest itself in an imme­diate and direct impact on the quality of the mixture. Usually the antistrip additive overdosage may be identified while still in the batching plant because of the charac­teristic (i. e., unpleasant) smell of the mixture.* The overdosed mixture distinguishes itself by having a very high workability both in the paver and under rollers, to such an extent that its further compaction is possible for up to a couple of days after place­ment (i. e., it is still deformable under rollers). Putting such a pavement into operation results in its rapid rutting. Another effect of increased workability of the mixture while rolling is the risk of fat spots or areas with a closed structure.

Depends on the type of adhesive agent used (mainly concerns some fatty amines).

Sma susceptibility to polishing

Although susceptibility to polishing is not a problem at the construction stage but a result of an earlier decision, greater pavement slipperiness becomes apparent after some time of pavement operation. The source of this problem is at the design stage of an SMA composition. The proper selection of an aggregates for a mixture and the level of designed air voids content are crucial.

image143

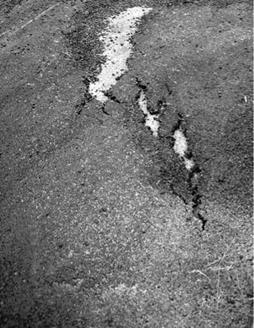
FIGuRE 11.34 Mastic squeezed-out of SMA in wheel paths during trafficking of pave­ment. (Photo courtesy of Krzysztof Blazejowski.)

image144

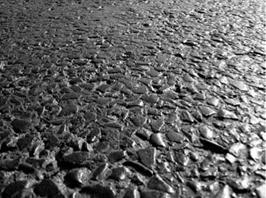
FIGURE 11.35 Polished SMA surface after 3 years of operation. (Photo courtesy of Krzysztof Blazejowski.)

We may define the expected scope of an aggregate’s polishing resistance for wearing courses through the selection of the polished stone value (PSV) category. PSV checking consists of testing the microtexture loss of aggregate grains under standardized conditions according to EN 1097-8. Figure 11.35 shows the effect of polishing a pavement after 3 years of traffic. This pavement, except for polished grains, shows no other damage.

SQUEEZED-OUT MASTIC IN WHEEL PATHS

Fat spots in wheel paths appear at the time of SMA pavement trafficking. They are located in the paths of vehicle wheels and can run up to several hundred meters (pos­sibly including the whole SMA wearing course of a road) (Figure 11.34).

We have to go back to the chapter on designing an SMA mixture and the volume relations taking place in it to explain causes of the appearance of such “sweating offs” of mastic in the wheel paths. Recall that some air voids for mastic are inten­tionally left in a compacted and interlocked coarse aggregate skeleton. Additional compaction of a course under tires causes a closer arrangement of the coarse aggre­gate grains during trafficking. This reduces the volume of free space designed for mastic, and consequently the mastic is squeezed-out onto the surface. In some cases, this phenomenon confirms the Dutch idea about the enlarging effect and the need to design SMA with a bit higher void content (see Chapter 7).

Another reason for the occurrence of such a phenomenon is opening the pavement to traffic too early. Loads on an SMA that is still warm can destroy this mixture in a short time.

Unevenness or irregularities

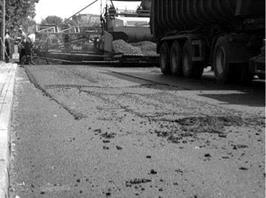
The last problem encountered when spreading SMA (and other asphalt mixtures, too) is unevenness caused by the approach of a paver on mixture residue left over on a bottom layer. Figure 11.33. shows how such residue builds up.

Different type of scrapers, sweepers, and other similar inventions fixed to the paver cannot fully protect it from causing unevenness. The care of cleanliness of the bottom layer is the responsibility of the paving crew. It consists not only in the skillful handling of a shovel but the proper coordination of mixture delivery from the dump truck into the paver hopper.

The material that is dumped in front of the paver also can cool before compac­tion, causing an internal porous area that can later trap water and then disintegrate the SMA layer.

11.8.2.5 Summary

Although thermal problems appear on almost every construction site and apply to any type of mixture, they seem to be underestimated. Examples of pavement damage presented in the previous pages, which developed during the construc­tion stages, should make us aware of their power to reduce a new pavement’s durability.

The use of infrared cameras has its strengths because it enables the spotting of potentially weak areas during construction when corrective measures can still be

image142

FIGURE 11.33 Remains of mixture left on a bottom layer resulting in unevenness of the finished course. (Photo courtesy of Krzysztof BlaZejowski.)

taken. Finally, it is worth finding the causes of damaged pavements that have pot­holes, bumps, and cracks appearing in the most unexpected places. Maybe it is time to view thermal differences as a potential cause of these defects.

Cracking of SMA Course When Rolling

Cracking of the mixture under rollers may be observed when there is no bond between an SMA course and the layer under it or when the temperature of the SMA mixture is too high. The temperature of the mixture during compaction is easy to control, therefore it will not be a topic of this section.

Figure 11.32 shows an old cement concrete pavement without a tack coat covered with a new SMA overlay. This resulted in a “dry slide” and the tearing of the SMA.

image141

FIGuRE 11.32 An example of the tearing of an SMA mat due to the lack of a tack coat on the cement concrete bottom layer. (Photo courtesy of Krzysztof BlaZejowski.)

A similar accident might happen while paving SMA on an old asphalt course with a very polished surface. By contrast, a course with too much tack coat may lead to a “wet slide” on a layer, also resulting in the tearing of the mat.

The conclusion to be drawn from these examples are self-evident—SMA paving should be preceded with proper tack coat. The amount of tack coat should be care­fully selected, taking into consideration the state of the underlying layer. Examples are shown in Chapter 10.

Transverse porosity

Transverse (or lateral) porosity can often be seen on pavements made during unfa­vorable weather conditions (in autumn or in winter) or when the mixture has been

image134

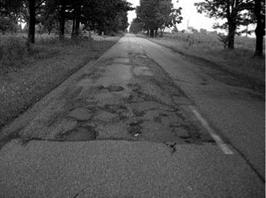
FIGuRE 11.25 Beginning of a work site—effect shown years later, a consequence of spreading too cool a mixture at the beginning of the work site. (Photo courtesy of Krzysztof BlaZejowski.)

image135215

Подпись: <68

image136

153

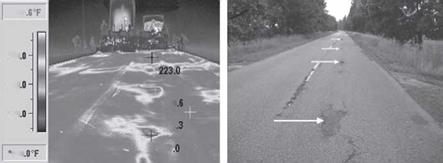
FIGURE 11.28 Local porosities: (a) an infrared image; (b) the effects after a couple of years on another road that has the same problem, arrows point at spots of pavement pot holes occurring at cyclic distances. (Photos [a] courtesy of Kim A. Willoughby, WSDOT, United States; [b] courtesy of Krzysztof Blazejowski.)
transported from far away. It has the distinctive appearance of transverse strips with increased porosity (Figure 11.29).

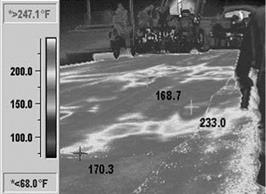
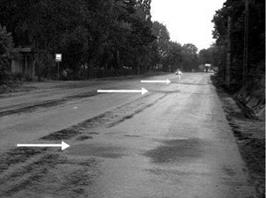
The most common cause of this is the buildup of cool mixture at the wings of the paver hopper. The distance between the strips of porosity in Figures 11.30 and 11.31 more or less reflects the distances between the loading places of fresh mixture into the paver from end dump trucks. This develops when the paver crew lifts the

image138

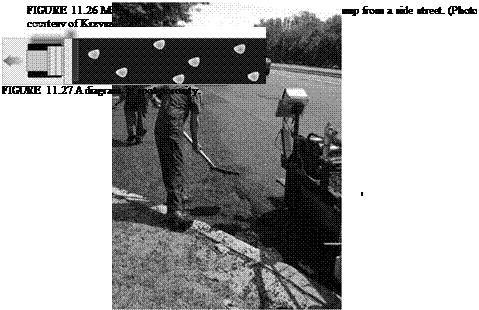
FIGURE 11.29 A diagram of transverse porosity.

image139

FIGURE 11.30 Infrared images showing porosity in the form of transverse, cyclic strips, tem­perature in degrees Fahrenheit. (Photo courtesy of Kim A. Willoughby, WSDOT, United States.)

image140

FIGURE 11.31 An example of cyclic strips of transverse porosity on a new SMA course. (Photo courtesy of Krzysztof BlaZejowski.)

hopper’s wings to use all of the previously delivered material before accepting a new delivery. Since the older mixture is significantly lower in temperature, after it passes through the paver this cool mixture appears as a transverse streak of porous (cold) material behind the screed.

Various preventive methods may be used to avoid this porosity, including the following:

• Paver staff should regularly remove the mixture residue on hopper wings or leave that mixture in the hopper wings until the end of the day, when it can be removed and disposed of.

• Complete unloading should not be allowed; the fresh, hot mixture should be unloaded from the truck to the hopper while some of the previous delivery of mixture is left in the hopper.