Time Domain Reflectometry Techniques
Time Domain Reflectometry (TDR) is a non-destructive electromagnetic technology that utilises the relationship between the relative permittivity (usually known as the dielectric constant, кг) of porous materials and their water content. Dry soils have values of dielectric constant of around 2-6 but water about 79-82 depending on wave frequency and water temperature. As the water content of the soil increases the dielectric constant also increases and is therefore an indirect indicator of the soil water content (Topp et al., 1980; Topp & Davis 1985; Svensson, 1997; Hillel, 1998; O’Connor & Dowding, 1999).
Time Domain Reflectometry is nowadays the most common technique for monitoring water content in pavement structures and subgrades. Topp et al. (1980) used TDR to measure permittivity of a wide range of agricultural soils and developed an empirical relationship between the permittivity and the volumetric water content which made it possible to use TDR in monitoring the water content of a given soil. A schema of a TDR probe is shown in Fig. 3.2 (Ekblad, 2004). Usually the probes have 2 or 3 rods of length, L (normally approximately 300 mm in length). They act as a wave guide while a transmitter inside the probe generates a pulse of frequencies up to 1 GHz which propagates along the metal conductors of the sensors. An electromagnetic field is therefore established around the probe. The pulse is reflected back to the source at the end of the conductors. The transit time of the pulse is therefore estimated according to
where ce is the velocity of the electromagnetic pulse, L is the probe length and t is the transit time.
The determination of the dielectric constant is thereafter achieved from the basic equation
![]() c0
c0
ce = Г ——–
Kr ■ —r
 |
 |
in which c0 is velocity of light, кг is the dielectric constant and – r is the relative magnetic permeability. Most soils are practically nonmagnetic, thus their relative magnetic permeability is close to unity. Roth et al. (1992) investigated ferric soils
and could not find any influence of magnetic properties on the volumetric water content. By inserting ce from Eq. 3.2 and rearranging, the dielectric constant can be estimated as
where the relative magnetic permeability has been set to unity.
TDR moisture probes express their readings as a volumetric water content в, defined as in Eq. 2.9 which can be related to gravimetric water content, w, as in Eq. 2.11. The volumetric water content is obtained via a relationship with the relative dielectric constant which is based on an empirical approach. A number of relationships exists which, frequently, have been derived using regressions analyses. Topp et al. (1980) gave the relationship as:
в = -5.3 x 10⁻² + 2.92 x 10⁻²Kr – 5.5 x 10-Vr2 + 4.3 x 10⁻⁴Kr3 (3.5)
Their analysis was based on a variety of soil types although many were low density agricultural soils. Jiang and Tayabji (1999) derived a similar third-order polynomial relationship for coarse grained soils as:
в = -5.7875 x 10⁻² + 3.41763 x 10⁻²Kr -1.3117 x 10⁻³к2 + 2.31 x 10⁻⁵к3 (3.6)
Thus, by combining either Eq. 3.5 or Eq. 3.6 with Eq. 3.4, it is possible to relate volumetric water content to transit time.
 |
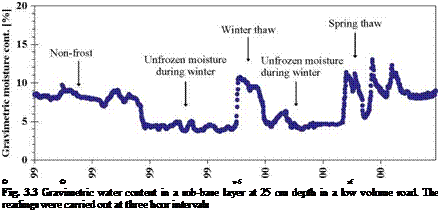
It is not uncommon that TDR sensors can measure transit time with a resolution of 10 picoseconds, which corresponds to a water content of approximately 0.1% by volume. Figure 3.3 shows readings from a TDR probe over a seven month period,
starting in the autumn of 1999, at a depth of z = 25 cm in a sub-base layer in SW Iceland (Erlingsson et al., 2000; 2002). Gravimetric water content is plotted after Eq. 2.11 has been applied to the TDR readings. In the period October to late November the actual water content decreased at a slow rate, with irregularities due to rainfalls. The freezing period started in late November which can be seen as a rapid drop in the water content. As the soil was frozen the TDR registration represents the unfrozen water content but not the actual water content in the layer. A two week long thawing period can be seen in January 2000. The spring thaw period started in early March and influenced the water content in the sub-base for more than a month.


Leave a reply