Permeability of Intact Asphaltic Mixtures
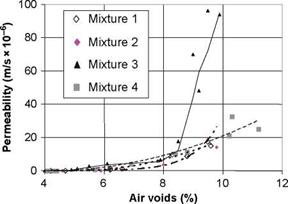
The permeability of asphaltic mixtures is controlled by the size and interconnection of the void space. To illustrate this, some recent data is given in Fig. 5.1. This presents results for various hot-mix asphaltic specimens as described in Table 5.1. Figure 5.1 shows that permeability values of intact asphaltic materials are typically in the 0 to 40 x 10-6 m/s range. It is apparent that permeability is insignificant at less than approximately 7% air voids but can then rapidly increase. Probably this is because interconnection of voids becomes possible at these high air void ratios and because mixtures that exhibit such air void proportions may be inadequately prepared leaving permeable fissures in the material’s structure. Other authors (Zube, 1962; Brown et al., 1989 and Santucci et al., 1985) conclude that a limit of 8% air voids should be adopted to avoid rapid oxidation and subsequent cracking and/or ravelling and to keep permeability low.
![Permeability of Intact Asphaltic Mixtures Подпись: Fig. 5.1 Laboratory determination of permeability of laboratory moulded cylinders of asphaltic mixtures (see Table 5.1 [Vivar & Haddock, 2007]). Reproduced with permission of J. Haddock](/img/1312/image138_2.gif) |
 |
Furthermore, higher permeability values are associated with asphaltic mixtures having larger voids. Larger voids are found both in fine-grained mixtures having high in-situ air void contents or in coarser grained mixtures at lower void contents. For example, Table 5.2 summarises the air void content at which a threshold between essentially non-permeable and permeable behaviour was observed in-situ,
|
Table 5.1 Summary of hot-mix asphaltic specimens for which results are plotted in Fig. 5.1 (after Vivar & Haddock, 2007)
NMAS = nominal maximum aggregate size. |
|
Table 5.2 Relationship between grading, air voids and permeability (after Cooley et al., 2001)
|
together with the permeability coefficient at that point (Cooley et al., 2001). The laboratory derived data of Fig. 5.1 tells a similar story although with a threshold void content of 8-9% for a permeability of 10 x 10-6 m/s. Both data sets reveal that the coarse, low-fines mixtures are least well-performing. In Fig. 5.1, Mixture 3, the poor performance is seen in the rapid increase in post-threshold permeability, while in Table 5.2 the threshold air-void content at which permeability increases is much lower.


Leave a reply