In-Situ Infiltration Measurement
Because cracks play such an important part in allowing water to enter a pavement through the surfacing, laboratory assessments of the permeability of intact asphaltic mixtures are not overly useful. Therefore, a range of techniques have been developed to assess permeability by infiltrating water into the pavement surface from a device which acts over a limited area of the surface (e. g. Ridgeway, 1976; Cooley, 1999; Fwa et al., 2001; Taylor, 2004; Mallick & Daniel, 2006). Used randomly on the surface, the infiltration observed will be likely to relate to the mean value – being a combination of water entering through intact material and via degradation cracks induced by compaction, by the environment or by traffic. Alternatively, the devices may also be used over specific cracks or joints to assess the water that can enter through that crack or joint (e. g. Mallick & Daniel, 2006). Essentially, two approaches have been adopted – to keep the surface of a specific piece of pavement wet and monitor what water supply rate is required to do this, or to provide a falling head arrangement and note the rate of head drop.
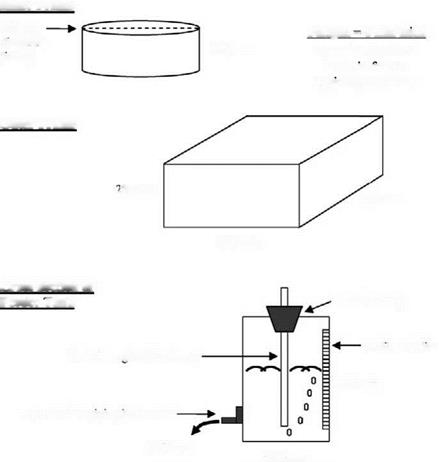
Some of the earliest work on infiltration, in this case through specific joints, involved the fixing of a bottomless wooden box, sealed with clay around its edges, onto an area of pavement containing a measured length of crack crossing the box. Sufficient water is added to the box to maintain a thin layer over the enclosed pavement, the rate at which water is added to maintain this condition can be monitored and the quantity of water infiltrating the pavement structure per unit length of crack calculated. The mean infiltration rate generated by Ridgeway (1976) using this approach was approximately 100 cm3/h/cm of crack. Site crack lengths and infiltration rates are given in Table 5.3.
An overall infiltration rate for a large area of pavement can be deduced from that measured as infiltrating through particular cracks. To achieve this, Baldwin, et al. (1997) suggested that maintenance intervention occurs when 10% of the surface is cracked which, they said, was equivalent to 0.002 cm of crack/cm2 of pavement surface This represents a worst-case value for infiltration through cracks if
|
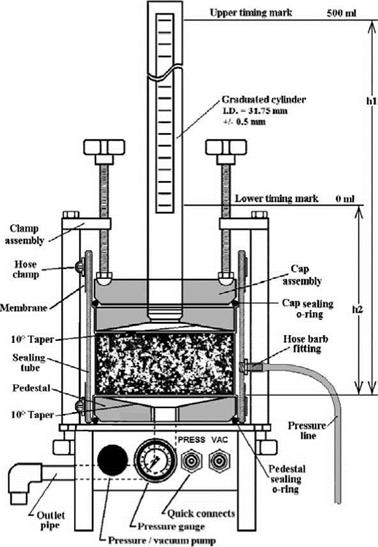
Fig. 5.2 Laboratory permeameter for cores of asphaltic mixtures (FDOT, 2006). Reproduced courtesy of the Florida Department of Transportation |
they exist in the same magnitude across the whole of a pavement’s surface. Thus the infiltration over such a well cracked pavement would be given by:
IRmax = 0.02 X ic (5.1)
where IRmax is the maximum anticipated infiltration in units of litres/hour/m2 of pavement area and ic is the infiltration measured through one crack in units of
|
Site |
Crack length (cm) |
Infiltration rate(cm3/h/cm of crack) |
|
|
Summer 1974 |
Autumn 1974 |
||
|
1 |
160 |
9 |
28 |
|
2 |
107 |
620 |
230 |
|
3 |
183 |
100 |
56 |
|
4 |
241 |
56 |
37 |
|
5 |
152 |
2 |
2 |
|
6 |
208 |
37 |
– |
|
7 |
147 |
19 |
84 |
|
Table 5.3 Site crack lengths and infiltration rate generated by Ridgeway (1976) |
|
Approx. mean infiltration rate = 100 (cm3/h/cm of crack). |

Tap to which piping is attached
Outflow
Fig. 5.3 Infiltrometer used by Taylor (2004). Reproduced with permission of J. Taylor
|
Table 5.4 Infiltrometer results obtained by Taylor (2004)
n/a = not applicable. * Types of classification taken from SHRP1 (1993). |
cm3/hour/cm of crack. It seems likely that direct use of this equation will overestimate a pavement’s potential to accept water. This is because water flowing through one crack may spread laterally below the surface whereas water flowing through one of many adjacent cracks at the same time will be constrained by water flowing through its neighbouring cracks.
To overcome this potential over-reading, a double ring infiltrometer can be used (e. g. Fig. 5.3). The level of water in both a central area and an annular ring are maintained at the same level but only ingress from the central area is monitored as this should flow only vertically through the pavement because of the ‘confinement’ offered by the ingress from the outer ring. Data obtained in this way by Taylor (2004) is shown in Table 5.4. Eq. 5.1 has been used to bring the data in the last column to the same units as for the data recorded directly in the penultimate column.
The mean infiltration ability of the pavements studied by Taylor (2004) and of the cracks studied by Ridgeway (1976) are similar if Eq. 5.1 is accepted -3.33 and 2 l/h/m2 respectively, giving confidence of their representativeness.
Another approach, as adopted at the US National Center for Asphalt Technology (NCAT) (Cooley, 1999) employs a device comprising a series of cylindrical standpipes of reducing cross section stacked on top of each other as a form of a
1 Strategic Highway Research Program (US)
|
Table 5.5 Summary of infiltrometer data reported by Cooley (1999) Calculated permeability, Laboratory measured
St Dev = Standard Deviation. |
falling head permeameter. The lowest cylinder is sealed to the pavement surface using a metal plate over a rubber disc. When the pavement is most permeable only the lowest standpipe is used while when it is least permeable the tallest, narrowest permeameter is employed. Unlike the devices described above, relatively impermeable pavements will, therefore, be subjected to unrealistically high surface water pressures. Whereas even a heavy rainstorm will only impose a few millimetres of water on the surface, the NCAT device can deliver as much as 0.5 m of head. With this device permeability values were obtained as shown in Table 5.5. The comparative laboratory data in the Table were obtained from cores taken from the same pavements and tested using a permeameter as described in Section 5.4.1. The much larger permeability values than given in Table 5.2 is evident, illustrating the important, but often overlooked, need to achieve adequate in-situ densities.
For such falling head tests, the coefficient of permeability, K (in m/s), may be estimated using Eq. 3.10. Other procedures for measuring the permeability of porous asphalt have been introduced by Fwa and his co-workers for both laboratory and in-situ evaluations (Tan et al., 1999; Fwa et al., 2002).


Leave a reply