Ground Penetrating Radar
In Ground Penetrating Radar (GPR), electromagnetic waves are sent out from a transmitter on or above the ground surface and picked up by a receiver after penetrating and returning from the soil. The velocity of the electromagnetic wave propagation in soils is dependent on the soil bulk permittivity modulus (Grote et al., 2003). Thus the underlying principles of the GPR soil moisture measurements are the same as those of Time Domain Reflectometry except that in TDR the electromagnetic waves travel along a waveguide whereas with GPR the propagated electromagnetic waves are unconstrained. GPR therefore has the potential to cover a much larger soil volume than does TDR. GPR can be air launched or surface launched or used in boreholes and is completely non-invasive, whereas TDR requires the penetration of rods (waveguides) into the pavement structure.
GPR is primarily used to estimate material thickness but can also detect cables, culverts, steel wire net, the water table and frost depth, but as mentioned it can also be used to measure the dielectric value and therefore water content.
The resolution and depth range of the electromagnetic wave depends on the frequency used and the properties of the medium. Low frequency antennas 100… 500 MHz have good penetration and depth range but lower resolution, whereas high frequency antennas 500… 1000 MHz have a lower depth range, but they give better resolution. With a 400MHz antenna the depth range is typically 3.5-5 m and the resolution 8-10 cm. With a 1000 MHz antenna the depth range is below 1 m, but the minimum resolution is 3-4 cm.
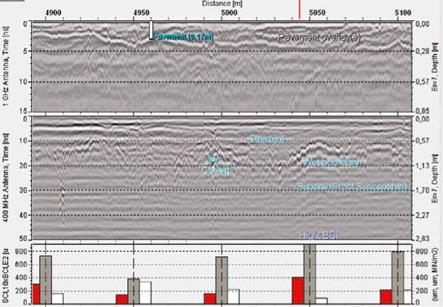
Figure 3.4 shows results from a GPR survey from Finland for a low-volume road structure. In the figure only the overlays can be clearly identified as the underlying layers are an old “unconstructed” local road. The figure allows comparison of GPR data with the results of a Falling Weight Deflectometer (FWD) assessment[5]. FWD testing can give an indication of weak subsoil in the form of a high BCI-index value as seen in Fig. 3.4 at station 5050 m (middle histogram). The figure also shows a high Surface Curvature Index (SCI) and a low stiffness (E2). At the same location, the 400 MHz ground radar image shows a strong reflection on the (wet?) boundary
|
Fig. 3.4 Ground penetrating radar images using a 1 GHz antenna (top) and 400 MHz antenna (middle) along with FWD parameters (SCI, 10xBCI, E2) (bottom) from a 200 m long section on a low volume road in Finland. SCI and BCI are the Surface and Base Curvature Indices, respectively, and E2 is the stiffness of the pavement structure. See text for explanation |
of the subsoil at a depth of 0.6-1 m. Elsewhere the boundary is not clear, which may then indicate mixing of subsoil and structure material by frost. The 1 GHz GPR image (top) shows that attempts to compensate for the weak road conditions have been made by adding new surface pavement layers, one after another, up to a thickness of 13-25 cm. Perhaps a better drainage system is the proper solution. The 400 MHz image also shows a culvert at 1m depth close to station 5000 m and that the very wet zone due to a frost susceptible layer continues between stations 5030 and 5100 m.
Radar images can give information on the appropriate depth and location for such a solution. The information is even more clear after the radar image is transferred onto a true longitudinal profile. What can be seen from ground radar images partly depends on the conditions (e. g. wet season and more clear wet boundaries; ground water level) or time of the year (e. g frost boundary or its absence at rock).


Leave a reply