Preparing Samples with the Use of a Gyratory Compactor
The use of a gyratory compactor is another popular method worldwide for preparing laboratory samples. This piece of equipment is not new; this method of compacting samples was developed in the late 1930s and early 1940s.[48] Making samples with the use of the gyratory compactor is described in EN 12697-31, ASTM D4013-09, and ASTM D3387-83(2003).
This method of compacting samples consists of kneading a mix with a rotational force. The crucial features of the gyratory compactor are
• Angle of rotation
• Vertical pressure
• Number of gyratory rotations
• Initial (Ninitial)
• Design (Ndesign)
• Maximum (Nmax)
The air void content after an initial number of rotations (usually 9 or 10) are a measurement of the compactability of a mix.
There are several types of such instruments, of a dozen or so makes, with more than 3000 examples of them in laboratories. The following are distinct types of these devices:
• Superpave Gyratory Compactor (SGC) is used in the United States for designing mixes using the Superpave method (AASHTO T312 standard) and for designing SMA. Settings according to AASHTO T312 are as follows:
• Internal angle of rotation: 1.16° ± 0.02°
• Vertical pressure: 600 ± 18 kPa
• Rotational speed: 30 ± 0.5 rev/min
• Diameter of sample: 150 mm
• Gyratory Testing Machine (GTM) is the press that was designed and built by the U. S. Army Corps of Engineers.
• Presse de Compactage a cissaillement Giratoire (PCG) is the press that was designed and built by the LCPC[49] in France; its parameters have been adapted to the guidelines of various methods, inter alia Superpave method.
In both the Marshall and gyratory methods of compaction, the important point is fixing suitable design parameters precisely. In the recent past, the number of rotations of a gyratory compactor have been established as a parameter corresponding with the number of strokes of the Marshall hammer (to determine density and air void content of a given mix). According to the results of research presented in Brown and Cooley (1999), the number of rotations (Ndesign= 70 or 100) used for an SMA design with an SGC are equivalent of the Marshall hammer compac – tive effort 2 x 50. The number of rotations chosen depends on the resistance to crushing (Los Angeles [LA] index) of the coarse aggregate used; 70 revolutions of an SGC should be assumed when the LA index amounts to 30-45% and 100 revolutions for the LA index less than 30%. In other documents, like NAPA SMA Guidelines QIS 122, the Ndesign = 75 and 100 rotations are used for SMA design with an SGC. The current AASHTO R46 standard corresponds with the NAPA publication (75 and 100 gyrations according to the LA index), values that are used in the United States.
The Australian guidelines NAS AAPA 2004 use a different compactive effort. During SMA design for low – to medium-traffic loading and for heavy – to very heavy-traffic loading, the preferred values are 80 and 120 rotations of the compactor, respectively.
8.1.1 Visual Assessment of Laboratory Samples
A clause in one of the Polish documents on SMA design (ZW-SMA-2001) reads as follows:
After preparing Marshall samples, an additional assessment can be done…. A visual assessment of samples should be carried out: coarse aggregates should be noticeable on the surface of the sample, while voids between them should only be partially filled with mastic…
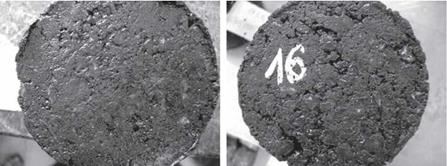
That sounds simple and clear, so let us have a look at a few examples of samples. Figure 8.1 shows an image of a proper SMA sample. There is no excess of mastic, coarse aggregates are visible, and the voids between them are “only partially filled with mastic.” This is how a properly designed and compacted SMA specimen should look.
Figure 8.2 depicts a remarkably different image of SMA samples, though maybe some readers can hardly believe it is still SMA. It really looks like mastic asphalt. There are few, if any, coarse aggregates standing out; voids only partially filled (with mastic) are not easy to find either. Generally, that SMA design could be immediately disqualified, but before rejecting the recipe of Figure 8.2, it is definitely worth giving more thought to the practical reasons of that unsuitable appearance. Mastic is squeezed out, which means there was too much of it in comparison with the free space in the aggregate mix or maybe there were too few air voids in the aggregate mix. Consequently a mistake at the stage of mastic design was made (in which case the mix should be designed once again) or SMA samples were improperly compacted (with too great a compaction effort). Maybe the aggregate was too weak and was subsequently crushed during compaction in the mold.
Visual assessment plays only a small role, because human senses may be deceived. After all, we can imagine an SMA sample with a low binder content but compacted with a mighty effort. At that time the sample may look fine—we are under the illusion that the mastic-binder content is sufficient. But in the field, a comparable com – pactive effort cannot be applied. As a result, the layer will turn out to be open and
|
(a) (b)
FIGURE 8.1 The appearance of a Marshall sample of an SMA mix after compaction and removal from the mold: (a) frontal plane and (b) lateral plane. (Photos courtesy of Alicja Glowacka.) |
|
FIGURE 8.2 The appearance of Marshall samples of an SMA mix after compaction and removal from the molds: (a) and (b) are frontal plane views of SMA samples with an excess of mastic. (Photos courtesy by Krzysztof Blazejowski.) |
porous. So, despite the good appearance of the lab sample, the mix will not perform successfully in the field. As they say, sometimes looks can be deceiving. On the other hand, the method of visual assessment is sometimes useful, as long as the selected parameters of sample preparation are correct.


Leave a reply