Random Variables and their Distributions
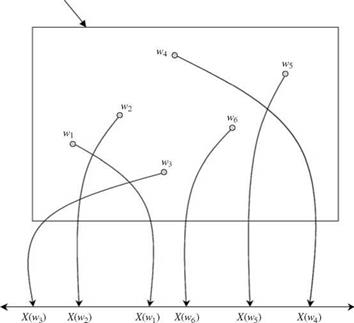
In analyzing the statistical features of infrastructural system responses, many events of interest can be defined by the related random variables. A random variable is a real-value function defined on the sample space. In other words, a random variable can be viewed as a mapping from the sample space to the real line, as shown in Fig. 2.4. The standard convention is to denote a random variable by an upper-case letter, whereas a lower-case letter is used to represent the realization of the corresponding random variable. For example, one may use Q to represent flow magnitude, a random variable, whereas q is used to represent the values that Q takes. A random variable can be discrete or continuous. Examples of discrete random variables encountered in hydrosystems infrastructural designs are the number of storm events occurring in a specified time period, the number of overtopping events per year for a levee system, and so on. On the other hand, examples of continuous random variables are flow rate, rainfall intensity, water-surface elevation, roughness factor, and pollution concentration, among others.
2.1.2 Cumulative distribution function
and probability density function
The cumulative distribution function (CDF), or simply distribution function (DF), of a random variable X is defined as
![]() Fx (x) = P (X < x)
Fx (x) = P (X < x)

|
The CDF Fx(x) is the nonexceedance probability, which is a nondecreasing function of the argument x, that is, Fx(a) < Fx(b), for a < b. As the argument x approaches the lower bounds of the random variable X, the value of Fx (x) approaches zero, that is, limx^-x Fx(x) = 0; on the other hand, the value of Fx(x) approaches unity as its argument approaches the upper bound of X, that is, limx^cx, Fx (x) = 1. With a < b, P (a < X < b) = Fx (b) – Fx (a).
For a discrete random variable X, the probability mass function (PMF), is defined as
Px (x) = P (X = x) (2.11)
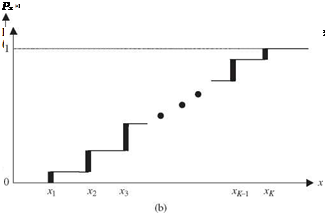
The PMF of any discrete random variable, according to axioms (1) and (2) in Sec. 2.1, must satisfy two conditions: (1) px(xk) > 0, for all xk’s, and (2) Sail kpx(xk) = 1. The PMF of a discrete random variable and its associated CDF are sketched schematically in Fig. 2.5. As can be seen, the CDF of a discrete random variable is a staircase function.
For a continuous random variable, the probability density function (PDF) fx( x) is defined as
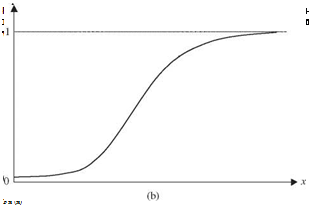
The PDF of a continuous random variable f x (x) is the slope of its corresponding CDF. Graphic representations of a PDF and a CDF are shown in Fig. 2.6. Similar to the discrete case, any PDF of a continuous random variable must satisfy two conditions: (1) fx(x) > 0 and (2) / fx(x) dx = 1. Given the PDF of a random variable X, its CDF can be obtained as
x
![]()
 |
fx(u) du
-TO
in which u is the dummy variable. It should be noted that fx ( ) is not a probability; it only has meaning when it is integrated between two points. The probability of a continuous random variable taking on a particular value is zero, whereas this may not be the case for discrete random variables.
 |
Example 2.6 The time to failure T of a pump in a water distribution system is a continuous random variable having the PDF of
ft(t) = exp(-t/1250)/e for t > 0, в > 0
in which t is the elapsed time (in hours) before the pump fails, and в is the parameter of the distribution function. Determine the constant в and the probability that the operating life of the pump is longer than 200 h.
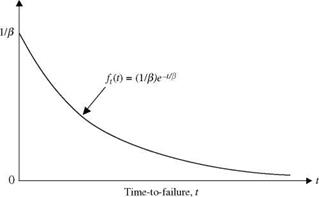
Solution The shape of the PDF is shown in Fig. 2.7. If the function ft (t) is to serve as a PDF, it has to satisfy two conditions: (1) ft(t) > 0, for all t, and (2) the area under ft (t) must equal unity. The compliance of the condition (1) can be proved easily. The value of the constant в can be determined through condition (2) as
 |
|
|
|
|
|
|
|
|
Therefore, the constant в = 1250 h/failure. This particular PDF is called the exponential distribution (see Sec. 2.6.3). To determine the probability that the operational life of the pump would exceed 200 h, one calculates P (T > 200):


Leave a reply