Methods for Computing Reliability of Complex Systems
Evaluation of the reliability of simple systems, as described in the preceding section, is generally straightforward. However, many practical hydrosystems engineering infrastructures, such as water distribution systems, have neither series nor parallel configuration. Evaluation of the reliability for such complex systems generally is difficult. For some systems, with their components arranged in a complex configuration, it is possible to combine components into groups in such a manner that it appears as in series or in parallel. For other systems, special techniques have to be developed that require a certain degree of insight and ingenuity from engineers. A great deal of work has been done on developing techniques for evaluating the reliability of complex systems. This section describes some of the potentially useful techniques for hydrosystems reliability evaluation.
7.4.1 State enumeration method
The state enumeration method lists all possible mutually exclusive states of the system components that define the state of the entire system. In general,
for a system containing M components, each of which can be classified into K operating states, there will be KM possible states for the entire system. For example, if the state of each of the M components is classified into failed and operating states, the system has 2M possible states.
Once all the possible system states are enumerated, the states that result in successful system operation are identified, and the probability of the occurrence of each successful state is computed. The last step is to sum all the successful state probabilities, which yields the system reliability. This method becomes less and less computationally attractive, as one can imagine, when the number of system components and/or the number of states for each component gets larger.
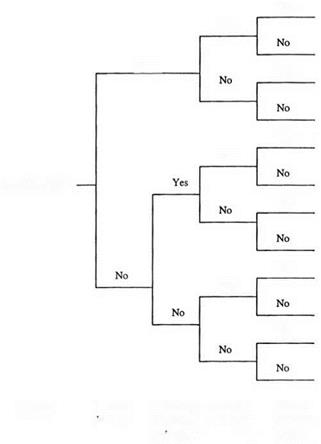
The tree diagram, such as that in Fig. 7.8, is called an event tree, and the analysis involving the construction of an event tree is referred to as event – tree analysis. As can be seen, an event tree simulates not only the topology of
Yes
Yes
Yes
Yes
Yes
Yes
Land flooded
Yes
Yes
Yes
Yes

|
||||
|
|
|||
|
|

![]() animal)
animal)
Figure 7.8 An example event tree for land flooding relating to levee performance.
a system but, more important, the sequential or chronologic operation of the system.
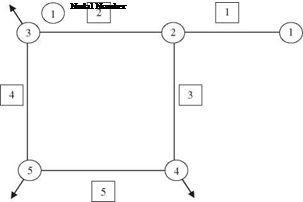
Example 7.12 Consider a simple water distribution network consisting of five pipes and one loop, as shown in Fig. 7.9. Node 1 is the source node, and nodes 3, 4, and 5 are demand nodes. The components of this network subject to possible failure are the five pipe sections. Within a given time period, each pipe section has an identical failure probability of 5 percent due to breakage or other causes that require it to be removed from service. The system reliability is defined as the probability that water can reach all three demand nodes from the source. Furthermore, it is assumed that the states of serviceability of each pipe are independent.
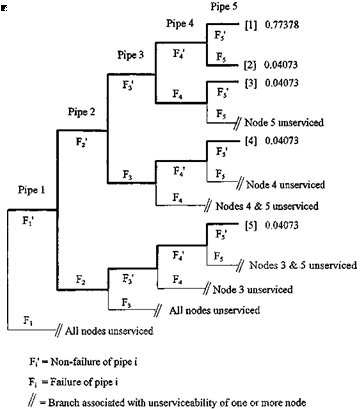
Solution Using the state enumeration method for system reliability evaluation, the associated event tree can be constructed to depict all possible combinations of component states in the system, as shown in Fig. 7.10. Since each pipe has two possible states, that is, failure F or nonfailure F’, the tree, if fully expanded, would have 25 = 32 branches. However, knowing the role that each pipe component plays in the network connectivity, exhaustive enumeration of all possible states is not necessary.
For example, referring to Fig. 7.10, one realizes that when pipe 1 fails, all demand nodes cannot receive water, indicating a system failure, regardless of the state of the remaining pipe sections. Therefore, branches in the event tree beyond this point do not have to be constructed. Applying some judgment in event-tree construction in this fashion generally can lead to a smaller tree. However, for a complex system, this may not be a trivial task.
 |
The system reliability can be obtained by summing up the probabilities associated with all of the nonfailure branches. In this example, there are five branches, as
1 Pipe Number
indicated by the heavy lines in the tree, for which all users can have the water delivered by the system. Therefore, the system reliability is
![]()
![]()

5
ps, sys = P ( и B[m] m=1
where P (B[m]) is the probability that the branch B[m] of the event tree provides full service to all users. The probability associated with each branch resulting in satisfactory delivery of water to all users can be calculated as the following:
P (B[1]) = P (F1) P (F2) P (F3) P (F4) P (F5)
= (0.95)(0.95)(0.95)(0.95)(0.95) = 0.77378 P (B[2]) = P (F1) P (F2) P (F3) P (F4) P (F5)
= (0.95)(0.95)(0.95)(0.95)(0.05) = 0.04073 P (B[3]) = P (F1) P (F2) P (F3) P (F4) P (F,5)
= (0.95X0.95X0.95X0.05X0.95) = 0.04073
P (B[4]) = P (F[) P (F2) P (F3) P (F4) P (F5)
= (0.95)(0.95)(0.05)(0.95)(0.95) = 0.04073 P (B[5]) = P (F1) P (F2) P (F<3) P (F4) P (F5)
= (0.95)(0.05)(0.95)(0.95)(0.95) = 0.04073
Therefore, the system reliability is the sum of the preceding five probabilities associated with the operating state of the system, which is
ps, sys = 0.77378 + 4(0.04073) = 0.93668


Leave a reply