Generating multivariate normal random variates
A random vector X = (X1, X2,…, XK)t has a multivariate normal distribution with a mean vector fj, x and covariance matrix Cx, denoted as X ~ N(px, Cx). The joint PDF of K normal random variables is given in Eq. (2.112). To generate high-dimensional multivariate normal random variates with specified (j, x
|
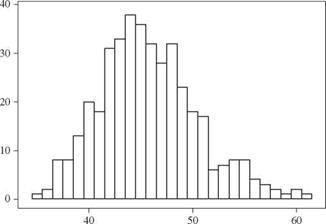
Drawdown recess time (days) Figure 6.4 Histogram of simulated drawdown recess time for Example 6.4. |
and Cx, the CDF-inverse algorithm described in Sec. 6.5.1 might not be efficient. In this section, two alternative algorithms for generating multivariate normal random variates are described. Both algorithms are based on orthogonal transformation using the covariance matrix Cx or correlation matrix Rx described in Sec. 2.7.1. The result of the transformation is a vector of independent normal variables, which can be generated easily by the algorithms described in Sec. 6.4.1.
Square-root method. The square-root algorithm decomposes the covariance matrix Cx or correlation matrix R x into
Rx = LLt Cx = L Lt
as shown in Appendix 4B, in which L and L are K x K lower triangular matrices associated with the correlation and covariance matrices, respectively. According to Eq. (4B.12), L = DЦ2L, with Dx being the K x K diagonal matrix of variances of the K involved random variables.
In addition to being symmetric, if Rx or Cx is a positive-definite matrix, the Cholesky decomposition (see Appendix 4B) is an efficient method for finding the unique lower triangular matrices L or L (Young and Gregory, 1973; Golub and Van Loan, 1989). Using the matrix L or L, the vector of multivariate normal random variables can be expressed as
X = fix + L Z = fix + D1/2 LZ (6.34)
in which Z’ is an K x 1 column vector of independent standard normal variables. It was shown easily in Appendix 4B that the expectation vector and the covariance matrix of the right-hand side in Eq. (6.34), E(px + L Z’), are equal
to fix and Cx, respectively. Based on Eq. (6.34), the square-root algorithm for
generating multivariate normal random variates can be outlined as follows:
1. Compute the lower triangular matrix associated with the correlation or covariance matrix by the Cholesky decomposition method.
2. Generate K independent standard normal random variates z’ = (z’x, z’2,…, z’K)t from N(0, 1).
3. Compute the corresponding normal random variates by Eq. (6.34).
4. Repeat steps 1 through 3 to generate the desired number of sets of normal random vectors.
Example 6.5 Refer to Example 6.4. Apply the square-root algorithm to estimate the statistical properties of the drawdown recess time, including its mean, standard deviation, and skewness coefficient. Compare the results with Example 6.4.
Solution By the square-root algorithm, the covariance matrix of permeability Kh and storage coefficient S,
![]() C (Kh, S)
C (Kh, S)
is decomposed into the multiplication of the two lower triangular matrices, by the Cholesky decomposition, as
0. ![]() 01 0′
01 0′
0.0025 0.00443
The Monte Carlo simulation can be carried out by the following steps:
1. Generate a pair of standard normal variates z1 and z2.
2. Compute the permeability Kh and storage coefficient S simultaneously as
 |
|
|
|
|
|
3. Use (kh, s) generated from step 2 in Eq. (6.29) to compute the corresponding drawdown recess time t.
4. Repeat steps 1 through 3 n = 400 times to obtain 400 realizations of drawdown recess times {ti, t2,…, t400}.
5. Compute the mean, standard deviation, and skewness coefficient of the drawdown recess time.
The results from carrying out the numerical simulation are
Mean fit = 45.94 days Standard deviation at = 4.69 days Skewness coefficient yt = 0.301
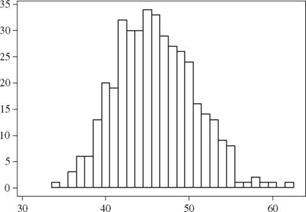
The histogram of400 simulated drawdown recess times is shown in Fig. 6.5. The mean and standard deviation are very close to those obtained in Example 6.4, whereas the
|
Drawdown recess time (days) Figure 6.5 Histogram of simulated drawdown recess time for Example 6.5. |
skewness coefficient is 62 percent of that found in Example 6.4. This indicates that 400 simulations are sufficient to estimate the mean and standard deviation accurately, but more simulations are needed to estimate the skewness coefficient accurately.
Spectral decomposition method. The basic idea of spectral decomposition is described in Appendix 4B. The method finds the eigenvalues and eigenvectors of the correlation or covariance matrix of the multivariate normal random variables. Through the spectral decomposition, the original vector of multivariate normal random variables X, then, is related to a vector of independent standard normal random variables Z’ ~ N(0,1) as
X = + D1/[10] [11] [12] У A1/2 Z’ = ^х + V Л1/2 Z’ (6.36)
in which V and Л are the eigenvector and diagonal eigenvalue matrices of Cx, respectively, whereas V and Л are the eigenvector and diagonal eigenvalue matrices of Rx, respectively. Equation (6.36) clearly reveals the necessary computations for generating multivariate normal random vectors. The spectral decomposition algorithm for generating multivariate normal random variates involves the following steps:
Many efficient algorithms have been developed to determine the eigenvalues and eigenvectors of a symmetric matrix. For the details of such techniques, readers are referred to Golub and Van Loan (1989) and Press et al. (1992).


Leave a reply