Extrapolation problems
Most often frequency analysis is applied for the purpose of estimating the magnitude of truly rare events, e. g., a 100-year flood, on the basis of short data series. Viessman et al. (1977, pp. 175-176) note that “as a general rule, frequency analysis should be avoided… in estimating frequencies of expected hydrologic events greater than twice the record length.” This general rule is followed rarely because of the regulatory need to estimate the 100-year flood; e. g., the U. S. Water Resources Council (1967) gave its blessing to frequency analyses using as few as 10 years of peak flow data. In order to estimate the 100-year flood on the basis of a short record, the analyst must rely on extrapolation, wherein a law valid inside a range of p is assumed to be valid outside of p. The dangers of extrapolation can be subtle because the results may look plausible in the light of the analyst’s expectations.
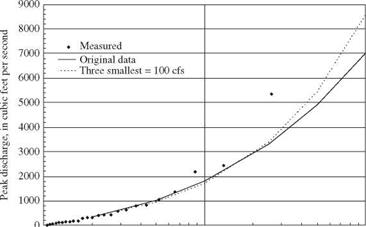
The problem with extrapolation in frequency analysis can be referred to as “the tail wagging the dog.” In this case, the “tail” is the annual floods of relatively high frequency (1- to 10-year events), and the “dog” is the estimation of extreme floods needed for design (e. g., the floods of 50-, 100-, or even higher-year return periods). When trying to force data to fit a mathematical distribution, equal weight is given to the low end and high end of the data series when trying to determine high-return-period events. Figure 3.6 shows that small changes in the three smallest annual peaks can lead to significant changes in the 100-year peak owing to “fitting properties” of the assumed flood frequency distribution. The analysis shown in Fig. 3.6 is similar to the one presented by Klemes (1986); in this case, a 26-year flood series for Gilmore Creek at Winona, Minnesota, was analyzed using the log-Pearson type 3 distribution employing the skewness coefficient estimated from the data. The three lowest values in the annual maximum series (22, 53, and 73 ft3/s) then were changed to values of 100 ft3/s (as if a crest-stage gauge existed at the site with a minimum flow value of 100 ft3/s), and the log-Pearson type 3 analysis was repeated. The relatively small absolute change in these three events changed the skewness coefficient from 0.039 to 0.648 and the 100-year flood from 7,030 to 8,530 ft3/s. As discussed by Klemes (1986), it is illogical that the 1- to 2-year frequency events should have such a strong effect on the rare events.
Under the worst case of hydrologic frequency analysis, the frequent events can be caused by a completely different process than the extreme events. This situation violates the initial premise of hydrologic frequency analysis, i. e., to find some statistical relation between the magnitude of an event and its likelihood of occurrence (probability) without regard for the physical process of flood formation. For example, in arid and semiarid regions of Arizona, frequent events (1- to 5-year events) are caused by convective storms of limited spatial extent, whereas the major floods (> 10-year events) are caused by frontal
|
1 10 100 Return period, in years Figure 3.6 Flood frequency analysis for Gilmore Creek at Winona, Minnesota, for 1940-1965 computed with the log-Pearson type 3 distribution fitted to (1) the original annual maximum series and (2) to the original annual maximum series with the three smallest annual peaks set to 100 ft3/s. |
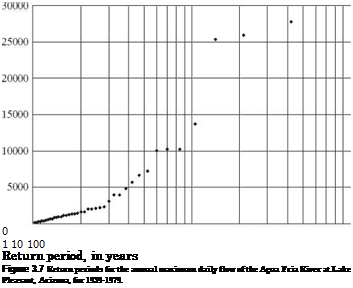
monsoon-type storms that distribute large amounts of rainfall over large areas for several days. Figure 3.7 shows the daily maximum discharge series for the Agua Fria River at Lake Pleasant, Arizona, for 1939-1979 and clearly indicates a difference in magnitude and mechanism between frequent and infrequent floods. In this case estimating the 100-year flood giving equal weight in the statistical calculations to the 100 ft3/s and the 26,000 ft3/s flows seems inappropriate, and an analyst should be prepared to use a large safety factor if standard frequency analysis methods were applied.
 |
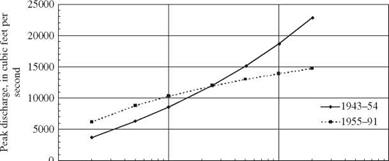
Another problem with “the tail wagging the dog” results when the watershed experiences substantial changes. For example, in 1954 the Vermilion River, Illinois, Outlet Drainage District initiated a major channelization project involving the Vermilion River, its North Fork, and North Fork tributaries. The project was completed in the summer of 1955 and resulted in changing the natural 35-ft-wide North Fork channel to a trapezoidal channel 100 ft in width and the natural 75-ft-wide Vermilion channel to a trapezoidal channel 166 ft in width. Each channel also was deepened 1 to 6 ft (U. S. Army Corps of Engineers, 1986). Discharges less than about 8,500 ft3/s at the outlet remain in the modified channel, whereas those greater than 8,500 ft3/s go overbank. At some higher discharge, the overbank hydraulics dominate the flow, just as they did before the channelization. Thus the more frequent flows are increased by the improved hydraulic efficiency of the channel, whereas the infrequent events are still subject to substantial attenuation by overbank flows. Thus the frequency curve is flattened relative to the pre-channelization condition, where the more frequent events are also subject to overbank attenuation. The pre – and postchannelization flood frequency curves cross in the 25- to 50-year return period
|
1 10 100 1000 Return period, in years Figure 3.8 Peak discharge frequency for the Vermilion River at Pontiac, Illinois, for pre-channelized (1943-1954) and post-channelized (1955-1991) conditions. |
range (Fig. 3.8), resulting in the illogical result that the pre-channelization condition results in a higher 100-year flood than the post-channelization condition. Similar results have been seen for flood flows obtained from continuous simulation applied to urbanizing watersheds (Bradley and Potter, 1991).


Leave a reply