THE COST OF CONGESTION
Congestion, when applied to traffic, refers to that condition which occurs when drivers experience a noticeable delay in completing a trip because of inability to maneuver through the traffic stream. This condition is characterized by slow travel speeds, increased travel times, increased accident frequencies, erratic stop-and-go driving, increased vehicle operating costs, and other undesirable circumstances leading to driver dissatisfaction (Ref. 4).
Congestion on urban freeways is of two types—recurring and nonrecurring. Congestion that occurs regularly at particular locations during certain time periods is said to be recurring. On the other hand, congestion that occurs as a result of irregular events, such as accidents, disabled vehicles, or other similar happenings, is said to be nonrecurring. Both can cause driver dissatisfaction, but drivers usually expect the recurring congestion and make adjustments in their travel plans to accommodate it. The most common example of recurring congestion is the morning and afternoon “rush hour” periods, when traffic demands can exceed the capacity of the freeway.
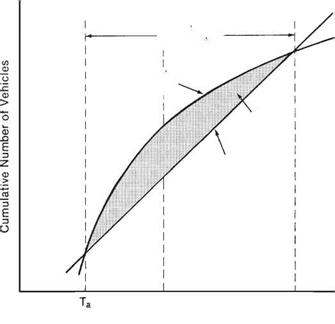
Figure 2.60 shows a graph illustrating what happens when demand exceeds capacity. The straight line represents the capacity of a section of freeway at a particular time (i. e., the number of vehicles getting past the point under prevailing roadway conditions). As long as traffic demand, or the number of vehicles arriving at that point (shown by the curved cumulative demand line), is less than or equal to the capacity of that section of the freeway, there is little congestion. However, once the arrival rate begins to exceed the capacity at time Ta, a bottleneck is formed and vehicles begin to accumulate upstream until time Tb, when the demand once again falls below the capacity. Congested conditions continue until time Tc, when the accumulated traffic at the bottleneck dissipates. The area between the capacity and demand curves during congested conditions is the delay resulting from the congestion (Ref. 4).
 Duration of
Congestion
Cumulative
Demand
Delay
Capacity
Ть Tc
Time
FIGURE 2.60 Illustration of relationships among demand, capacity, and congestion. (From Traffic Engineering Handbook, Institute of Transportation Engineers, 1992)
The cost of congestion is the sum of individual costs of items that represent an increase over normal operating costs directly attributable to the congestion. Among these items are fuel and oil consumption, tire wear caused by the frequency and severity of speed changes, other maintenance items affected by the speed changes, and increased idling times. There are other costs that may not be readily apparent to the individual driver but are real costs affecting the general public, such as inefficient movement of commercial vehicles and the increased level of pollutant emissions.
Where congestion on freeways is of the recurring kind, the usual solutions to try and solve the problem are geometric in nature. The most logical solution in many cases is lane addition. In urban areas, congestion frequently occurs downstream from entrance ramps when the combination of traffic entering the freeway and the traffic already present exceeds the capacity of that segment. In other cases, the existing horizontal alignment may contain one or more “sharp” curves, which result in lower capacity. Ramp designs may have a detrimental effect on freeway capacity if their merge or diverge areas are too short, or if they are too closely spaced, creating weaving problems for traffic entering and exiting the freeway traffic stream. Other problems involving physical features include unconventional interchanges, inadequate shoulders, narrow medians, poor surface quality, and poor signing.
The next article discusses a new approach to the problem that takes advantage of evolving technology: intelligent vehicle highway systems.


Leave a reply