Sight Distance
A primary feature in the design of any roadway is the availability of adequate sight distance for the driver to make decisions while driving. In the articles that follow, the text contains conclusions based on information contained in Ref. 1. Derivation of formulas and references to supporting research are contained in that document and will not be repeated here. The reader is encouraged to consult that document for more detailed background information. The following paragraphs discuss various sight distances and the role they play in the design of highways.
Stopping Sight Distance. Stopping sight distance is the distance ahead that a motorist should be able to see so that the vehicle can be brought safely to a stop short of an obstruction or foreign object on the road. This distance will include the driver’s reaction or perception distance and the distance traveled while the brakes are being applied. The total distance traveled varies with the initial speed, the brake reaction time, and the coefficient of friction for wet pavements and average tires. The values in Table 2.2 were developed using a reaction time of 2.5 s and a braking deceleration rate of 11.2 ft/s2 (3.4 m/s2). The height of eye was taken as 3.50 ft (1.07 m) and the height of the object as 2.00 ft (0.61 m).
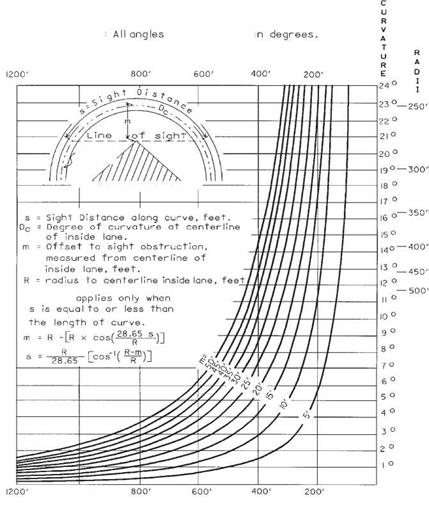
When considering the effect of stopping sight distance, it is necessary to check both the horizontal and the vertical stopping sight distance. Horizontal sight distance may be restricted on the inside of horizontal curves by objects such as bridge piers, buildings, concrete barriers, guiderail, cut slopes, etc. Figure 2.6 shows a diagram describing how horizontal sight distance is checked along an extended curve. Both formulas and a nomograph are provided to enable a solution. Many times, where the curve is not long enough or there are a series of roadway horizontal curves, a plotted-out “graphic” solution will be required to determine the available horizontal sight distance.
|
TABLE 2.2 Stopping Sight Distance (SSD) for Design Speeds from 20 to 70 mi/h (32 to 113 km/h)
Conversions: 1 mi/h = 1.609 km/h, 1 ft = 0.305 m. Source: Location and Design Manual, Vol. 1, Roadway Design, Ohio Department of Transportation, with permission. |
 SIGHT DISTANCE
FIGURE 2.6 Horizontal sight distance along curve. Conversion: 1 ft = 0.305 m. (From Location and Design Manual, Vol. 1, Roadway Design, Ohio Department of Transportation, with permission)
When a cut slope is the potential restriction, the offset should be measured to a point on the backslope having the same elevation as the average of the roadway where the driver is, and the location of the lane downstream where a potential hazardous object lies. In this way, an allowance of 2.75 ft (0.84 m) of vegetative growth on the backslope can be made, since the driver’s eye is assumed to be 3.5 ft (1.07 m) above the pavement and the top of a 2.0-ft (0.61-m) hazardous object downstream may still be seen.
Vertical sight distance may be restricted by the presence of vertical curves in the roadway profile. The sight distance on a crest vertical curve is based on a driver’s
ability to see a 2.0-ft-high (0.61-m) object in the roadway without being blocked by the pavement surface. The height of eye for the driver used in the calculations is 3.5 ft (1.07 m).
The sight distance on a sag vertical curve is dependent on the driver’s being able to see the pavement surface as illuminated by headlights at night. The height of the headlight is assumed to be 2.0 ft (0.61 m), and the height of the object is 0.0. The upward divergence angle of the headlight beam is assumed to be 1°.
Intersection Sight Distance. A motorist attempting to enter or cross a highway from a stopped condition should be able to observe traffic at a distance that will allow safe movement. In cases where traffic is intermittent or moderate in flow, the motorist will wait to find an acceptable “gap.” The driver approaching the intersection on the through road should have a clear view of the intersection including any vehicles stopped, waiting to cross, or turning. The methods described in the following paragraphs produce distances that provide sufficient sight distance for the stopped driver to make a safe crossing or turning maneuver. If these distances cannot be obtained, the minimum sight distance provided should not be less than the stopping sight distance for the through roadway. This would allow a driver on the through roadway adequate time to bring the vehicle to a stop if the waiting vehicle started to cross the intersection and suddenly stopped or stalled. If this distance cannot be provided, additional safety measures must be provided. These could include, but are not limited to, advance warning signals and flashers and/or reduced speed limit zones in the vicinity of the intersection.
There are three possible maneuvers for a motorist stopped at an intersection to make. The motorist can (1) cross the intersection by clearing oncoming traffic on both the left and right of the crossing vehicle, (2) turn left into the crossing roadway after first clearing the traffic on the left and then making a safe entry into the traffic stream from the right, or (3) turn right into the crossing roadway by making a safe entry into the traffic stream from the left.
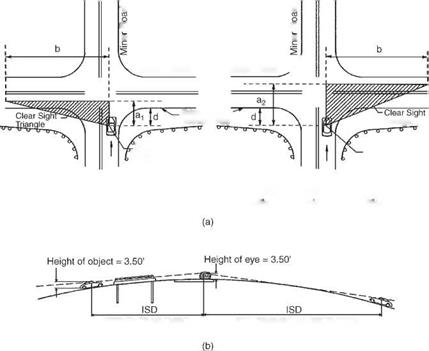
In order to evaluate the amount of sight distance available to a stopped vehicle waiting to make a crossing or turning maneuver, the American Association of State Highway and Transportation Officials (AASHTO) adopted the concept of using “sight triangles” (Ref. 1). The vertices of the triangles are (a) the waiting driver’s position, (b) the approaching driver’s position, and (c) the intersection of the paths of the two vehicles, assuming a straight-ahead path for the waiting vehicles. Figure 2.7 shows the concept of sight triangles, emphasizing both the horizontal and vertical elements to be considered. The shaded area in the triangles is to be free of objects that would obstruct the field of vision for either driver. The profile view shows the limiting effect of vertical curvature of the through roadway. Notice that the height of eye of the drivers (3.50 ft or 1.07 m) is used for both the waiting and approaching vehicles. This stresses the importance of both drivers being able to see each other.
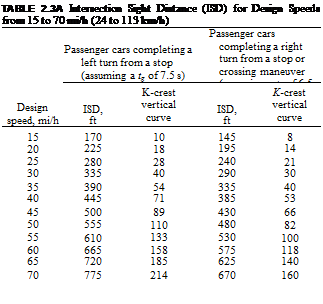
Table 2.3A provides intersection sight distance values for through vehicle speeds from 15 to 70 mi/h (24 to 113 km/h). The distances are based on a time gap of 7.5 s for a passenger vehicle turning left and a gap of 6.5 s for a crossing or right-turning vehicle. The height of eye and object were taken as 3.50 ft (1.07 m). The table also provides K values for crest vertical curves that would provide the required sight distance. (See Art. 2.2.4 for a discussion of vertical curvature.) Formulas are provided so that distances can be calculated for trucks requiring a longer time gap and for time adjustments due to upgrades or multiple lane crossings. See the notes in Table 2.3A, which explain how to adjust the timings.
Passing Sight Distance. In Table 2.3B, the “PSD” column lists the distances required for passing an overtaken vehicle at various design speeds. These distances are applicable

 |
 PORTION OF ABUTMENT
AS OBSTRUCTION
FIGURE 2.7 Intersection sight triangles. (a) Sight triangles. (b) Vertical components. a1 = the distance, along the minor road, from the decision point to 12 the lane width of the approaching vehicle on the major road. a2 = the distance, along the minor road, from the decision point to 112 the lane width of the approaching vehicle on the major road. b = intersection sight distance (ISD). d = the distance from the edge of the traveled way of the major road to the decision point; the distance should be a minimum of 14.4 ft (4.39 m) and 17.8 ft (5.43 m) preferred. (From Location and Design Manual, Vol. 1, Roadway Design, Ohio Department of Transportation, with permission) to two-lane roadways only. Among the assumptions that affect the required distance calculations are (1) the passing vehicle averages 10 mi/h (1.61 km/h) faster than the vehicle being passed, (2) the vehicle being passed travels at a constant speed and this speed is the average running speed (which is less than the design speed), and (3) the oncoming vehicle is traveling at the same speed as the passing vehicle. Table 2.3B contains K values for designing crest vertical curves to provide passing sight distance. These values assume that the height of the driver’s eye is 3.5 ft (1.07 m) for both the passing and the oncoming vehicle. The equations at the bottom of the table provide mathematical solutions for sight distance on the crest curves.
On two-lane roadways, it is important to provide adequate passing sight distance for as much of the project length as possible to compensate for missed opportunities due to oncoming traffic in the passing zone. On roadways where the design hourly traffic volume exceeds 400, the designer should investigate the effect of available passing sight distance on highway capacity using procedures outlined in the latest Transportation Research Board “Highway Capacity Manual” (Ref. 10). If the available passing sight distance restricts the capacity from meeting the design level of service requirement, then adjustments should be made to the profile to increase the distance.
 |
If ISD cannot be provided due to environmental or R/W constraints, then as a minimum, the SSD for vehicles on the major road should be provided.

 Using S = intersection sight distance L = length of crest vertical curve A = algebraic difference in grades (%), absolute value K = rate of vertical curvature
• For a given design speed and an A value, the calculated length L = K X A.
• To determine S with a given L and A, use the following:
For S < L: S = 52.92 VK, where K = L/A For S > L: S = 1400/A + L/2
Note: For design criteria pertaining to collectors and local roads with ADT less than 400, please refer to Ref. 15, Guidelines for Geometric Design of Very Low-Volume Local Roads (ADT < 400).
Time gaps
|
Time gap(s) at design Design vehicle speed of major road (tg), s
(Continued) |
TABLE 2.3A Intersection Sight Distance (ISD) for Design Speeds from 15 to 70 mi/h (24 to 113 km/h) (Continued)
A. Note: The ISD and time gaps shown in the above tables are for a stopped vehicle to turn left onto a two-lane highway with no median and grades of 3 percent or less. For other conditions, the time gap must be adjusted as follows:
• For multilane highways: For left turns onto two-way highways with more than two lanes, add 0.5 s for passenger cars or 0.7 s for trucks for each additional lane, from the left, in excess of one, to be crossed by the turning vehicle.
• For minor road approach grades: If the approach grade is an upgrade that exceeds 3 percent, add 0.2 s for each percent grade for left turns.
B. Note: The ISD and time gaps shown in the above tables are for a stopped vehicle to turn right onto a two-lane highway with no median and grades of 3 percent or less. For other conditions, the time gap must be adjusted as follows:
• For multilane highways: For crossing a major road with more than two lanes, add 0.5 s for passenger cars or 0.7 s for trucks for each additional lane to be crossed and for narrow medians that cannot store the design vehicle.
• For minor road approach grades: If the approach grade is an upgrade that exceeds 3 percent, add 0.1 s for each percent grade.
Conversions: 1 mi/h = 1.609 km/h, 1 ft = 0.305 m.
Source: Location and Design Manual, Vol. 1, Roadway Design, Ohio
Department of Transportation, with permission.
If the problem cannot be resolved in this manner, then consideration should be given to providing passing lane sections or constructing a multilane facility.
Decision Sight Distance. Stopping sight distances are usually sufficient to allow reasonably competent drivers to come to a hurried stop under ordinary circumstances. However, these distances may not be sufficient for drivers when information is difficult to perceive, or when unexpected maneuvers are required. In these circumstances, the decision sight distance provides a greater length for drivers to reduce the likelihood of error in receiving information, making decisions, or controlling the vehicle.
The following are examples of locations where it is desirable to provide decision sight distance: (1) exit ramps, (2) diverging roadway terminals, (3) intersection stop bars, (4) changes in cross section, such as toll plazas and lane drops, and (5) areas of concentrated demand where there is apt to be “visual noise” (i. e., where sources of information compete, such as roadway elements, traffic, traffic control devices, and advertising signs).
Table 2.4 shows decision sight distances based on design speed and avoidance maneuvers. The table lists values for five different avoidance maneuvers. Maneuvers A (rural stop) and B (urban stop) are calculated similar to the standard stopping sight distance values, except that perception times are increased to 3.0 s for rural environment and 9.1 s for urban. For maneuvers C (rural area), D (suburban area), and E (urban area), the braking component is replaced by an avoidance maneuver. This can be a change in speed, path, or direction. Values shown are calculated based on distance traveled during the perception-maneuver time. This time varies with speed and ranges from 10.2 to 10.7 s for rural areas, 12.1 to 12.4 s for suburban areas, and 14.0 to 14.1 s for
|
TABLE 2.3B Minimum Passing Sight Distance (PSD) for Design Speeds from 20 to 70 mi/h (32 to 113 km/h) PSD
|
Using S = minimum passing sight distance L = length of crest vertical curve A = algebraic difference in grades (%), absolute value K = rate of vertical curvature
• For a given design speed and an A value, the calculated length L = K X A.
• To determine S with a given L and A, use the following:
For S < L: S = 52.92 VK, where K = L/A. For S > L: S = 1400/A + L/2.
Conversions: 1 mi/h = 1.609 km/h, 1 ft = 0.305 m.
Source: Location and Design Manual, Vol. 1, Roadway Design, Ohio Department of Transportation, with permission.
urban areas. To calculate available distance on a crest vertical curve, the driver’s eye height is 3.5 ft (1.07 m) and the height of the object to be avoided is 2.0 ft (0.61 m).
Where conditions call for the use of a decision sight distance in design that cannot be achieved, every effort should be made to provide the stopping sight distance values from Table 2.2. Consideration should also be given to using suitable traffic control devices to provide advance warning of the unexpected conditions that may be encountered.


Leave a reply