LIFE CYCLE COST ANALYSIS OF PAVEMENTS
It is seldom readily apparent which is the most economical rehabilitation method for a particular pavement. Each rehabilitation strategy has unique initial construction costs, performance expectations, and future maintenance needs. What is most economical for one pavement may not be for another. Local costs may differ from one location to another, and material performance expectations may be different from region to region. The only rational way to compare one rehabilitation strategy and another is to perform an economic analysis of the alternative strategies. The method used for such a study is the life cycle cost analysis (see Chap. 10).
It is not good practice to compare a minor pavement rehabilitation strategy and a complete pavement replacement strategy. Even when comparing a new rigid pavement and a new flexible pavement, difficult choices must be made concerning the expected performance of each pavement type. Table 3.29 shows a hypothetical example of life cycle cost analysis assuming a 35-year performance period for both alternatives with no salvage values at the end of the period. It is not the intent to show that one pavement type has an economical advantage over another, as many hypothetical assumptions were made in the example. The intent is to indicate the level of information needed to make a life cycle cost analysis, and the information an analysis presents.
Probably the most important consideration in a life cycle cost analysis is the selection of the discount rate used to evaluate the time value of money. It is sometimes defined as the difference between the market interest rate and the rate of inflation. (Article 10.8.2 provides further discussion on this subject.) Because costs are incurred at different times over the life of a pavement, the discount rate is used to convert these costs occurring at different times to equivalent costs in present dollars. In the example
|
||||||||||||||||||||||||||||||||||||||||||||||||||||||||||||||||||||||||||||||||||||||||||||||||||||||||||||||||||||||||||||||||||||||||||||||||||||||||||||||||||||||||||||||||||||||
|
|||||||||||||||||||||||||||||||||||||||||||||||||||||||||||||
|
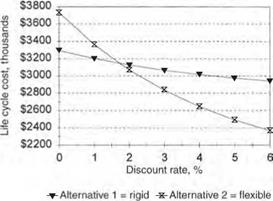
FIGURE 3.59 Sensitivity analysis showing effect of discount rate selection on life cycle cost of pavement alternatives. |
shown in Table 3.29, the discount rate was unrealistically assumed as zero. Figure 3.59 shows the effect of discount rates from 0 to 6 percent. As is typically the case, the analysis is very sensitive to the discount rate. In this example, the rigid pavement provides the lower life cycle cost when the discount rate is less than about 1.7 percent, and the flexible pavement when the rate is higher. It is apparent that the discount rate must be selected with great care.


Leave a reply