Computer-Aided Design and Drafting (CADD)
As an example of the use of CADD files and design software, the Ohio Department of Transportation (ODOT) has stated that this is the preferred method of preparing plans. ODOT has adopted MicroStation and GEOPAK as its standard drafting and design software (Ref. 8). (Note: The preferences mentioned here are those used by ODOT and are cited here only as an example. This is not intended to be an endorsement by the authors. Other agencies use a variety of similar programs.) The standards referenced in the ODOT manual have been developed and tested using the software versions listed on the web site www. dot. state. oh. us/cadd/GPKStandards. For a more detailed explanation and background of the use of CADD in ODOT plan development, the reader may view the CADD Manual at www. dot. state. oh. us/cadd/CaddManual.
All highway CADD software programs are based on a two – or three-dimensional coordinate system that assigns coordinates of a specific point to a number or alphanumeric label. Groups of points make up alignments or property boundaries or roadway centerlines, pavement edges, curbs, sidewalks, etc., in the two-dimensional “plan” view. In the three-dimensional environment, these points have “elevation” values to go along with their x-y plan view coordinates. Likewise, in roadway profiles, similar points make up the vertical profile of a roadway. This also is a two-dimensional
|
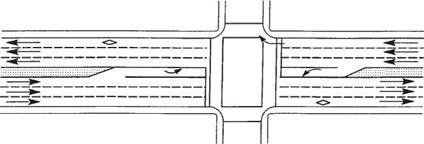
FIGURE 2.72 Common transition for concurrent HOV lanes. (From Guide for the Design of High Occupancy Vehicle Facilities, American Association of State Highway and Transportation Officials, Washington, D. C., 2004, with permission) |
|
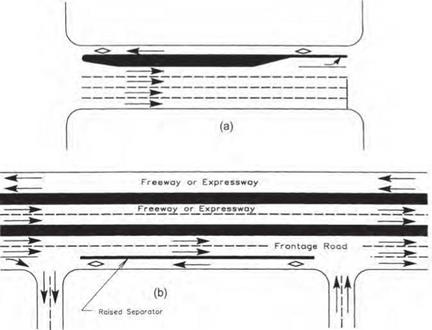
FIGURE 2.73 Typical contraflow HOV lane arrangements. (a) Right curb lane. (b) Left curb lane. (From Guide for the Design of High Occupancy Vehicle Facilities, American Association of State Highway and Transportation Officials, Washington, D. C., 2004, with permission) |
display using the centerline of the plan view along with its associated elevation. Although vertical curves consist of a series of closely spaced points in a drawing, they take on the appearance of a “curve” to the viewer. In a cross-section view, the elevation component of the point is shown along with its offset reference to the centerline. The view generated is one in which a “slice” of the roadway is taken as it would look if you took a perpendicular plane to the driver and lifted a section of the road up to see it. In the world of CADD, all these points are three-dimensional and yet have been used, as described above, to generate three different combinations of two-dimensional drawings. These two-dimensional drawings make up the majority of the sheets in a set of highway construction plans. The value of CADD is that the points are entered only once, by a described alignment or profile or cross slope in a cross section, and yet have been recalled in numerous applications throughout the plans—whether in developing final cross sections, earthwork calculations, intersection details, drainage designs, etc. CADD software allows the assignment of “names” to various sets of points, such as the centerline of a roadway or the boundary of a property. It also can assign points that are closely associated, if not connected, to a group called a layer or level in the CADD drawing file. One such layer may contain points for a bridge, or even subdivided into layers for bridge deck, bridge abutment, bridge pier, etc. Other layers can be used for hydraulics, lighting, signals, or signs. The assignment of points to layers is limited only by the storage assignment capability of the software and the capacity of the computer memory itself, which far exceeds that required for most projects. The following sections describe the components of a basic set of highway plans, without reference to CADD applications. However, the end product can be completely produced in the CADD environment.


Leave a reply