Fault-tree analysis
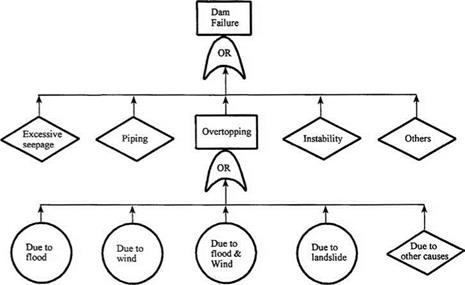
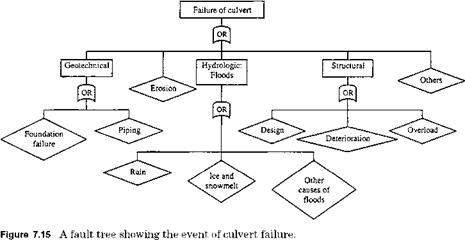
Conceptually, fault-tree analysis, unlike event-tree analysis, is a backward analysis that begins with a system failure and traces backward, searching for possible causes of the failure. Fault-tree analysis was initiated at Bell Telephone Laboratories and Boeing Aircraft Company (Barlow et al., 1975). Since then, it has been used for evaluating the reliability of many different engineering systems. In hydrosystems engineering designs, fault-tree analysis has been applied to evaluate the risk and reliability of earth dams, as shown in Fig. 7.14 (Cheng, 1982), underground water control systems (Bogardi et al., 1987), and water-retaining structures including dikes and sluice gates (Vrijling, 1987, 1993). Figure 7.15 shows a fault tree for the failure of a culvert as another example.
A fault tree is a logical diagram representing the consequence of the component failures (basic or primary failures) on the system failure (top failure or
|
Figure 7.14 Simple fault tree for failure of existing dams. (After Cheng, 1982.) |
|
|
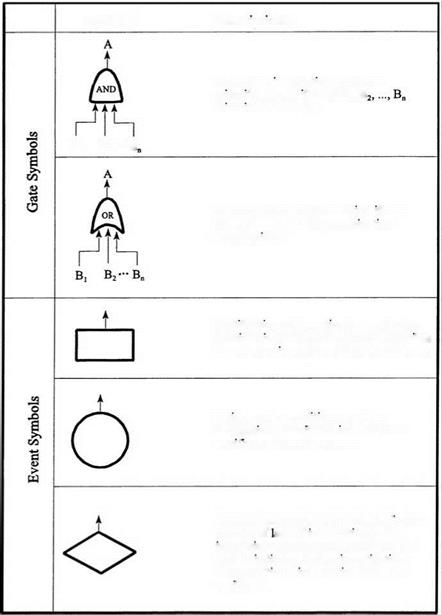
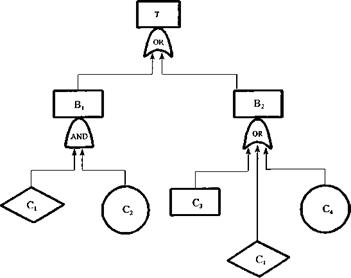
top event). A simple fault tree is given in the Fig. 7.16a as an example. Two major types of combination nodes (or gates) are used in a fault tree. The AND node implies that the output event occurs only if all the input events occur simultaneously, corresponding to the intersection operation in probability theory. The OR node indicates that the output event occurs if any one or more of the input events occur, i. e., a union. The two and three other frequently used event notations are shown in Fig. 7.17. Boolean algebra operations are used in fault-tree analysis. Thus, for the fault tree shown in Fig. 7.16,
B1 = C1 П C2 B2 = C3 U C4 U C1
Hence the top event is related to the component events as
T = B1 U B2 = (C1 П C2) U (C3 U C4 U C1) = C1 U C3 U C4
Thus the probability of the top event occurring can be expressed as
P(T) = P(C1U C3 U C4)
If C1, C3, and C4 are mutually exclusive, then
P (T) = P (C1) + P (C3) + P (C4)
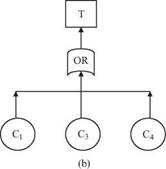
Hence Fig. 7.16a can be reduced to an equivalent but simpler fault tree as Fig. 7.16b. System reliability ps, sys(t) is the probability that the top event does not occur over the time interval (0, t].
Dhillon and Singh (1981) pointed out the advantages and disadvantages of the fault-tree analysis technique. Advantages include
1. It provides insight into the system behavior.
2. It requires engineers to understand the system thoroughly and deal specifically with one particular failure at a time.
|
(a) |
|
Figure 7.16 An example fault tree: (a) original fault tree before simplification; (b) reduced fault tree. |
3. It helps to ferret out failures deductively.
4. It provides a visible and instructive tool to designers, users, and management to justify design changes and tradeoff studies.
5. It provides options to perform quantitative or qualitative reliability analysis.
6. The technique can handle complex systems.
7. Commercial codes are available to perform the analysis.
Disadvantages include
1. It can be costly and time-consuming.
2. Results can be difficult to check.

|
|
|
|
|
|
 |
|
|

3. The technique normally considers that the system components are in either working or failed state; therefore, the partial failure stats of components are difficult to handle.
4. Analytical solutions for fault trees containing standbys and repairable components are difficult to obtain for the general case.
5. To include all types of common failure causes requires considerable effort.
Fault-tree construction. Before constructing a fault tree, engineers must thoroughly understand the system and its intended use. One must determine the higher-order functional events and continue the fault event analysis to determine their logical relationships with lower level events. Once this is accomplished, the fault-tree can be constructed. A brief description of fault-tree construction is given in the following paragraphs. The basic concepts of fault – ree analysis are presented in Henley and Kumamoto (1981) and Dhillon and Singh (1981).
The major objective of fault-tree construction is to represent the system condition that may cause system failure in a symbolic manner. In other words, the fault tree consists of sequences of events that lead to system failure. There are actually two types of building blocks: gate symbols and event symbols.
Gate symbols connect events according to their causal relation such that they may have one or more input events but only one output event. Figure 7.17 shows the two commonly used gate symbols and three types of commonly used event symbols. A fault event, denoted by a rectangular box, results from a combination of more basic faults acting through logic gates. A circle denotes a basic component failure that represents the limit of resolution of a fault tree. A diamond represents a fault event whose causes have not been fully developed. For more complete descriptions on other types of gate and event symbols, readers are referred to Henley and Kumamoto (1981).
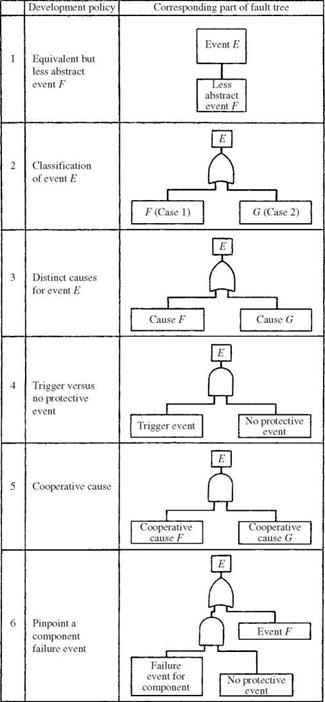
Henley and Kumamoto (1981) presented heuristic guidelines for constructing fault trees, and these are summarized in Table 7.1 and Fig. 7.18 and are listed below:
1. Replace abstract events by less abstract events.
2. Classify an event into more elementary events.
3. Identify distinct causes for an event.
4. Couple trigger events with “no-protection actions.”
5. Find cooperative causes for an event.
6. Pinpoint component failure events.
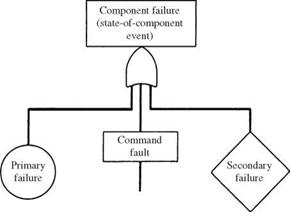
7. Develop component failure using Fig. 7.18.
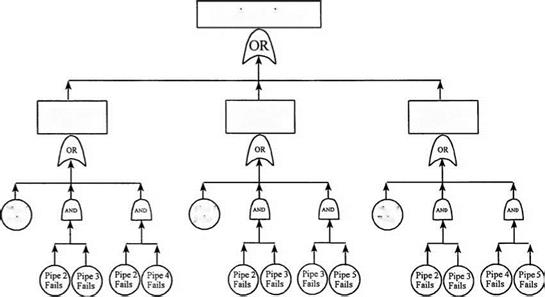
Figure 7.19 shows a fault tree for the example pipe network of Fig. 7.9.
|
Source: Henley and Kumomoto (1981). |
|
Evaluation of fault trees. The basic steps used to evaluate fault trees include
(1) construction of the fault tree, (2) determination of the minimal cut sets, (3) development of primary event information, (4) development of cut-set information, and (5) development of top event information.
To evaluate the fault tree, one always should start from the minimal cut sets that in essence, are critical paths. Basically, the fault-tree evaluation consists of two distinct processes: (1) determination of the logical combination of events
Figure 7.19 Fault tree for reliability analysis of example pipe network in Fig. 7.9.
that cause top event failure expressed in the minimal cut sets and (2) numerical evaluation of the expression.
Cut sets, as discussed previously, are collections of basic events such that if all these basic events occur, then the top event is guaranteed to occur. The tie set is a dual concept to the cut set in that it is a collection of basic events of which if none of the events in the tie set occur, then the top event is guaranteed not to occur. As one could imagine, a large system has an enormous number of failure modes. A minimal cut set is one that if any basic event is removed from the set, the remaining events collectively are no longer a cut set. By the use of minimum cut sets, the number of cut sets and basic events are reduced in order to simplify the analysis.
The system availability Asys(t) is the probability that the top event does not occur at time t, which is the probability of the systems operating successfully when the top event is an OR combination of all system hazards. System unavailability Usys(t), on the other hand, is the probability that the top event occurs at time t, which is either the probability of system failure or the probability of a particular system hazard at time t.
System reliability ps, sys(t) is the probability that the top event does not occur over time interval (0, t). System reliability requires continuation of the nonoccurrence of the top event, and its value is less than or equal to the availability. On other hand, the system unreliability, pf, sys(t) is the probability that the top event occurs before time t and is complementary to the system reliability. Also, system unreliability, in general, is greater than or equal to system unavailability. From the system unreliability, the system failure density f sys(t) can be obtained according to Eq. (5.2).


Leave a reply