Criteria and Constraints for Pollution Mitigation

12.3.1 Consideration of Site Sensitivity and Vulnerability

Analysis of the natural conditions of a road course is usually the second stage in the planning of the road construction where the first stage is defined by legislation and socio-economic factors. The protection level of the water and water environment from road influences depends on factors that are connected with:

i) road and traffic characteristics;

ii) natural sensitivity and vulnerability of the existing environment; and

iii) presence of the areas with special public interest (e. g. public water supply re­sources, special areas for vineyards, locations of rare flora or fauna, Natura 2000, etc.).

For example, the protection of the water environment on a low permeable clay stra­tum will need to be totally different from the protection needed on a high yield intergranular aquifer that represents an important source of drinking water. At the same time the protection required against a highly trafficked road will be totally dif­ferent from the protection needed against a low traffic road with only a few vehicles per day.

To establish sound and cost efficient measures for water protection from nega­tive road influences, the natural conditions must be correctly characterised and well understood to enable the proper planning and design of protection measures. The natural conditions of the road corridor are analysed in the field using classical hydro – and hydrogeo-logical methods (O’Flaherty, 2001; DoE, 2005; Brassington, 1998). Results of those investigations are used to determine the level of water protection.

When designing technical measures for groundwater protection, the goal of proper protection of hydro-environments from a road’s influence will, usually, only be achieved by developing, defining and adopting a classification scheme. Such a scheme must be based on a conceptual model of the road’s course above water bodies and a conceptual model of the hydro-logical system’s source-pathway-target arrangements. These conceptual models can be divided into two main groups; those for surface water bodies and those for groundwater bodies.

The degree of protection required for a surface water body from negative road influences depends on its ecological, qualitative (chemical) and quantitative status. The most important relation in designing protection measures for surface water bod­ies is the ratio between run-off water discharged from the paved surface of road and the discharge of flowing water in the receptor river/stream bed. In general, the principle is that the quality of the receiving water should not be deteriorated by the arriving water. This is minimised by ensuring that the road-water: receiving-water ratio should be strongly in favour of the receiving surface water body.

Special care is needed when water from a road is discharged into a standing water body. In this case the mass of contaminant entering the static water body becomes more important rather than concentration (which is the most important in stream and river situations). A mass-balance calculation will typically be required to deter­mine the amount of contaminant that can be handled by the static water body. This requirement is illustrated in Fig. 12.1 for a man-made wetland environment com­prising an, essentially, static water body with small and intermittent surface water inflows and outflows. Special care is also needed when dispersal of road run-off is planned. Dispersal is possible only in the case when average daily traffic is relatively low. A less effective, but more controllable solution is provided by “underground” wetlands (Fig. 12.2).

When a road crosses a water catchment area (especially small ones) road con­structors are often tempted to concentrate the small upstream watercourses in a single water structure (e. g. a pipe) in order to cross the road. Such a concentration of upstream catchment area run-off modifies the normal flow-rate of the downstream part of the watercourse, leading to an increased erosion over a variable distance unless the stream bed is adapted to the new hydraulic conditions (SETRA, 1993). Upstream, in case of runoff exceeding the discharge capacity of the pipe (e. g. after a

Man-Made Wetlands

(Organic Soil, Microbial Fauna,

Algae, Plants, Microorganisms)

Fig. 12.1 Contaminant mass transfer considerations required for a man-made wetland (Van Deuren et al., 2002). Reproduced by permission of U. S. Army Environmental Command

storm), the road body may temporary act as a dam, inducing flood and stagnant waters. Lastly, all the downstream parts of watercourses that were diverted up­stream, toward the main course, are no longer fed by the catchment area. All these hydraulic perturbations induce impacts on aquatic habitats and organisms. They can be avoided thanks to an improvement of the road structure’s hydraulic transparency, by means of sufficient upstream-downstream connections across the road structure (Fig. 12.3).

To define the influence of road pollution on groundwater bodies, the groundwater vulnerability concept can be applied. The most useful definition of vulnerability is one that refers to the intrinsic characteristics of the aquifer, which are relatively static and mostly beyond human control. It is proposed, therefore, that the ground­water vulnerability to pollution is defined as the sensitivity of groundwater quality to an imposed contaminant load, which is determined by the intrinsic character­istics of the aquifer. Thus defined, vulnerability is distinct from pollution risk. It is important to recognise that the vulnerability of an aquifer will be different for

different pollutants. For example, groundwater quality may be highly vulnerable to the loading of heavy metals from road runoff and, and yet be less vulnerable to the loading of pathogens originating from the same source. In view of this reality, it is scientifically most sound to evaluate vulnerability to pollution in relation to a partic­ular class of pollutant. This point of view can be expressed as specific vulnerability (COST 620, 1998).

An example to illustrate this approach is a conceptual model adopted in road construction in Slovenia (Brencic, 2006). For groundwater bodies, protection is de­fined by a simple conceptual model of an aquifer that is divided into unsaturated and saturated parts. Protection requirements follow from:

• the estimation of transit time of the probable pollutant as it takes its route from the source on the road through the unsaturated zone; and

• on the interaction of the probable pollutant with the soil and water through which it passes en-route to the groundwater.

The greater the spreading of pollutant in the vertical direction, the higher is the vulnerability of the water resource. On the basis of the estimation of the pollutant spread and progression in the direction of the water resource e. g. borehole, spring, etc., the classification of arrival times from the spill location, or permanent pollution point due to the road operation, to the water resource is defined. Based on the cross­classification between vertical and horizontal spreading velocity of the pollutant, mitigation guidelines for the selection of suitable technical protection measures of the groundwater from negative highway influences were defined (Brencic, 2006).

Summary and Conclusions

Hwang et al. (1981) presented a review of literature related to system reliability evaluation techniques for small to large complex systems. A large system was defined as one that has more than 10 components and a moderate system as one which has more than 6 components and less than 10. Complex systems were defined as ones that could not be reduced to a series-parallel system. Hwang et al. concluded that for a large, complex system, computer programs should be used that provide the minimum cut sets and calculate the minimal cut approx­imation to system reliability. Minimal paths can be generated from minimum cuts. Based on minimum cut sets, reliability approximations then can be ob­tained for large, complex networks. Hwang et al. also noted that Monte Carlo methods for system reliability evaluation can be used when component relia­bilities are sampled by the Monte Carlo method. They also identified several miscellaneous approaches for evaluating complex systems, including a moment method, a block-diagram method, Bayesian decomposition, and decomposition by Boolean expression.

Hwang et al. (1981) concluded that of all the evaluation techniques in the papers surveyed, only a few had limited success in solving some large, complex

system reliability problems, and few techniques have been completely effective when applied to large system reliability problems. They suggested that a gen­erally efficient graph partitioning technique for reliability evaluation of large, highly interconnected networks should be developed.

Since the 1981 paper by Hwang et al., several other system reliability eval­uation techniques have been reported in the literature. Aggarwal et al. (1982) presented a method that uses decomposition of a probabilistic graph using cut sets. The method is applied to a simplified network with five nodes and seven links, and only limited computational results are presented.

Appendix 7A: Derivation of Bounds for Bivariate Normal Probability

Consider two performance functions Wj (Z’) = 0 and Wm(Z’) = 0 in a two­dimensional standardized, uncorrelated normal space whose design points are z j * and z m*, respectively. At each of the design points, the first-order failure hyperplanes can be expressed as

Wj (Zо = 0 ^ (Z – 4, j*) = aj + ayZ[ + ayZ2 (7A.1)

k=1 ‘ k ‘

2 f d W

Wm(Z0 = 0 ^ ^ 4 rrj, ) (Zk — Zk m*) = a0m + a1mZ1 + a2mZ2 (7A.2)

іґЛd Zkl,

Summary and Conclusions Подпись: Zk,m* Подпись: fork = 1, 2
Summary and Conclusions

in which zk, m* is the coordinate of the kth stochastic basic variable at the design point z’m* of the mth performance function, and

The covariance between the two performance functions can be obtained as

Cov[Wj (Z/), Wm(Z )] = E{[(a0j + a1jZ1 + a2jZ2) — a0j]

x [(a0m + a1mZ1 + a2mZ2) — a0m]}

= E [(a1jZ1 + a2jZ2)(a1mZ1 + a2mZ2)]

= a1ja1m + a2ja2m (7A..3)

Hence the correlation coefficient between the two performance functions at the design points is

Summary and Conclusions

a1ja1m + a2ja2m


(7A.4)


Pjm —


a2j + a!’Va2m + a2m


Подпись: pjm — Summary and Conclusions Подпись: (7A.5)

This can be generalized to multidimensional problems involving M stochastic basic variables as

Подпись: Pjm — Подпись: a1j a2j vj4’ v4-+4 Summary and Conclusions Summary and Conclusions

Note that the preceding correlation coefficient between the two performance functions Pjm is exactly equal to the inner product of the corresponding direc­tional derivative vectors

Подпись: (7A.6) ( aj*) ( am*) — (aj*) (am*)

— |aj||am*| cos в

— cos в

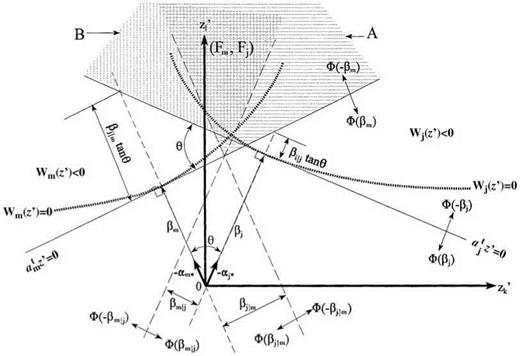
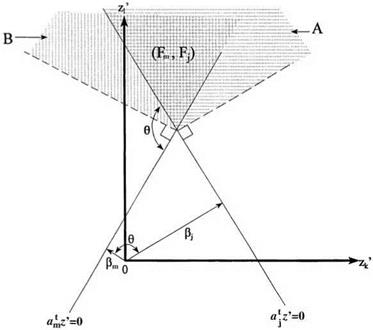
in which в is the angle between the directional derivatives of the two perfor­mance functions. Hence, if the two performance functions are positively cor­related, the angle в between am* and aj * lies in the range 0° < в < 90°. On the other hand, negative correlation between Wj (Z) and Wm(Z) corresponds to the range 90° < в < 180°. Plots for positively and negatively correlated performance functions are show in Figs. 7A.1 and 7A.2, respectively.

When Wj (Z) and Wm(Z) are positively correlated, that is, pjm > 0, referring to Fig. 7A.1, the shaded area representing the joint failure of the two perfor­mance functions satisfies the following relationships:

(Fj, Fm) э A and (Fj, Fm) э B

in which (Fj, Fm) represents the joint failure events of the two performance functions, and sets A and B are defined in Fig. 7A.1.

Again, referring to Fig. 7A.1, the following relationship holds:

Max[P(A), P (B)] < P(Fj, Fm) < P(A) + P (B) (7A.7)

By orthogonality, one has

P (A) — Ф(-Pm)Ф(Pj | m) (7A.8)

P (B) — Ф(вj m, Pmj) (7A.9)

1 n ej — pjmfim „ Pm — pmjPj. л лл

where Pj | m — , =- Pm | j — , = (7A.10)

V 1 — Pjm у 1 — pmj

which are defined in Fig. 7A.1.

Summary and Conclusions

Figure 7A.1 Two intersecting tangent planes with positively correlated failure events. (Ang and Tang, 1984.)


Figure 7A.2 Two intersecting tangent planes with negatively correlated fail­ure events. (Ang and Tang, 1984.)


Summary and Conclusions

Referring to Fig. 7A.2 for negatively correlated Wj (Z) and Wm(Z), it can be observed that

(Fj, Fm) c A and (Fj, Fm) c B

resulting in

0 < P(Fj, Fm) < min[P(A), P(B)] (7A.11)

Подпись: Problems
with P(A) and P(B) given in Eqs.(7A.8) and (7A.9), respectively.

7.1

Summary and Conclusions Подпись: Figure 7P.1 Configuration of var-ious systems for Problem 7.1.
Summary and Conclusions

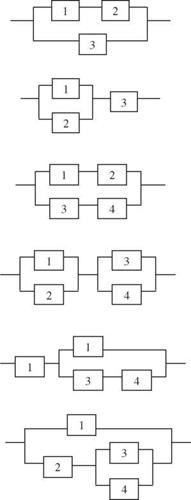
Derive the expression of system reliability for the system configurations shown in Fig. 7P.1 under the condition of (a) all units are dependent and different and (b) all units are independent and identical.

7.2 Consider that two independent, identical units are to be added to an existing unit that would result in three units in the whole system.

(a) Sketch all possible system configurations according to the arrangement of the three units.

(b) Rank your system configurations according to the system reliability.

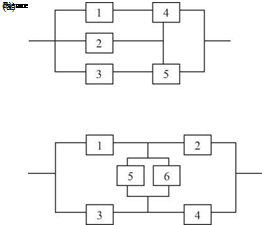
7.3 Consider the two system configurations shown in Fig. 7P.2. Use the cut-set method to determine the system reliability. Assume that all system components are iden­tical and behave independently of each other.

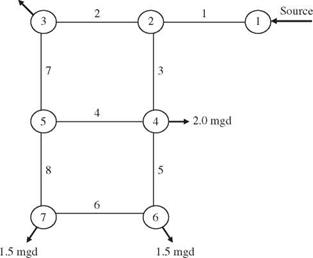
7.4 Consider a hypothetical water distribution network consisting of two loops, as shown in Fig. 7P.3. Let’s say that the service failure of the system is when at least one demand node cannot receive water. (a) Construct a tree diagram indi­cating failure cases for the water distribution network. (b) Determine the system reliability if all pipe sections behave independently, and each has a breakage probability of 0.03.

7.5 Resolve Problem 7.4 by cut-set analysis.

7.6 Resolve Problem 7.4 by tie-set analysis

7.7 Resolve Problem 7.4 by the conditional probability approach.

7.8 Summary and Conclusions
A detention basin is designed to accommodate excessive surface runoff temporar­ily during storm events. The detention basin should not overflow, if possible, to prevent potential pollution of the stream or other receiving water bodies. For simplicity, the amount of daily rainfall is categorized as heavy, moderate, and light (including none). With the present storage capacity, the detention basin is capable of accommodating runoff generated by two consecutive days of heavy rainfall or three consecutive days of at least moderate rainfall. The daily rainfall amounts around the detention basin site are not entirely independent. In other

Summary and Conclusions

2.5 mgd

Figure 7.3 Hypothetical water distribution network.

words, the amount of daily rainfall on a given day would affect the daily rainfall amount on the next day. Let random variable Xt represent the amount of rain­fall on any day t. The transition probability matrix, indicating the conditional probability of rainfall amount in a given day t conditioned on the rainfall amount of the previous day t — 1, is shown in the following table (after Mays and Tung 1992).

Xt+1

Heavy (H)

Moderate (M)

Light (L)

X t Heavy (H)

0.3

0.5

0.2

Moderate (M)

0.3

0.4

0.3

Light (L)

0.1

0.3

0.6

Work Begins

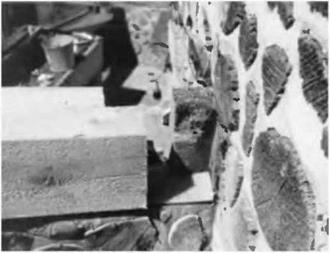
Подпись: Fig. 5.7:1 notched the east side eight-by-eight girt to fit it up against the stub of the original four-by-eight rafter. I chiseled and scraped deteriorated wood, back to sound material, and doused the area with a water-sealing product. Note the use of Sill Sear between the girt and the top mortar joint of the cordwood wall.image115Former Earthwood student Doug Kerr visited for a week to help out on the early stages of the project. He wanted to learn timber framing, but didn’t want to wait for the book. Doug arrived in the evening, and the next morning we tore up the entire front sitting deck, and all of the original four-by­eight deck joists. The post-and-beam frame of the original solar room’s south wall was still in excellent condition.

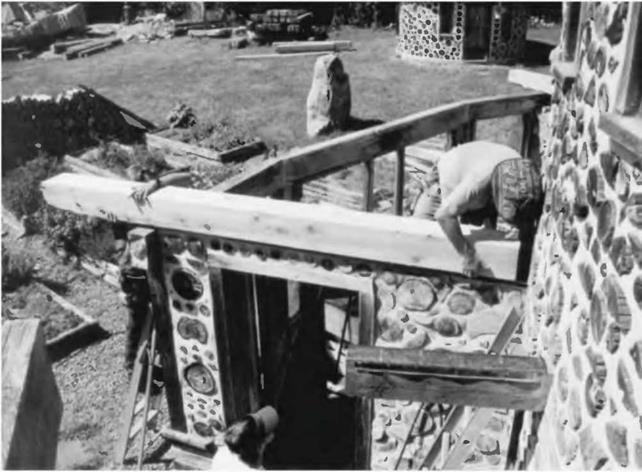
Подпись:Подпись:image116The east and west walls of the lower story were 16-inch cordwood walls, and, for insulation and architectural purposes, we wanted to maintain that same width and style in the new addition. I chose to install new cedar eight-by-eight girts where the old deteriorated doubled four-by-eights had been removed. The south end of the eight-by-eight would be supported directly by the six-by-ten girder that ran along the south side of the original solar roof. But how would we fasten the northern ends of these girts? Improvisation. There was enough of a stub on each of the original four-by-eight floor joists to fasten to, as seen in Fig. 5.7. With my chainsaw, I removed a 4- by 4-inch by 8-inch-high (10.i – by 10.1-centimeter by 20.3-centimeter-high) chunk of wood from the new cedar girt, and fastened it to the stub using two seven – inch (180-millimeter) lag screws.

Remember that the cordwood wall would also be supporting this girt all along its length. Fig. 5.8 shows the east wall girt being installed.

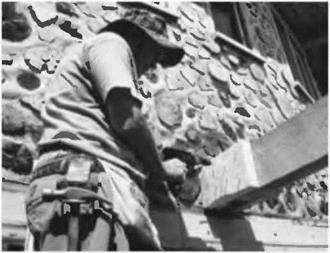
situations. The center floor joist had only 6V2 inches 16.5 centimeters) of good sound four-by-eight extending from the wall. As it was the center joist, maintaining symmetry was important. In this case, we used a wooden gusset system, the gussets made from two scrap pieces of two-by-eight material, each about a foot long. In Fig. 5.9, I apply wood glue to one side of one of the gussets. In many instances, gussets are made of plywood, such as with homemade trusses. I didn’t have plywood at the ready in this case, and, as the join would be exposed, I figured that the two-by-eight pieces would look better anyway. Gussets used in this fashion must be used in pairs, one each side of the joint, just like truss plates on trusses. Otherwise, most of the strength of the joint is lost.

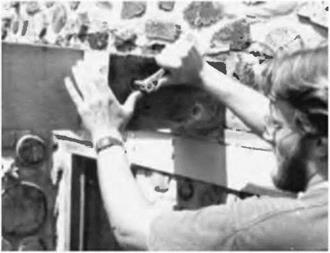
Подпись: Fig. 5.9: Glue is applied to the gusset. image117Подпись: Fig. 5.10: Gussets are screwed and glued to the joists, with half of the gusset on each side of the join.image118Подпись: Fig. 5.11: Doug tightens a hex nut up to a washer on the threaded end of one of the bolts. As Doug looks at the stub, he is installing a bolt at the upper left and lower right of the stub, keeping about three inches from all edges. The carriage end of the bolt is on the other side of the unit, and is drawn into the new four-by-eight by tightening the nut. We countersunk the nuts and washers, so that we could use 8- inch bolts without the threaded end protruding from the joist.image119In Fig. 5.10, I used an electric drill to mount the glued gusset to the two four – by-eights which are butted together. I used four screws on each side of the joint. Half of the gusset (six inches or 15.2 centimeters) was screwed and glued to the original stub, and the other half was similarly fastened to the new joist. The gusset on the other side got the same treatment.

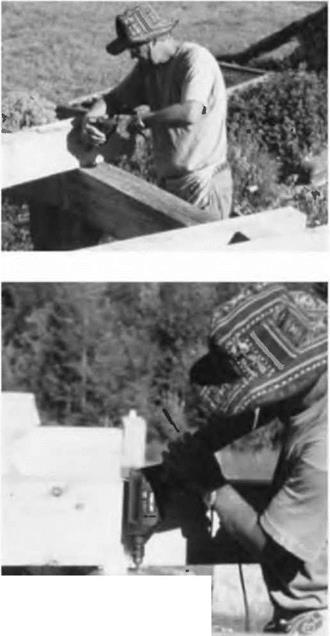
The remaining two joist extensions were a different situation, so we used a different solution. The original joists extended into the space about eighteen inches (45.7 centimeters), and symmetry was not an issue, the way it was in the center. So in this case, we simply fastened the new four-by-eight alongside of the original member, using glue and two strong one-half-inch by 8-inch (1.2- by 20.0-centimeter) carriage bolts. Carriage bolts have rounded heads and a square section just under the head that grabs the wood by pressure and friction. The trick

here is to join the rafters together temporarily while a half-inch hole is drilled all the way through both. There are a variety of clamps that will work for this purpose, or you can temporarily toe-screw the two pieces together while you drill. Again, glue between the pieces makes for a stronger joint. In our case, I used just two large bolts to make the joint. See Fig. 5.11.

Подпись: Fig. 5.12: The author toe-screws the four-by-eight joist to the six- by-ten girder.Подпись: Fiig. 5.13: A right angle fastener can take the place of toenails or toe-screws.image120Fastening the Joist to the Girder

The nice thing about wide joists like four-by-eights and five-by-tens is that they are stable when supported by a wall or girder, unlike two-bys, which can fall over quite easily. Cross-bracing or bridging of two-bys is not only prudent, but building codes require it.

Another nice thing about heavy joists is that they are esthetically pleasing, particularly when the depth of the timber is twice as great as its breadth.

Four-by-eights are very stable over the girder, but they must still be fastened, so that they don’t slide laterally. In Fig. 5.12,1 am toe-screwing the joist to the six – by-ten girder. In Fig. 5.13, I use a right-angle galvanized plate to hold the joist in its correct position over the girder.

EARTH PRESSURE CONSIDERATIONS AND DETERMINATION

Once a proper selection has been made of feasible wall types that satisfy the necessary constraints, design consists of determining the earth pressure against the back of the wall and then proportioning the wall so that it will be structurally sufficient to satisfy a number of traditional checks. These checks include stability against sliding and overturning, and foundation bearing pressure limits. Clearly, satisfying the traditional checks would be of no value if the entire structure were to move because of some condition not related to any of these three checks. Therefore, it is also important that the designer be assured that the wall is globally stable—i. e., that no deep-seated slide or slip surface exists.

An important and essential part of the design of retaining walls consists of deter­mining the earth pressure on the back of the wall. The earliest theory of earth pressure traces back to Charles-Augustin de Coulomb, who published his work in 1773. Coulomb’s theory presented a method by which a designer could determine the pressure that dry, granular, cohesionless material would exert upon the back of a wall constructed to restrain the material. His work was based on the theory that failure is characterized by a wedge-shaped mass of the supported sand material that slides down along a sloping plane such as is shown in Fig. 8.6.

The Coulomb theory assumes a hydrostatic distribution of pressure such that the resultant forces R (reaction needed to hold wedge in equilibrium) and P (summation of normal pressure times area) act at the lower third point of the planes upon which they act, planes ab and ac, respectively. The force R acts at an angle of friction of soil on concrete, ordinarily 25°, while P acts at an angle of friction of soil on soil, generally assumed to be 34°. This latter angle will vary significantly from 34° to 40° or more. Because of the different angles of friction, the theory produces an error in the result;

however, the error is generally accepted as negligible. In essence, if it is assumed that no friction exists between the earth and the wall, the pressure determined from the Coulomb theory is the same as that determined from the Rankine theory. Thus, because of its simplicity, the tendency is to use the Rankine theory. See Art. 8.2.3 for an example of active pressure calculation.

It is evident that the theory as expressed in Fig. 8.6 does not suggest a particular plane of failure. Thus, the pressure determination of the Coulomb theory is traditionally left to graphical methods, in particular those first developed by J.-V. Poncelet, and later by a German engineer, Culmann. These constructions, which allow for the complete determination of lateral pressure acting on the wall (i. e., magnitude, direction, and point of application), are not further discussed herein. However, several failure planes are usually assumed, pressure from each assumption is graphically determined, and an envelope line of pressure is developed from these pressure points from which the max­imum pressure can be determined. The methods are laborious but straightforward and may again gain in popularity with the increasing use of computers.

At approximately the same time as Culmann’s construction was developed, a Scottish physicist, W. J. M. Rankine, presented his theory in a work called On the Stability of Loose Earth, a theory that remains in active use. Rankine assumed a mass of loose earth of infinite extent, and a planar top surface subjected to its nonweight. The theory assumed granular backfill material without cohesion, but was adapted in 1915 by a British engineer to allow for cohesion.

GENERAL CUTTING

Tight trim joints require accurate layouts, sharp saws, and consistent methods.

Recuts are a fact of life. If you’re filling and painting trim, slight gaps are acceptable. But if you’re using a clear finish, joints must be tight. Before you start cutting trim, always check the accuracy of power-saw miter-stop settings by cut­ting a few joints from scrap. Then cut stock a hair long so that you can recut joints till they’re right.

Cut lines consistently. It doesn’t matter whether your sawblade cuts through the middle of a cut line or just past it. What matters is that your method is consistent. For example, moving the width of a saw kerf to one side of the line or the

Подпись:other can make the difference between tight and open joints. Some pros prefer to just “kiss” the inside of the cut-line with the saw kerf so that the line stays on the board.
Keep tools sharp. This applies to saws, chisels, planes, and utility knifes. Whenever a blade becomes fouled with resin or glue, wipe it clean immediately with solvent. A sharp tool is easier to push and thus less likely to move the stock you’re cutting. Likewise, a clean power-saw blade is less likely to bind or scorch wood.

Handsaws usually cut on the push stroke.

Start handsaw cuts with gentle pull strokes, but once the kerf is established along the cut-line, emphasize push strokes. (Western saw teeth are set so that they cut more on the push stroke, whereas Japanese saws cut more on the pull stroke.) As you continue the cut, keep your elbow behind the saw, which will help you push the saw straight and follow the cut-line.

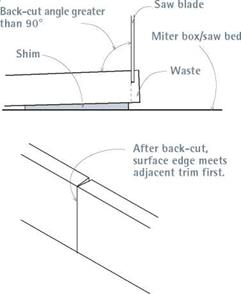
Подпись:Подпись: I Back-Cutting Trimimage848"Подпись: By raising the board's end and keeping the sawblade plumb, you create a back-cut joint whose surface edges can easily be shaved to create tight joints.

Подпись: CUTTING MITER JOINTS A miter splits a 90° corner in half, with a 45° cut on each board. With the sawblade set perpendicular to the stock (0° bevel), cut a 45° angle across the face of the trim. When the cut edges are closed together, the boards should form a right angle. Of course, if door or window frames aren't square, corners may be 89° or 91°, requiring that each miter be slightly more or less than 45°, though equal. That is, miter joints should bisect whatever angle is there. If you'll be painting the joints and the trim stock is relatively narrow (3 in. wide), you can fudge the joints and fill any gaps with spackling. But if you're installing stain-grade molding, espe-
Подпись: Back-Cutting Miters Ideally, miter cuts will meet perfectly, creating a tight joint. But back-cutting (also called undercutting) can improve the odds that joints will be tight even if corners aren't perfectly square and frame jambs aren't flush to the surrounding walls. In other words, the front faces of back-cut boards make contact before the backs, so the front edges can be finely shaved to fit. It's far less work to shave the leading edge of a back-cut board with a block plane than it is to recut the joint. The easiest way to back-cut trim is to shim under it slightly in the miter box or on the saw bed, as shown in the drawings at left. The sawblade is still set at 90 degrees (0 degree bevel), but the shimmed boards receive a slight bevel because they aren't lying flat. Even a Vim-thick sliver under the board is enough to give you a decent back cut. Fussing over a miter joint is probably not worthwhile if you plan to paint the trim because slight gaps can be filled with wood filler. But open joints are difficult to disguise when wood is to be stained and almost impossible when it is clear-sealed.

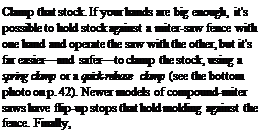
use an outfeed roller or a sawhorse to support the far end of long pieces so they don’t bow or flap as you try to cut them.

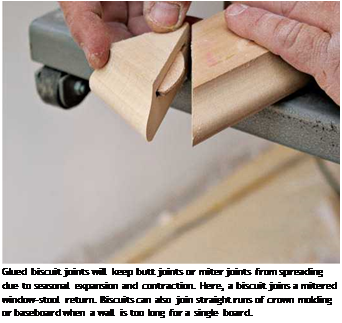
Подпись: Glued biscuit joints will keep butt joints or miter joints from spreading due to seasonal expansion and contraction. Here, a biscuit joins a mitered window-stool return. Biscuits can also join straight runs of crown molding or baseboard when a wall is too long for a single board. cially if it’s 5 in. or 6 in. wide, faking a miter joint will look terrible. So if a frame is out of square, take the time to cut and recut joints as necessary so that they bisect the frame’s angle.
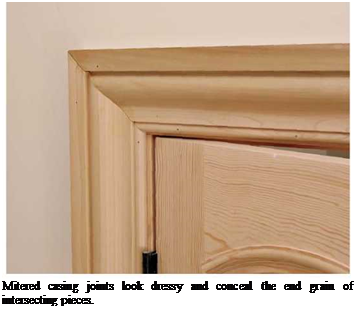
There are two good reasons to use miters. First, mitering aligns the profiles of moldings so that bead lines and other details join neatly along the joint and sweep uninterrupted around the corner. Second, although flat trim allows you to butt or miter joints at corners, with butt joints you would see the rough end grain of one of the adjoining boards. Even if you sand down the roughness, end grain soaks up extra paint or stain and so often looks noticeably different from adjacent surfaces.

Two Ways to Splice Trim

image850

SPLICING TRIM

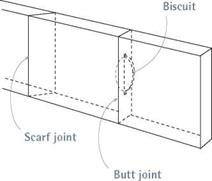
When a wall is too long for a single piece of trim, you can splice pieces by beveling their ends at a 60° angle and overlapping them (called a scarf joint), or by butt joining them and using a biscuit to hold the joint together. If boards shrink, gaps will be less noticeable in a scarf joint because you’ll see wood, rather than space, as the overlap separates. In general, scarf joints are better suit­ed to flat stock, whereas shaped molding will dis­play a shorter joint line if butted together.

(Viewed head-on, the joint is a thin, straight line.)

Position splices over stud centers so you can nail board ends securely to prevent cupping. Where that’s not possible, say, where a baseboard butts to door casing, nail the bottom of the base­board to the wall sole plate, and angle-nail the top of the baseboard to the edge of the casing. Predrill the trim or snip the nail points to mini­mize splits.

COPING A JOINT

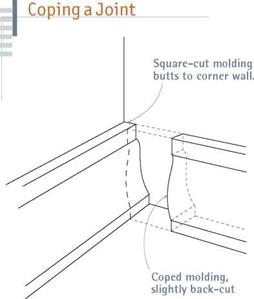
All wood trim shrinks somewhat. Where beveled boards overlap, gaps aren’t as noticeable, but shrinkage on some joints—mitered inside cor­ners, in particular—are glaringly obvious because you can see right into the joint. For this reason, carpenters cope such joints so that their meshing profiles disguise shrinkage. Basically, a coped joint is a butt joint, with the end of one board

image851

A coped joint is first mitered, then back-cut along the profile left by the miter so that the leading edge of the trim hits the adjacent trim first. That thinner, leading edge can be easily shaved to fit tightly.

Fault-tree analysis

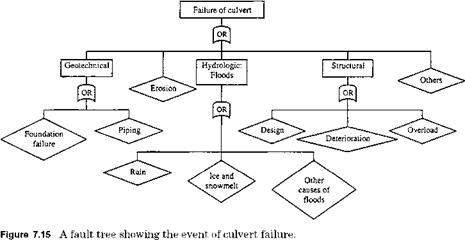
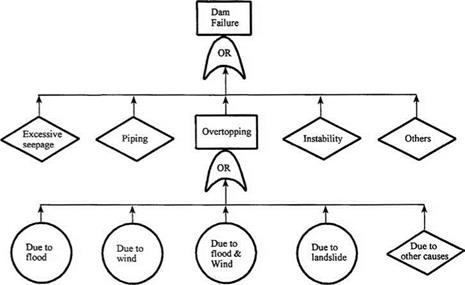
Conceptually, fault-tree analysis, unlike event-tree analysis, is a backward anal­ysis that begins with a system failure and traces backward, searching for pos­sible causes of the failure. Fault-tree analysis was initiated at Bell Telephone Laboratories and Boeing Aircraft Company (Barlow et al., 1975). Since then, it has been used for evaluating the reliability of many different engineering systems. In hydrosystems engineering designs, fault-tree analysis has been ap­plied to evaluate the risk and reliability of earth dams, as shown in Fig. 7.14 (Cheng, 1982), underground water control systems (Bogardi et al., 1987), and water-retaining structures including dikes and sluice gates (Vrijling, 1987, 1993). Figure 7.15 shows a fault tree for the failure of a culvert as another example.

A fault tree is a logical diagram representing the consequence of the compo­nent failures (basic or primary failures) on the system failure (top failure or

Fault-tree analysis

Figure 7.14 Simple fault tree for failure of existing dams. (After Cheng, 1982.)

Fault-tree analysis

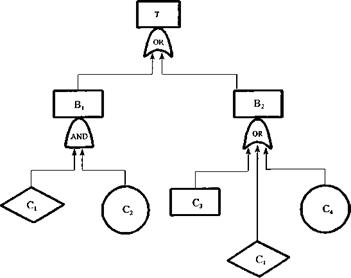
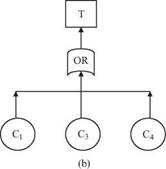
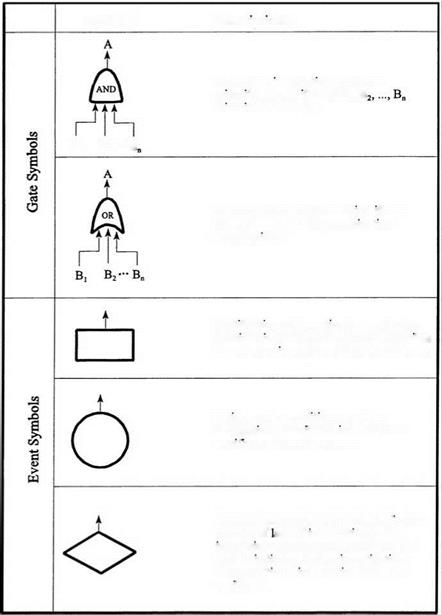
top event). A simple fault tree is given in the Fig. 7.16a as an example. Two major types of combination nodes (or gates) are used in a fault tree. The AND node implies that the output event occurs only if all the input events occur simultaneously, corresponding to the intersection operation in probability the­ory. The OR node indicates that the output event occurs if any one or more of the input events occur, i. e., a union. The two and three other frequently used event notations are shown in Fig. 7.17. Boolean algebra operations are used in fault-tree analysis. Thus, for the fault tree shown in Fig. 7.16,

B1 = C1 П C2 B2 = C3 U C4 U C1

Hence the top event is related to the component events as

T = B1 U B2 = (C1 П C2) U (C3 U C4 U C1) = C1 U C3 U C4

Thus the probability of the top event occurring can be expressed as

P(T) = P(C1U C3 U C4)

If C1, C3, and C4 are mutually exclusive, then

P (T) = P (C1) + P (C3) + P (C4)

Hence Fig. 7.16a can be reduced to an equivalent but simpler fault tree as Fig. 7.16b. System reliability ps, sys(t) is the probability that the top event does not occur over the time interval (0, t].

Dhillon and Singh (1981) pointed out the advantages and disadvantages of the fault-tree analysis technique. Advantages include

1. It provides insight into the system behavior.

2. It requires engineers to understand the system thoroughly and deal specifi­cally with one particular failure at a time.

Fault-tree analysis

(a)

Fault-tree analysis

Figure 7.16 An example fault tree: (a) original fault tree before simplifi­cation; (b) reduced fault tree.

3. It helps to ferret out failures deductively.

4. It provides a visible and instructive tool to designers, users, and management to justify design changes and tradeoff studies.

5. It provides options to perform quantitative or qualitative reliability analysis.

6. The technique can handle complex systems.

7. Commercial codes are available to perform the analysis.

Disadvantages include

1. It can be costly and time-consuming.

2. Results can be difficult to check.

Fault-tree analysis

Descriptions


Symbol


Fault-tree analysis

B, B2-B


Fault-tree analysis
Fault-tree analysis
Fault-tree analysis
Fault-tree analysis

Figure 7.17 Some basic node symbols used in fault-tree analysis.


Fault-tree analysis

Fault-tree analysis

3. The technique normally considers that the system components are in either working or failed state; therefore, the partial failure stats of components are difficult to handle.

4. Analytical solutions for fault trees containing standbys and repairable com­ponents are difficult to obtain for the general case.

5. To include all types of common failure causes requires considerable effort.

Fault-tree construction. Before constructing a fault tree, engineers must thor­oughly understand the system and its intended use. One must determine the higher-order functional events and continue the fault event analysis to deter­mine their logical relationships with lower level events. Once this is accom­plished, the fault-tree can be constructed. A brief description of fault-tree construction is given in the following paragraphs. The basic concepts of fault – ree analysis are presented in Henley and Kumamoto (1981) and Dhillon and Singh (1981).

The major objective of fault-tree construction is to represent the system con­dition that may cause system failure in a symbolic manner. In other words, the fault tree consists of sequences of events that lead to system failure. There are actually two types of building blocks: gate symbols and event symbols.

Gate symbols connect events according to their causal relation such that they may have one or more input events but only one output event. Figure 7.17 shows the two commonly used gate symbols and three types of commonly used event symbols. A fault event, denoted by a rectangular box, results from a combina­tion of more basic faults acting through logic gates. A circle denotes a basic component failure that represents the limit of resolution of a fault tree. A dia­mond represents a fault event whose causes have not been fully developed. For more complete descriptions on other types of gate and event symbols, readers are referred to Henley and Kumamoto (1981).

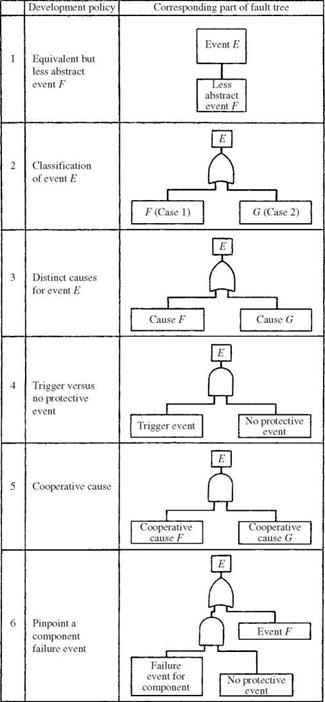
Henley and Kumamoto (1981) presented heuristic guidelines for constructing fault trees, and these are summarized in Table 7.1 and Fig. 7.18 and are listed below:

1. Replace abstract events by less abstract events.

2. Classify an event into more elementary events.

3. Identify distinct causes for an event.

4. Couple trigger events with “no-protection actions.”

5. Find cooperative causes for an event.

6. Pinpoint component failure events.

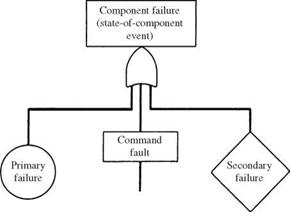
7. Develop component failure using Fig. 7.18.

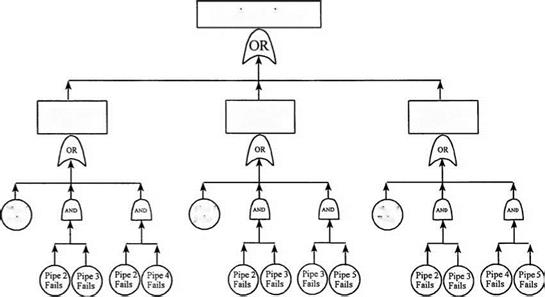
Figure 7.19 shows a fault tree for the example pipe network of Fig. 7.9.

Fault-tree analysis

Source: Henley and Kumomoto (1981).

Fault-tree analysis

Figure 7.18 Development of component failure. (Henley and Kumomoto, 1981.)


Fault-tree analysis

Evaluation of fault trees. The basic steps used to evaluate fault trees include

(1) construction of the fault tree, (2) determination of the minimal cut sets, (3) development of primary event information, (4) development of cut-set infor­mation, and (5) development of top event information.

Fault-tree analysis Подпись: User з Not Serviced Fault-tree analysis Fault-tree analysis Подпись: User 5 Not Serviced

To evaluate the fault tree, one always should start from the minimal cut sets that in essence, are critical paths. Basically, the fault-tree evaluation consists of two distinct processes: (1) determination of the logical combination of events

Figure 7.19 Fault tree for reliability analysis of example pipe network in Fig. 7.9.

that cause top event failure expressed in the minimal cut sets and (2) numerical evaluation of the expression.

Cut sets, as discussed previously, are collections of basic events such that if all these basic events occur, then the top event is guaranteed to occur. The tie set is a dual concept to the cut set in that it is a collection of basic events of which if none of the events in the tie set occur, then the top event is guaranteed not to occur. As one could imagine, a large system has an enormous number of failure modes. A minimal cut set is one that if any basic event is removed from the set, the remaining events collectively are no longer a cut set. By the use of minimum cut sets, the number of cut sets and basic events are reduced in order to simplify the analysis.

The system availability Asys(t) is the probability that the top event does not occur at time t, which is the probability of the systems operating successfully when the top event is an OR combination of all system hazards. System unavail­ability Usys(t), on the other hand, is the probability that the top event occurs at time t, which is either the probability of system failure or the probability of a particular system hazard at time t.

System reliability ps, sys(t) is the probability that the top event does not occur over time interval (0, t). System reliability requires continuation of the nonoc­currence of the top event, and its value is less than or equal to the availability. On other hand, the system unreliability, pf, sys(t) is the probability that the top event occurs before time t and is complementary to the system reliability. Also, system unreliability, in general, is greater than or equal to system unavail­ability. From the system unreliability, the system failure density f sys(t) can be obtained according to Eq. (5.2).

The first large transport canals of the 5th century BC

Irrigation and drainage make it possible to develop cultivated land, as we have seen. In addition, the transport of bulk matter (especially grains) relies mainly on canals. Therefore it is typical to find dense networks of irrigation canals branching out from main transport canals during the major kingdoms. The following text of Sima Qian gives us an idea of the scale:

“Sometimes later (up to this point the text speaks of the works of Yu the Great) the Hong Canal was constructed, leading off from the lower reaches of the Yellow River at Xingyang, passing through the states of Song, Zheng, Chen, Cai, Cao, and Wey, and joining up with the Ji, Ru, Huai, and Si rivers. In Chu two canals were built, one in the west from the Han River through the plains of Yunneng, and one in the east to connect the Yangzhe and Huai rivers. In Wu a canal was dug to connect the three mouths of the Yangzhe and the Five Lakes, and in Qi one between the Zi and Ji rivers. (…)

“All of these canals were navigable by boat, and whenever there was an overflow of water it was used for irrigation purposes, so that the people gained great benefit from them. In addition, there were literally millions of smaller canals which led off from the larger ones at numerous points along their courses and were employed to irrigate an increasingly large area of land…. u

Let us look more closely at one of these projects. The most impressive transport canal in this period is the Hong canal, or canal of the wild geese. This is in fact a sys­tem of canals linking the Yellow River, from a city called Xingyang (or Jungyang) near the present-day Kaifeng, to the Ji River that flows to the north of the Shandong moun­tains but whose origin is quite near, and to the tributaries of the north bank of the Huai river. The canal has two main branches (Figure 8.3). The north branch (or Bian canal), the one most used for transport, probably follows the course of the ancient Bian (or Pien) river, which rejoins the Si and the Huai. This is a watercourse some 900 km long, sure­ly artificial along a portion of its course. The south branch (the Langtanqu canal) links the Ying, Sui and Kuo rivers at their origins. It is some 400 km long, and constitutes a second fluvial passage between the Yellow River and the Huai,[395] through the Ying River which is navigable. The lengths of these canals are impressive, even though the origi­nally swampy terrain is practically flat between the Yellow River and the Huai. At the beginning, the Hong canal may have simply been a collection of irrigation canals for the north basin of the Huai.

The date of construction of the Hong canal is uncertain. As we have seen, when Sima Qian cites this canal as the very first in his list, he describes the regions linked by this pathway using names that refer to the period of springs and autumns. Moreover, Joseph Needham indicates that the Hong canal is mentioned around 330 BC in the account of a diplomat in his discussions of the boundaries between states. So, should we follow those who suppose that the canal dates from the 6th or 5th century BC? The con­struction of a work of such scale implies a strong central power and an economic moti­vation for exchanges between the basins of the two rivers. The coexistence of these fac­tors would seem problematic in the troubled period from the 5th to the 3rd centuries BC.

The Hong canal is destined to be well maintained, and remains in use in its original course up until 600 AD. Another important project in Sima Qian’s list is the Han canal, linking the Huai and the Yangtze. The king of the southern state of Wu has it built in 486 BC to supply his troops who were on a campaign against his northern neighbors.

Evaluation Factors

Evaluation factors that can be used on selected conceptual wall designs include the following:

• Constructibility

• Maintenance

• Schedule

• Aesthetics (appearance)

• Environment

• Durability or proven experience

• Available standard designs

• Cost

The sum of all weight factors should be 100 points. To simplify the selection process, minor factor(s) may be removed from the rating matrix. This is readily achieved by assigning the same score for minor factors on all the selected feasible wall types.

8.1.1 Notes on Using the Worksheets (Figs. 8.2, 8.3, and 8.4)

1. Factors that can be evaluated in percentage of wall height

A. Base dimension of spread footing

B. Embedded depth of wall element into firm ground

FIGURE 8.5 Requirements for wall cost study. (From Bridge Design Manual,

Section 5, Colorado Department of Transportation, Denver, Colo., with permission)

2. Factors that can be described as “large (high),” “medium (average),” or “small (low)”

A. Quantitative measurement

(1) Amount of excavation behind wall

(2) Required working space during construction

(3) Quantity of backfill material

(4) Effort of compaction and control

(5) Length of construction time

(6) Cost of maintenance

(7) Cost of increasing durability

(8) Labor usage

(9) Lateral movement of retained soil

B. Sensitive measurement

(1) Bearing capacity

(2) Differential settlement

3. Factors that can be appraised with “yes,” “no,” or “question” (insufficient information)

A. Front face battering

B. Trapezoidal wall back

C. Using marginal backfill material

D. Unstable slope

E. High water table or seepage

F. Facing as load-carrying element

G. Active (minimal) lateral earth pressure condition

H. Construction-dependent loads

I. Project scale

J. Noise or water pollution

K. Available standard designs

L. Facing cost

M. Durability

4. Factors that can be approximated from recorded height

A. Maximum wall height

B. Economical wall height

WORKING WITH MDF

If you want a cost-effective, easily worked material for plain-profile trim, MDF (medium-density fiberboard) is hard to beat. And you can add visual interest by installing cove, bullnose, quarter – round or other simple molding along MDF’s plain edges.

Advantages. MDF cuts and shapes beautifully. For smooth edge cuts, use a 60-tooth 10-in. blade. Because it has no grain, MDF crosscuts and rips equally well, and its edges can be routed as well, although most MDF trim is simply butt joined. (No need for biscuits to hold the joints closed.) Use a pneumatic nailer to attach it; MDF won’t split. Sand it with 150-grit sandpaper and prime with an oil-based primer (latex roughens the surface). However, MDF does have quirks you need to work around.

Disadvantages. MDF is heavy (a 14-in. sheet weighs about 100 lb.); lighter versions cost more. It’s dusty to cut and shape. As noted in the tip above right, its edges suck moisture. In fact, MDF can swell from ambient moisture, so seal it imme­diately after cutting or shaping it. Seal the edges with two coats of shellac-based primer. Then
paint all six sides of the panels with an oil-based primer. Perhaps MDF’s most annoying quirk is its tendency to mushroom around nail heads: MDF is so dense that it doesn’t compress when you nail it; fiber near the nail just bulges up. After set­ting the nail heads, use a Sandvik carbide scraper to scrape down bumps, and then prime it.

Because of MDF’s tendency to wick moisture, it’s a poor choice for bathroom trim or window installations where condensation is common— no matter how well it’s sealed. In those locations, go with wood instead.

POLYMER MOLDINGS

Though many old-house owners prefer wood molding, its supply and quality have been dwin­dling for decades, leading to a run on third-world forests—now being cut down at an alarming rate. Whereas polymer moldings (especially polyurethane) are available in most traditional architectural styles, from simple colonial to elaborate Victorian.

Once installed and painted, polymer moldings are virtually indistinguishable from wood trim. The following sections note some of the unique features.

Stability. Unlike wood, polymer molding won’t warp, split, rot, or get eaten by termites.

Although it does expand slightly (3з8 in. for a 12-ft. piece) in a heated room, special corner pieces “float” over section ends, allowing them to slide freely as they expand. Polymer molding has no grain, so there is no built-in bias to twist one way or the other; there are no splits, cracks, or knots.

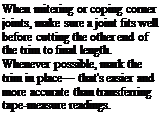
Подпись: PROTIP For odd-shaped or complicated pieces, such as winding stair treads, make a template using heavy paper, cardboard, or strips of Vs-in. plywood hot-glued together. "The Beauty of Templates," on p. 317, has more more about templates. 1111 Подпись: When mitering or coping corner joints, make sure a joint fits well before cutting the other end of the trim to final length. Whenever possible, mark the trim in place— that's easier and more accurate than transferring tape-measure readings.image846Quick installation. Synthetic moldings are less labor intensive. Whereas complex wood mold­ings are built up piece by piece and their joints painstakingly matched, synthetics come out of the box ready to install. Most polymer moldings are glued up with a compatible adhesive caulk, such as polyurethane or latex acrylic, and tacked up with finish nails or trim-head screws, which are needed for support only till the glue sets. Pieces are so light, in fact, that you can install them single-handedly.

Easy working and finishing. Most polymers can be trimmed like soft pine, using a 12-TPI (teeth per inch) to 13-TPI saw in a miter box. There’s no need for fancy joinery because most systems have corner pieces that cover joints. Touch up holes with plastic wood filler, and caulk field joints on long runs. You also may need a bead of caulk where straight lengths of molding meet existing surfaces that are irregular.

Polymer molding is typically primed white in the factory and could be installed as is, but most homeowners paint it. You paint smooth-surfaced urethanes just like standard wood trim. Some products can be stained, but that gets into the iffy territory of making plastic look like wood.

Basic Skills

Using quality tools and materials matters but not as much as the skill and judgment of the renova­tor. This section of tips will help hone your skills in measuring, cutting, and attaching trim.

MEASURING

Accurate measurements are crucial because trim is pricey, and even small discrepancies will stand out. In the following paragraphs you’ll find a few new twists on the old chestnut "Measure twice and cut once.”

Use a sharp point to mark stock. A stubby lumberyard pencil is fine for marking framing lumber. But because the margin of error is small on trim, use a sharp pencil to mark precisely. A utility knife leaves an even thinner line, though it’s more difficult to see.

Mark trim in place, if possible. It’s almost always more accurate than taking a tape reading and transferring it to stock, especially if your memory’s bad.

Change directions. If you normally measure left to right, double-check your figures by changing direction and measuring right to left.

Use templates instead of remeasuring. When you need to cut many pieces the same length, carefully cut one, check it in position to make sure it’s accurate, and use that piece to mark the cutline on others. You can also clamp a template to a bench or saw table, to act as a stop block. As you cut successive pieces, simply butt a square – cut end against the block, and the blade will cut each in exactly the same place.

When in doubt, go long. If you’re not quite sure of the exact measurement and don’t want to climb back up the ladder to recheck, cut the piece a lit­tle long. You can always make a long board shorter, but reversing the process is quite a trick.

Xmarks the scrap. As you mark cut-lines, pen­cil a prominent X on the scrap ends of boards. This habit will sooner or later help you avoid wasting trim because you mistook the scrap end for the measured end.

Mitigating Pollution from Roads

The level of pollution originating form roads depends on several factors that can also have an influence on pollution mitigation and prevention. These factors can be divided into two general groups:

• natural factors that depend on the environmental characteristics of the road’s surroundings; and

• technical factors that are connected with road design, construction and traffic characteristics.

Together with air, water is the main transport media for pollution dispersal from roads to the environment. Water is a very efficient solvent and, during its path through the road construction and surrounding environment, it dissolves and trans­ports many pollutants – some of them in large quantities and over long distances. Pollutants are transported in water by the mechanisms described in Chapter 6 with solution and suspension of solids being important. Preventing pollution impacts through technical measures represents a considerable challenge to planners, design­ers and operators of roads.

Road construction is an activity that very directly affects the hydrologic and geo­environment. Due to their linear nature, roads characteristically divide the hydro­logic and geo-environment into two or more parts. The degree to which these parts are separated from one another depends on

• the road category;

• the road’s topography related to the surrounding area;

• the kind and density of traffic; and

• the existence of connecting structures between the two sides of the road (hy­draulic or for biota).

The influences of road operation on water bodies may be classified as direct and indirect. Direct influences include water pollution that can be treated by various treatment methods. Also, the road construction may disrupt sub-surface and/or surface water flow paths. Most of these direct influences are measurable if one is prepared to monitor the impact of the road. Indirect influences are not usually de­tectable at first sight being mainly connected with activities that are induced by the road operation – for example, new industrial zones development or new residential areas. Ultimately, these consequences can be more severe than direct pollution of water body from road run-off. Nevertheless, we are addressing only the former, the hydrological impact of new developments being far beyond the scope of this book.

During planning, construction, operation and maintenance of roads, protection and mitigation measures for the water environment play an important role. These activities have to be established on the basis of conceptual models that enable the proper implementation of the appropriate technical measures. Natural conditions such as sensitivity and vulnerability of water bodies are among the most important influences to be considered by these conceptual models.

Various constraints can influence the selection of procedures to mitigate the threat of pollution from roads and traffic to many of the environmental compartments. For example, water bodies are very important as they represent an important habitat, may provide a water resource for public water supply and last, but not least, wa­ter is one of the most important transport agents for spreading pollutants. These constraints are the consequence of natural site characteristics, usually defined as the sensitivity and vulnerability of water bodies, they depend on geotechnical and hydro-technical conditions in the environment and on road traffic characteristics, es­pecially the share of heavy vehicles in the total daily traffic flow. Legislation is another important constraint to pollution mitigation. To protect the environment as much as possible, there is an increasing trend for laws and other legal instruments to impose upon planners, designers, operators and users of roads many obligations that should be carefully studied and implemented. The knowledge of all constraints can help establish proper criteria for preventing and mitigating harm from road pollution.

In the past extensive monitoring of road infrastructure and its influence on various environmental compartments has been performed. Among other results of monitor­ing that have been extensively reported are those affecting the hydro – and hydro-geo­logical environment (e. g. Hamilton & Harrison, 1991; Bruen et al., 2006). The most profound and known effects of roads on the water environment, especially in north­ern European countries, are the influences of winter maintenance practice where salts and some other agents are used as de-icing agents (Amrhein et al., 1992; Oberg et al., 1991). Also reported are the influences of heavy metal contamination on soil micro-structure and, consequently, on the physical and chemical conditions of soils and water percolated through the unsaturated zone in the groundwater (Folkeson 2000). Literature reports on oil spills on Slovene karstic areas reveal that spilt oil sinks very fast into the karstified underground and very soon appears in springs used for water supply (Kogovsek, 1995 & 2007).

Some case studies recording the impact of alternative road construction materi­als on groundwater are reported in the literature. As an example of this, a road was constructed on a new alignment in Cumbria, Lake District, UK in 1975 over a some­what acidic bog. Soft marshy material was removed and the area was back-filled with approximately 300,000 tones of Blast Furnace Slag from iron production. The slag was also used below the water table. The slag material contained large quantities of calcium sulphide. Soon after construction, sulphur related pollution began to be observed in surrounding water courses, apparently as a consequence of groundwater seepages from the construction. Sulphide has a directly toxic effect on many life forms but its oxidation to sulphate can be a more serious problem as this can cause severe oxygen depletion, effectively asphyxiating many life-forms within the affected water bodies. In winter the problem was not so severe since there was plenty of water in the local receiving streams to enable dilution to occur. However, as groundwater continued to flow into receiving streams whose flow rates had decreased during the summer, and as water temperature increased, excessive algal blooms occurred. After construction was finished, the records indicate that samples of water discharging from drains from the roadway were found to be con­taminated with sulphides and hydrogen sulphide. Biological and fisheries investi­gations showed that there was a marked impact on the invertebrate fauna and fish populations in the two streams receiving the drainage from the new road (Taylor, 2004).

Many alternative materials are often mentioned by reference to their leaching potential as a potential risk regarding the pollution of surface and groundwater. However, this risk must also be considered regarding some natural materials. Acid drainage is one of the phenomena that can appear in some natural materials. As an example we can refer to the construction of a capping layer consist of hornfels metamorphic rock aggregates that resulted in percolating waters with a pH between 3 and 4 (Odie, 2003). From the construction phase fish-kill was observed in the neighbourhood of the road. Such an acidification was induced by the oxidation of solid and dissolved pyrite (FeS2) originally present in the aggregate, and resulted in the production of H2 SO4 and Fe(OH)3. The presence of the latter at the outlet of the drain was testified by a dense orange colour.