HIGH MAST LIGHTING

The value of high mast lighting has been highly controversial since its introduction in the early 1960s. Proponents suggested that high mast lighting offered considerable enhancements to visibility. Opponents, on the other hand, argued that high mast lighting was expensive to build, offered little improvement to visibility, and often resulted in light trespass and light pollution. By the early 1980s, new data became available which suggested the superiority of high mast light over conventional systems. The reasons cited were

• An improved visual field negating the “tunnel effect” caused by a limited lateral dimension when using conventional mounting heights. The tunnel effect prevents the driver’s eyes from reaching a reasonable level of retinal stability—a failure believed by some to be the cause of a substantial number of accidents at night [12].

• Improved luminance uniformity within the principal visual field. The uniformity eliminates the need for the eye to adapt to a wide range of luminances, which adversely affects visual acuity. Many experienced engineers are of the opinion that luminance can be reduced when using high mast lighting because of the compensating factors of improved uniformity and reduced veiling glare.

• Disability veiling brightness negatively affects a driver’s visual performance. In practice, luminaires spaced at long distances require large light sources with high beam intensity in the upper angles of the vertical plane. Light emitted from a lumi­naire above 75° can be considered a contributor to glare. High mast luminaires con­fine their distribution within the limits of 60° to 65° and practically eliminate the disability veiling brightness. Brightness from high mast systems is also reduced through geometric arrangement. Increased mounting height and greater offset remove the luminaires from the driver’s active viewing area [12].

• The location of the high mast pole contributes to a clear roadside and results in a reduction in the number of vehicular collisions with fixed objects [12].

• Studies done using the older mercury vapor light sources indicated that on both dia­mond and cloverleaf type interchanges, high mast lighting systems utilized fewer luminaires and less energy than conventional lighting [12].

• There is a growing emphasis across the nation to eliminate or control “obtrusive light.” Keeping this in mind, a designer might want to consider using some of the more newly designed, full-cutoff, high mast luminaires that have been found acceptable and to be aware of keeping the mounting heights as low as feasible for a given situation.

The growth in vehicular traffic combined with the continuous search by transportation authorities for safer and more cost-effective roadway design has resulted in a shift toward multilane roadways. The new freeway designs cannot be effectively illuminated by conven­tional methods using low mounting heights and light sources of limited lumen output. Because of these requirements, high mast systems offer a distinct advantage over alternative systems. High mast systems also offer advantages in cases where future road widening is expected. The poles can be located 50 ft (15 m) or more from the traffic lanes, enabling future road widening without the need for changes in the lighting system [12]. Figure 7.66 shows a typical lighting design.

Joes Rocket Research Landing Pad – A Photo Essay

Joe Zinni, like Larry Schuth and Mark Powers, is a former cordwood masonry student at Earthwood. He and his wife Glenna found a 1.25-acre piece building lot they liked in Tenino, Washington, an area where local sawmills are cutting lots of very large timbers. Joe described a friend’s sawmill to me: “Rob, picture a giant Wood Mizer mill, except with a band saw blade eight inches wide and a quarter inch thick, and a throat about six feet across. You wouldn’t believe the size of the timbers they run through there.” In a letter, Joe listed some timbers he has lying around. One is a 16- by 32-inch by 40-foot (40.6- by 81.3-centimeter by 12.2- meter) beam. Another is 13- by 40-inch by 36-feet long. He’s got a half dozen beams measuring 12- by 26-inches by 40 feet. The mind boggles. I have megalithic fantasy dreams about the structures I could design around these behemoths.

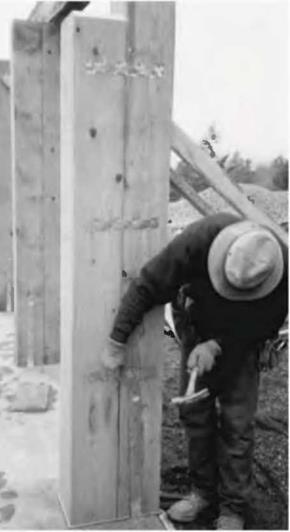
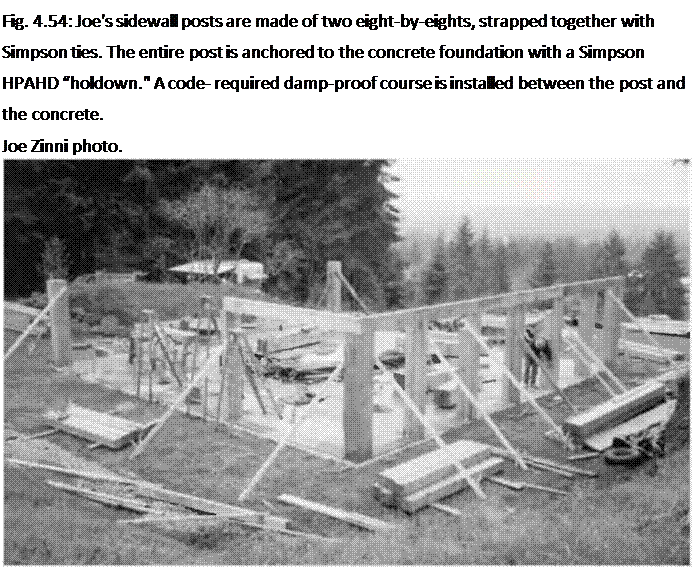
His own house is 40 feet (12.2 meters) square and framed with large timbers: twelve-by-twelve corner posts, eight-by-sixteen sidewall posts (built up from two eight-by-eights strapped to each other, side by side), a double course of six-by­twelves as girts above the posts, and two rows of eight-by-sixteen girders running through the house to shorten ceiling joist spans. The joists themselves are six-by – twelves, and they support two-by-six tongue-in-groove planking. Once the deck was on, the place had become somewhat of a local legend, like a Neolithic “Woodhenge.” As “Woodhenge” probably wouldn’t mean a lot to locals, Joe put up a sign outside the project which all could understand: Joe’s Rocket Research Landing Pad.

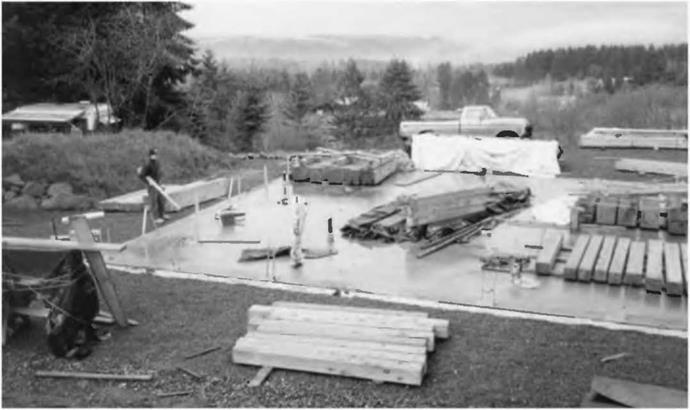
Because of high earthquake potential, the building codes in Joe’s area insist on a strong foundation-to-roof tie system. Joe used off the-shelf Simpson strap ties, and, in exposed areas, heavy angle-iron brackets. His fine pictures (Figs. 4.53—4.62) tell the story.

image96

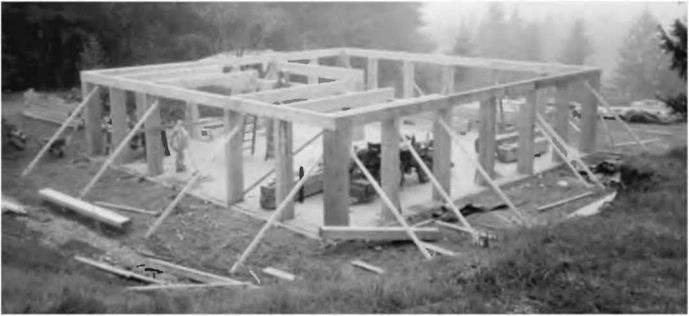
Fig. 4.55: Corner posts are full – sized 16- by 16-inch (40.6- by 40.6-centimeter) timbers. Girts connecting the tops of the posts are six-by-twelves. Joe joined the girts at the corners with 45-degree miter cuts, a nice detail. Each post is well-staked to the ground, and the top girt is eyeballed straight.

Joe Zinni photo.

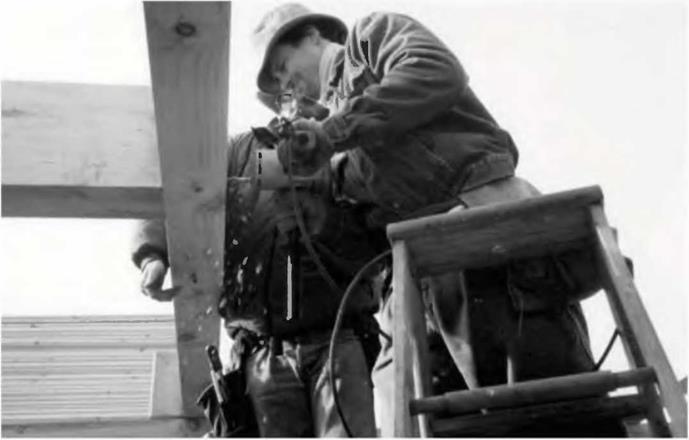
Подпись: Fig. 4.53: JoeZinni's floating slab for his 40- by 40-foot (12.2- by 12.2-meter) cordwood- and- timber-frame home. Dozens of heavy timbers are stacked off the ground on wooden stickers. Joe Zinni photo. image97Подпись: Fig. 4.54: Joe's sidewall posts are made of two eight-by-eights, strapped together with Simpson ties. The entire post is anchored to the concrete foundation with a Simpson HPAHD “holdown." A code- required damp-proof course is installed between the post and the concrete. Joe Zinni photo.

Fig. 4.56: joe Zinni fastens one six- by-twelve timber to another with two large lag screws, joe Zinni photo.


Fig. 4.57: The basic post and beam frame is almost completed.

Joe Zinni photo.


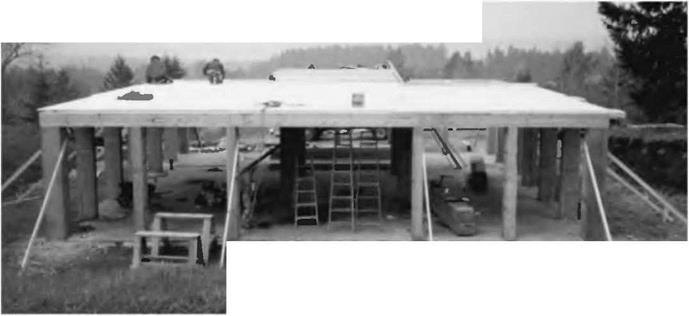
Fig. 4.58. joe’s Rocket Research Landing Pad is ready for a rocket to land. The plank roof will receive the roof trusses, joe Zinni photo.


image99image100image101

image102

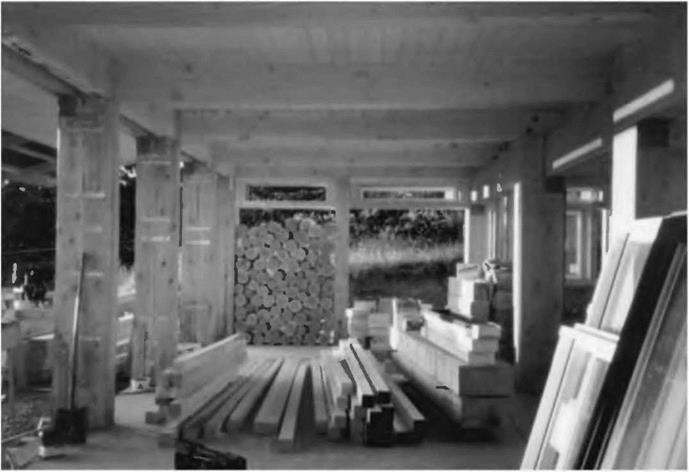
Fig. 4.61: Interior, during construction. Doubled eight-by- eight posts on left. Solid 16-by-16 posts on right. Doubled six-by­twelve girts on left. Single six-by­twelve girders on right. Six-by­twelve ceiling joists support the plank roof. This entire heavy-duty flat "landing pad" supports a truss system for the metal roofing.

Joe Zinni photo.

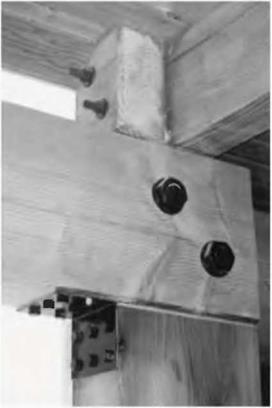
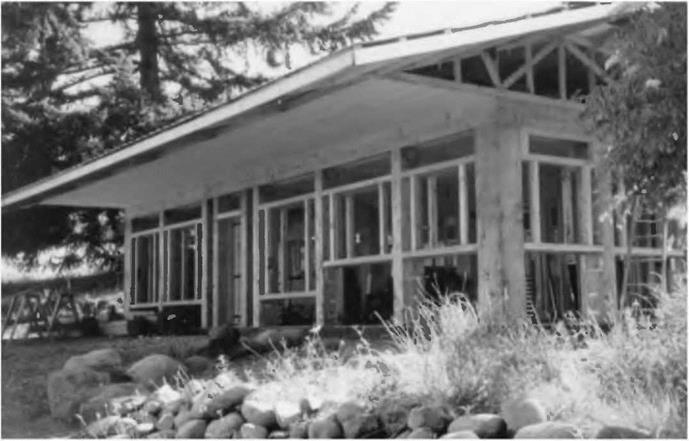
Подпись: Fig. 4.59: The roof trusses have a Ю-foot (3-meter) cantilevered overhang on the west side, providing a large sheltered space in this very wet climate. There is a 5-foot (1.5-meter) cantilevered overhang on the east side, and the trusses are laddered out for a four- foot overhang on the north and south sides. Joe Zinni photo.image103Подпись: Fig. 4.60: Interior detail. Two six-by-twelve girders join over a post, and are bolted together. The heavy metal right-angle connector ties the girders to the post. All exposed metal is enameled black. Ceiling joists are supported by the girders and are joined together by going by each other over the girder, and then fastened together with one- half-inch bolts. Joe Zinni photo.image104

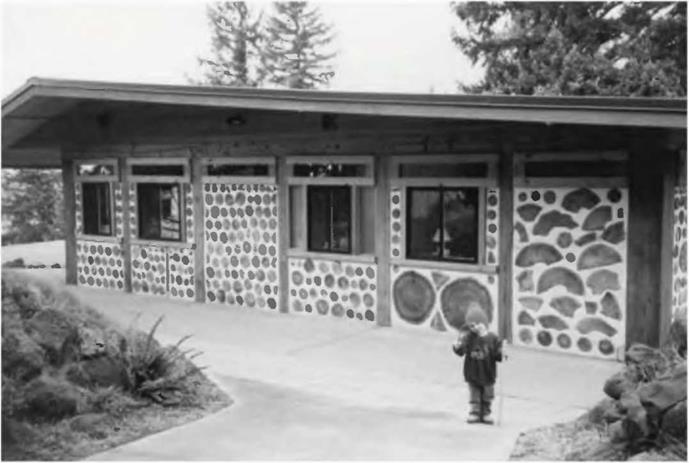
image105Fig. 4.62: The Zinni’s completed home, with cordwood infilling.

The trusses hove two different pitches on their top chords. Young Sage Zinni looks like a leprechaun next to this massive structure.

Joe Zinni photo.

Parallel systems

For a parallel system, the entire system would perform satisfactorily if any one or more of its components or modes of operation is functioning satisfactorily; the entire system would fail only if all its components or modes of operation fail.

In the framework of load-resistance interference for different modes of oper­ation, the failure probability of a parallel system, according to Eq. (7.9), is

Parallel systems

M

П (Wm < 0)

m=1


Pf, sys = P


P


П (Zm < m=1


вт)


Ф(-в I Rz)


(7.43)


Parallel systems

which can be computed as the multivariate normal probability discussed in Sec. 2.7.2. The bounds for system failure probability also can be computed if the exact value of Pf, sys is not required. In the case that all performance variables W’s are independent, the system failure probability reduces to

M

Pf, sys = П ®(-Pm) (7.44)

m=1

Подпись: ps,sys — P Подпись: M U (Wm m—1 Подпись: > 0) Подпись: P Подпись: M U (Zm > -Pm) m—1 Подпись: (7.45)

Alternatively, the reliability of a parallel system can be expressed as

Подпись: ps,sys Parallel systems Подпись: (7.46)

The second-order bounds for this system reliability, according to Eq. (7.27), are

in which L( jij, em 1 pjm) — P [Zj > ej, Zm > em — Ф( ej, em 1 pjm) +

Ф(в j) + Ф^)-!.

Example 7.8 Referring to Example 7.6, determine the system reliability by consid­ering that the system would fail if all three modes of operation fail.

Solution Since the system is in parallel, the system failure probability can be calculated as

Pf, sys — P(Wi < 0, W2 < 0, W3 < 0)

— P(Z1 < -2.68, Z2 < -3.46, Z3 < -2.68) — 0.0001556

which is obtained in Example 7.6. Hence the reliability of the system is 0.9998444.

In the framework of time-to-failure analysis, the unreliability of a parallel system involving M independent components can be computed as

M

Подпись:pf, sys(t) — ^ pf, m(t)

m—1

in which pf, m(t) — P(Tm < t), the unreliability of the mth component within the specified time interval (0, t]. Hence the system reliability in time interval (0, t] is

M

Ps, sys(t) = 1 – Pf, sys(t) = 1 – П Pf, m(t) (7.48)

m=l

Подпись: and Parallel systems Parallel systems

The failure density function f sys(t) and failure rate hsys(t) for a parallel system consisting of M independent components are

For each component having an exponential failure density function with the parameter Xm, for m — 1,2,…, M, the failure probability of a parallel system can be computed as

M

Pf ,sys(t) — П (1 – e~lmt) (7.51)

m—1

with the corresponding system reliability

M

Ps, sys(t) — 1 – П (1 – e-lmt) (7.52)

m—1

Подпись: M f sys(t) — m—1 Подпись: M Ц(1 - e-jt) j —m Подпись: Xm e Подпись: Xm* Подпись: (7.53)

The system failure density function f sys(t) is

Parallel systems Подпись: (7.54)

In the case that all components have an identical failure rate, that is, X1 — X2 — ■ ■ — XM — X, the MTTF of the system is

The unavailability of a parallel system involving M independent compo­nents is

M

Usys(t) —Ц Um(t) (7.55a)

m—1

and the corresponding system availability is

M

Asys(t) = 1 – Ц Um(t) (7.55b)

m=1

Parallel systems Подпись: (1 - e Подпись: ) Подпись: (7.56)

Under the condition of independent exponential repair functions for the M components, the unavailability of a parallel system is

Parallel systems Parallel systems Подпись: MTTRm MTTRm + MTTFm Подпись: (7.57)

and the stationary system unavailability is

Example 7.9 As an example of a parallel system, consider a pumping station con­sisting of two identical pumps operating in a redundant configuration so that either pump could fail, and the peak discharge could still be delivered. Both pumps have a failure rate of k = 0.0005 failures/h, and both pumps start operating at t = 0. The system reliability for a mission time of t = 1000 h, according to Eq. (7.52), is

Подпись:

Подпись: 15 = 1.5 k
Подпись: = 3000 h

ps, sys(t = 1000) = 1 – (1 – e-(0 0005>(1000>)(1 – e-(0-0005)(1000)) = 0.8452 The MTTF, according to Eq. (7.53), is

Laying Out a Tub Back Wall

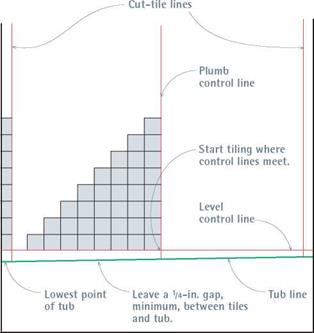
image823Almost all tubs slope slightly, so use a spirit level to locate the lowest point. From that lowest point, measure up the height of one tile, plus ‘I in., and mark the wall. Draw a level control line through that mark, as shown in the illustration at right, and extend that level line to all three tub walls. Use a story pole to see if you’ll need to cut tiles. If so, lay out tiles so cuts are symmetrical on both ends of the back wall. Draw a plumb line on each end of the wall to indicate where the cut tiles will begin. Finally, through a tile joint along the level control line, draw a plumb control line that roughly bisects the backwall. Start tiling where control lines meet.

TILING A TUB SURROUND

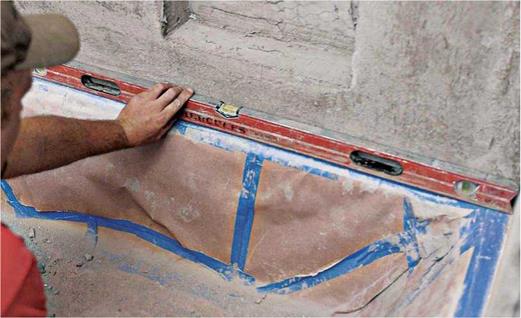
1. After checking tub walls for plumb, use a spirit level to check whether the tub is level along all three sides. If the tub slopes, note the lowest point.


image824

image825image826

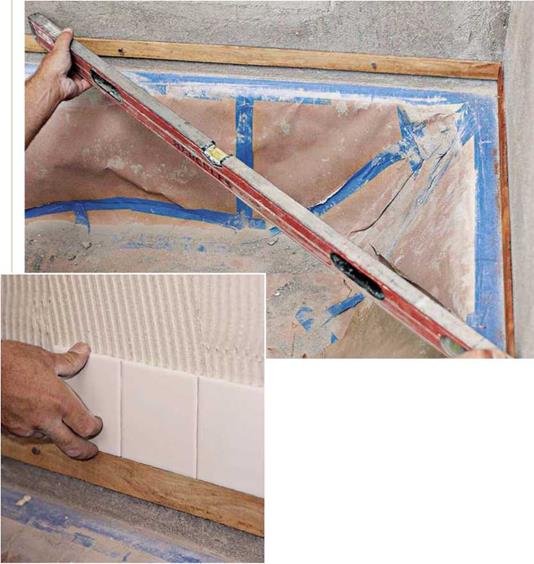
3. The first course of full, uncut tiles should rest on the wooden strips. After you’ve installed tiles on all three walls and the setting-bed has hardened, remove the wood strips and install cut tiles below.

(Steps continue on next page.)
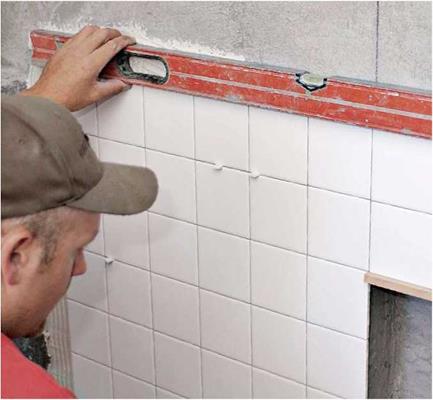
2. At the lowest point of the tub shoulder, measure up one tiling unit (tile width plus one grout-joint width) and mark that onto the wall. Through that mark, draw a level line that extends to all three walls of the surround. Next, nail narrow wooden strips to the underside of that line, as shown.

About the same time you’re sponge-wiping the tile, use a margin trowel or a utility knife to remove grout from the expansion joints and from the ‘/.-in. gap where tile meets the tub. Allow a day for the grout to cure; then seal these gaps with an acrylic or silicone caulk. Tile suppliers sell caulk that’s either sandless or sanded, and color matched to your grout.

image827llll

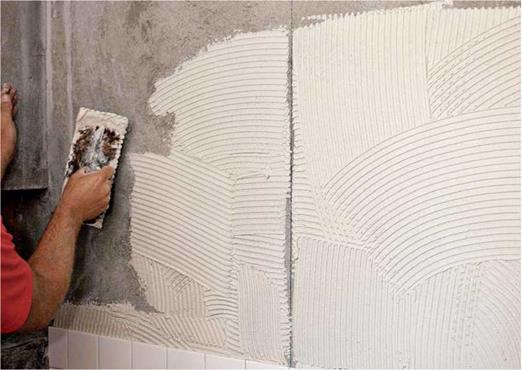
4. typically, tilesetters mark a vertical line to bisect the long, sidewall of a tub. As you trowel on thinset, try not to obscure the line with adhesive. Although this pro is setting a whole wall without interruption, most mortals should set tile a half or quarter wall at a time.

5.

image829
image828

Periodically check to see if tile courses are level, inserting plastic shims as needed. Leave them in place until the thinset cures. Note: Because walls aren’t perfectly regular, you’ll often need to use spacers as well as shims. Spacers are uniformly thick; shims are tapered.

TYPES OF LUMINAIRES

Conventional roadway lighting has been the cobra head luminaire mounted on a support arm and positioned at the edge of the roadway or, in some cases, out over the roadway. The base of the pole when a breakaway device is present should be a minimum of 15 ft (4570 mm) from the travelway, but 20 ft (6100 mm) is preferred on roadway sections with­out a curb. The travelway is defined as being a continuous traffic lane and does not include an acceleration or deceleration lane merging with a through lane. When a curb is present, the pole with its breakaway device is preferred to be 10 ft (3050 mm) from the face of the curb. If this is not possible, the pole should be closer than 2 ft (610 mm). This will ensure that an impacting vehicle strikes the pole at the designed impact height for proper break­away operation. Breakaway devices should not be used on any pole located where pedestrians are likely to be present, because of the danger to them if the pole falls.

Cobra head luminaires are available in a wide range of full cutoff, semicutoff, and noncutoff beam patterns. All cobra head luminaires have a horizontal lamp position that causes them to produce a large amount of light directly under the luminaire. This requires the designer to closely inspect the calculated average to minimum light level ratios to ensure compliance with values given in the illuminance tables.

Other luminaires that can be used in the same locations as cobra heads utilize a vertical lamp position. These produce a more uniform light pattern, since a smaller portion of their lumens are directed straight down, thus providing a more uniform light level. These luminaires are not available in cutoff types. The two major manufac­turers of this vertical lamp luminaire are Holophane and McGraw-Edison.

High mast luminaires are designed to be mounted on the lowering ring of a high mast pole. High mast luminaires are produced primarily in 400- and 1000-W sizes in a wide variety of beam patterns. New lamps are being developed that have lumen to watt ratios equal to or better than the 1000-W that do not demonstrate the same fragile tendencies [11]. Manufacturers use different designations for their own luminaires, but generally type 2 and type 5 beam patterns are most popular. The beam patterns are also referred to as long and narrow, and symmetrical and nonsymmetrical. Cutoff and

CLASSOTCATION

FACTOR

RATING

UNLIT

WEIGHT

(A)

LIGHTED

WB1GHT

ffl)

DJFF.

(A-B)

SCORE [RATING X (A-B)]

1

г

I

4

5

GEOMETRIC FACTORS

No. of Lories

4 or less

1.0

0.8

0.2

> 3.6

3.6

3.3

з sa

<3.0

3.0

2.5

0.5

Median Openings per Mile

<4,0 or one-

4.0-0.0

8.1-12.0

12.0-15.0

>15.0 or no access control

5.0

3.0

2.0

Curb Cuts

< 107.

10*202.

20-30%

30-40%

>40%

5.0

3.0

2.0

Curves

<3.0-

3.1-6.01

6.1-8.0′

8.1-10.0“

>10*

13.0

5.0

8.0

Grades

< 3%

3.0-3,32.

4.0-4.97.

5.0-6.37.

7% or more

3.2

2.8

0.4

Sight Distances M

>215

150-215

30-150

60-30

<60

2.0

1.8

0.2

Parking

Prohibited both sides

L”d£,V°""

Off-peak

Permitted both sides

0.2

0.1

0.1

OPERATIONAL FACTORS

GEOMETRIC TOTAL

Signals

All major

Substantial majority of

intersections

signalled

About half the intersections

Frequent

"-signalized

3.0

2.8

0.2

Left Turn Lone

AU major

or one-way operation

Substantial

*et£rrtVf

Meet major

About half the^ major

Eh*"

5.0

4.0

1.0

Median Width (m)

A

6-3

3-6

0-L2

0-1,2

0.5

0.5

Operating Speed

40 or less

50

55

65

70 or greater

1.0

0.2

0,8

Pedestrian Traffic

Very fa«

0-50

50-100

100-200

> 200

1.5

0.5

1.0

ENVIRONMENTAL

FACTORS

OPERATIONAL TOTAL

% Development

0

0-302

30-60%

60-30%

100%

0,5

0.3

0.2

backup design

Residential

Half

residential &/

Industrial or oommeroial

Strip

industrial or commercial

0.5

0.3

Setback Distance (m)

> 60

45-60

30-45

15-30

< 15

0.5

0.3

0.2

Advertising or

0-40%

40-60%

60*80%

Essentially

3.0

1.0

2.0

Raised-Curb Median

None

Continuous

At all

At all signalized

A few

1.0

0.5

0.5

Crime Rata

Extremely

low

city overage

City average

Higher than oity average

Extremely

1.0

0.5

0.5

ACCIDENTS

ENVIRONMENTAL TOTAL

Ratio of Night – to-Doy Accident

< 1.0

1.0-1.Z

1.2-1.5

1.5*2.0

2.0*

10.0

2.0

8.0

•Continuous Lighting Warranted

GEOMETRIC TOTAL =

ACCIDENT TOTAL

OPERATIONAL TOTAL =

ENVIRONMENTAL TOTAL =

ACCIDENT TOTAL –

SUM = POINTS

WARRANTING CONDITION * 85 POINTS

FIGURE 7.61 Evaluation form for non-controlled-access facility lighting.

noncutoff types are used, although not all beam patterns are made in each category. The designer must be concerned with light trespass when using high mast luminaires and should locate them so as not to interfere with adjacent property usage. A tech­nique used by some designers, when high mast poles cannot be located in the middle of the area to be lighted, is to specify an offset-type luminaire mounted on the high

CLASSIFICATION

FACTOR

RATING

UNLIT

WEIGHT

(A)

LIGHTED

WEIGHT

(B>

DIFF.

(A-B)

SCORB [RATING X (A-B)]

1

2

3

4

5

GEOMETRIC FACTORS

Number of Legs

3

5

6 or more

troff. c"9

circles)

3.0

2,5

0.5

Approach Lane Width

>3,6

3.6

3.3

3.0

<3.0

3.0

2.5

0.5

Ch™h-“"

Left turn lanes on mejor legs

Left turn lanes right turn lenos

Left end right turn lanes on

major lags

Left and right alllegT” °П

2.0

1.0

1.0

Approach Sight

Distance

>215

150-215

40-150

60-40

<60

2.0

1.8

0.2

Grades on Approach Streets

< 32

3.0-3,’42

4,0-4.47

5.0-6.42

72 or more

3.2

2.6

0.4

Curvature on Approach

< 3.0‘

3.0′-6.0‘

6.Г-8.0’

8.Г-10.0-

> 10′

13.0

5.0

6.0

Parking in Facility

Prohibited

Loading zones

only

Off-peak only

Permitted

Permi ttad

0.2

0.1

0.1

GEOMETRIC TOTAL

Operating Speed on Approach Legs (km/h)

40

or lass

50

55

65

70

1.0

0.2

e. a

Type of Control

All phases signalized (incl. turn lane)

Left turn lane signal control

Through-traffic signal control

only

4-шау

stop control

Stop control on minor legs or no control

3,0

2.7

0.3

Channelization

Left end right signal central

Left and right «gnel Control

on major leqs

Left turn lane on ell legs

an major legs

No turn lone

3.0

2.0

i.0

Level of Service (Load Factor)

0.0

В

0-0.1

C

0,1-0,3

D

0.3-0,7

£

0.7-1.0

1.0

0.2

0.8

Pedestrian Volume ipads/h)

Vary few

0-50

50-100

100-200

> 200

1.5

0.S

1.0

ENVIRONMENTAL

OPERATIONAL TOTAL

Percent Adjacent Development

0

0-3 0V.

30-607

60-407

1002

0.5

0.3

0.2

Predominant

Development near

Undeveloped

Residential

507 residential 507 industrial or commercial

Industriol or

Strip industrial

0.5

0.3

0.2

Lighting in ImmedlOte Vicinitg

0-407.

40-607

60-402

1002

3.0

1.5

1.5

Crime Rote

Extremely

C! ty average

Highor than city ever age

Extremely high

1.0

0.5

0.5

ACCIDENTS

ENV1R0MENTAL TOTAL

Ratio of Night – to-Doy Accident Rates

1.0

1.0-1.2

1.2-1.5

1.5-2.0

2.0-

10.0

2.0

8.0

•intersection Lighting Warranted

GEOMETRIC TOTAL =

ACCIDENT TOTAL

OPERATIONAL TOTAL –

ENVIRONMENTAL TOTAL =

ACCIDENT TOTAL =

SUM = POINTS

WARRANTING CONDITION = 75 POINTS

CLASSIFICATION

FACTOR

RATING

UNLIT

WEIGHT

(A)

LIGHTED

WEIGHT

(Б)

DIFF.

(A-B)

SCORE [RATING X (A-Bl]

1

2

5

4

5

GEOMETRIC FACTORS

Number of Lanes

4

б

> 8

1.0

0.8

0,2

Len* Wtdth

>3.6

3,6

3.3

3,0

<2,75

3.0

2.5

0.5

Median Width (m>

>12

7-12

3.7-7.0

1.2-3.3

0

1.0

0.5

0.5

Shoulders

3.8

2.4

1.8

0.8

0

1.0

0.5

0,5

Slopes

2 8:1

6:1

4:1

3:1

2:1

1.0

0.5

0.5

Curves

0-1/2′

1/2-1*

1-2*

2-3‘

3-4*

13.0

5.0

8,0

c*"“’

< 32

3-3.82

4-4,42

5-6.82

> 72

3.2

2.8

0.4

oK. t".",9′

6.4 km

4.8 km

3.2 km

1.6 km

>1.6 km

4.0

1.0

3.0

GEOMETRIC TOTAL

Level of Service

«

В

C

0

Є

6.0

1.0

5.0

ENVIRONMENTAL

OPERATIONAL TOTAL

FACTORS

Z development

m

252

502

752

1002

3.5

0.5

3.0

Offset, to Development

би

45

30

15

<15

3.5

0.5

3.0

ACCtDENTS

ENVIRONMENTAL TOTAL

Ratio of Night – to-Ooy Accident Rates

1.0

1.0-1-2

t.2-1.5

1.5-2.0

2Я-

10.0

2.0

8.0

“Continuous Lighting Warranted

GEOMETRIC TOTAL =

ACCIDENT TOTAL

OPERATIONAL TOTAL –

ENVIRONMENTAL TOTAL =

ACCIDENT TOTAL =

SUM 5 POINTS

WARRANTING CONDITION = 35 POINTS

CLASSIFICATION

FACTOR

RATING

UNLIT

WEIGHT

(A)

LIGHTED

«EIGHT

(B> , IABI

SCORE [RATING X <A-B>]

1

2

J

4

5

GEOMETRIC FACTORS

n _ ‘ Direct Hemp lypes

Olafnond

cloverleaTs

Trumpet

i. T™.’"”

«

1.0

1.0

Classif ication

Continuous

intersections

2.0

1.0

1.0

frontage Roods

One-woy

Two-.ay

1.5

1,3

0.5

Freeway Lane Widths (ml

>3.6

3.6

3,3

3.0

<3.0

3.0

2.5

0.5

Frooway Median Widths

>1?

10-12

3,6-7.3

1.2-3.6

<1.2

1.0

0.5

0.5

Freeway Lories

4 or less

6

8 or more

1.0

0.8

0.2

Mam Lane Curves

< 1/2′

і-2′

2-3′

3-4-

>4-

13.0

5,0

0r=d"

3X

3-3,4/.

4-4.4X

5-6.4/

77. or more

3.2

2.8

0.4

Sight Distance Cross­road Intersection

>ЗЄ4

210-300

150-210

120-150

<120

2.0

1,8

0.2

GEOMETRIC TOTAL

Level of Service

»

8

C

0

E

6,0

1.0

5,0

ENVIRONMENTAL

FACTOR’S

OPERATIONAL TOTAL

X development

,,I“d

2,“”d

3„..d

2.0

0.5

1.5

Setback Distance

>60

45-60

30-45

15-30

<15

0,5

0.3

0.2

Crossroad

Partial

Complete

3,0

2.0

1,0

Freeway Lighting

None

Interchanges

only "

Continuous

5.0

3.0

2.0

ACCIDENTS

ENVIRONMENTAL TOTAL

Ratio of Night,- to-Dou Accident.

1,0-1.2

1.2-..5

1.5-2.0

> 2.0-

10.0

2.0

8.0

GEOMETRIC TOTAL =

OPERATIONAL TOTAL =

ENVIRONMENTAL TOTAL =

ACCIOENT TOTAL =

•Continuous Lighting War-or-ted

SUM = POINTS

ACCIOENT TOTAL

COMPLETE UGMTtNC

WARRANTING CONDITION = Я0 POINTS

PARTIAL LIGHTING

WARRANTING CONDITION = 60 POINTS

mast lowering ring in lieu of the “traditional” high mast luminaire. This produces a more directional pattern that can reduce the amount of off-premise light.

In addition to the cutoff type fixture, some manufacturers have coined the term “Dark Skies” for fixtures that have a photometric design that not only limits the hori­zontal beam spread, but also limits or completely eliminates any component of uplight from the fixture. Property owners are very concerned about light trespass where com­mercial developments are in close proximity to residential areas. Unwanted light can affect the value of a parcel of property for certain types of usage.

The use of light emitting diodes (LED’s) has created a new type of light fixture. These units are still in the early stages of development but a limited number of manu­facturers do market exterior fixtures using this new technology. The installation costs of LED fixtures are comparable to conventional fixtures but the initial cost of the fix­tures exceeds that of conventional high pressure sodium or metal halide fixtures. However, energy costs using the LED fixtures are much lower than conventional fix­tures. The photometrics of LED fixtures can be controlled to prevent both uplight and trespass on adjacent areas. As the production costs decrease and different styles become available, the use of this type of fixture will likely increase.

Avoiding light trespass is very important near airport runways. Glare from improp­erly placed fixtures or the use of fixtures with uplight components can be a distraction to pilots on final approach. The area around an airport also has height restrictions due to FAA requirements. The lighting designer must be diligent in researching these requirements and using lighting standards that do not exceed the limits. One method is to use offset fixtures at lower mounting heights to comply with height limitations. Most manufacturers also provide shields that prevent overspill of the light output. The use of fixtures referenced above as “Dark Skies” will also aid in meeting the design requirements for a particular location or area.

Offset luminaires are manufactured by several companies under names such as Vector, Turnpike, Multimount, and Interstate. These luminaires are specifically designed for roadway use and resemble a floodlight in appearance but not in beam pat­tern. The offset luminaires are intended to be mounted well away from the roadway edge and aimed at an approximate 45° angle. This design was originally conceived in the 1960s, and a test installation along I-55 south of Memphis was very satisfactory. The original design was large and difficult to handle, but perhaps the greatest handicap that prevented widespread use was the resistance among maintenance personnel due to the difficulty in getting to the pole location when servicing was required. From a safety aspect, the offset was, and still is, a very good choice, since it can be located well away from the travelway and the beam pattern allows a wide spacing between the poles. The development of an individual lowering device has increased the number of locations where the offset can be installed. The individual lowering device (ILD) provides each luminaire with its own lowering cable and latch assembly, as distinguished from the high mast lowering device, which has all luminaires mounted on the same ring and lowered together. The cost of the ILD is much less than that of the high mast device when one to eight luminaires are located on the pole. Four ILDs are the maximum number used on a single pole, but one or two per pole is most commonly used.

Segmented reflectors are special-purpose luminaires that have been successfully used on top of concrete median barriers. The top of concrete safety shape barriers can be as wide as 12 in (300 mm). This limits the anchor bolt spacing, for attaching a luminaire pole, at 6 in (150 mm) in order to provide a minimum of 3 in (75 mm) of concrete around each bolt. The resultant anchor bolt spacing places a height restriction on the pole due to the structural needs required to counteract the overturn moments. Two options are to increase the width of the concrete barrier at the luminaire post, as in Fig. 7.65, or to use segmented reflector luminaires, which require less height to pro­vide proper lighting for multiple lanes.

Two of the segmented reflector luminaires when mounted 40 ft (12 m) high can light up to six or eight lanes on each side of the barrier depending on the width of the inside shoulder. This luminaire was originally developed for use in parking decks and uses a vertically mounted lamp with only a small portion of its lumens directed straight down. Exceptional uniformity ratios and the cutoff pattern make these lumi­naires a good choice when veiling luminance (glare) and light trespass are concerns. Other types of luminaires are also used on top of median barriers. The cobra head is often used, and a traditional high mast luminaire has been found to be very effective in this application, although veiling luminance is a potential problem.

Poles mounted on top of median barriers have a number of advantages and disad­vantages. One advantage is cost, since one pole in the middle of the lighted area can replace two roadside luminaires, requiring only one set of circuit conductors and conduits. The disadvantages include problems of traffic and maintenance safety. Placing the poles on top of the concrete median increases the probability of a pole being struck and landing in the opposing traffic lanes, when compared with offset luminaire pole locations. Maintenance crews are required to work with bucket trucks on the inside shoulder, requiring the closure of the inside traffic lane. Experience of over 10 years with median barrier-mounted poles indicates that few poles are actually struck and the majority of strikes that do occur take place late at night when traffic levels are low. The poles that were struck did not become detached from the anchor bolts, since breakaway devices are not used on the barrier rail poles. The use of bucket trucks to service these luminaires is a potential problem, because the knuckle of the boom can extend over an adjacent lane. The solution in at least one metropolitan area is to use the ILD (Fig. 7.60) with the luminaire, eliminating the need for a bucket truck. This facilitates traffic control and requires a smaller-size crew. Some maintenance depart­ments prefer the ILDs and request their installation on barrier lighting projects.

There have been several types of floodlights and sports lights used in roadway applications over the years as lighting designers have attempted to cope with the increasing numbers of lanes and the confining rights-of-way. In most cases, the high level of accuracy required for proper aiming and the need for special glare shields have limited their usefulness.

RAFTER DIES ON ROOF


Framing


ROOFiNG

SHEATHiNG


RAFTER DIES ON ROOF

SUPPORT TO RAKE.


CUT ON FASCiA iS MADE AT PiTCH OF ROOF & ABOVE LEVEL OF ROOFING; FASciA IS SuppORTED ву RAFTERS &

sheathing.


SHEATHiNG


Elevation


——- ROOFING


SHEATHING

FASCIA

  RAFTER DIES ON ROOF

FASCIA DIES ON ROOF


RAFTER DIES ON ROOFRAFTER DIES ON ROOFRAFTER DIES ON ROOF

ROOF SHEATHiNG


END RAFTER


common

RAFTER


EDGE FLASHiNG


VERGE RAFTER OR TRiM BOARD CONTiNUOUS TO FASCiA


WALL

sheathing


furring

continuous

behind

VERGE RAFTER SEE 150A


FURRiNG ALLOWS VERGE RAFTER OR TRiM BOARD TO ACT AS DRiP.


double top plate


VERGE RAFTER OR TRiM BOARD


SiDiNG TRiMMED TO cONTiNuOuS FuRRiNG


corner OF WALLS BELOW—–


fascia shown

MITERED TO VERGE; IT MAY ALSO BE

square-cut & covered WITH TRiM OR GuTTER.


ExTERiOR wALL FINISH


WALL SHEATHiNG


RAFTER DIES ON ROOFRAFTER DIES ON ROOF

RAFTER DIES ON ROOF

(Q ABBREVIATED RAKE

ABBREVIATED RAKE/EAVE

Corner Framing

Подпись: NOTE FOR INSuLATiON & VENTILATION, SEE 197-205. RAFTER DIES ON ROOFПодпись: SIDING WALL SHEATHING NAILING BLOcK CONTINUOUS MANUFACTURED VENT STRip PROVIDES VENTING & FLASHING. ROOFING SHEATHING HELD BAcK FROM WALL ALLOWS CONTINUOUS VENTING FROM RAFTER SPACES. RAFTER ROOFING Подпись: NOTE FOR iNSuLATiON & ROOF VENTILATION SEE 197-205. RAFTER DIES ON ROOFsiding

WALL SHEATHING

flashing

NAILING BLOcK

ROOF SHEATHING

ROOFING

2X LEDGER NAILED TO STuDS

2X PuRLiNS

Подпись: TOP OF RAFTER/WALL Подпись: TOP OF RAFTER/WALL

perpendicular TO rafters provide 1V2-IN. AIR space FOR LATERAL AIR MOVEMENT. provide INTAKE & exhaust vents. see 201

Подпись: Shed Roof with PurlinsShed Roof with Continuous Vent Strip

RAFTER DIES ON ROOF

RAFTER DIES ON ROOF

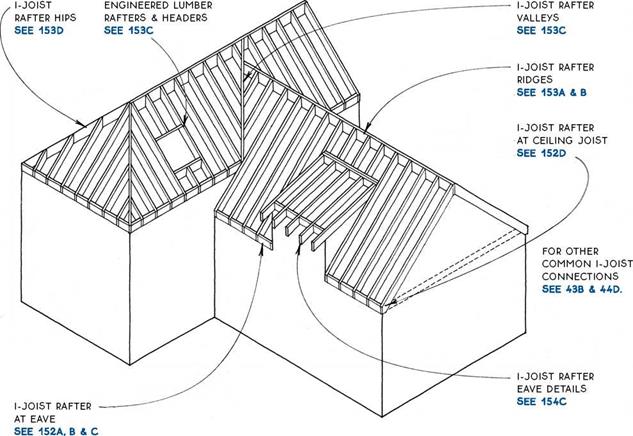
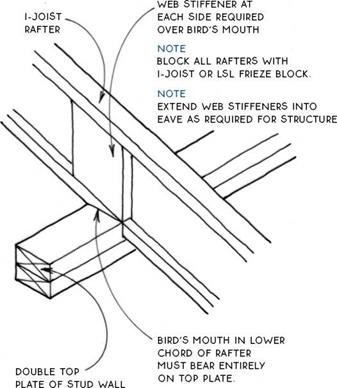
The strength, precision manufacturing, and long lengths that make engineered lumber appropriate for floor framing (see 43A) also indicate its use for roof framing. I-joists used as rafters constitute the bulk of engineered lumber used for roof framing; and they are stiffer, stronger, and lighter than their solid-sawn counterparts, but they also cost more, and their appear­ance is not generally satisfactory if exposed.

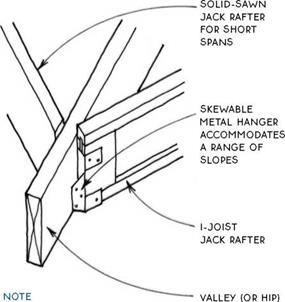
Despite the many advantages, engineered lumber as roof framing has not seen the explosive growth that has been the case with floor framing. Part of the reason is that roof framing with engineered lumber is hardware intensive. Virtually every connection must be made with a metal connector, and most also require the addition of two web stiffeners, one on each side of the I-joist rafters. This adds considerable time and labor cost to the task of roof framing.

Another difference between framing roofs with solid-sawn or engineered lumber is that engineered lumber almost always requires a structural ridge beam.

This means that roof loads must usually be carried down to the foundation through the core of the building.

The cost/benefit ratio for framing roofs with engi­neered lumber favors its use only for simple gable or shed roof forms. However, many builders have found ways to combine the advantages of both solid-sawn and engineered lumber on the same building. In these hybrid roofs, engineered lumber is used for the basic forms, and solid-sawn lumber is employed for the smaller-scale parts and the more complicated forms. This mixing of materials is practical for roof construc­tion where differential shrinkage is not usually a signifi­cant problem.

The general framing principles that apply to roof framing with solid-sawn lumber also hold true for engineered lumber. To perform as designed, however, engineered lumber roof components must be installed completely in accordance with the individual manufac­turer’s instructions. The drawings in this section there­fore emphasize roof framing conditions that are specific to engineered lumber.

RAFTER DIES ON ROOFl-JQIST RAFTERS

Introduction

WEB STIFFENER AT EACH

RAFTER DIES ON ROOF


RAFTER DIES ON ROOF

RAFTER DIES ON ROOF

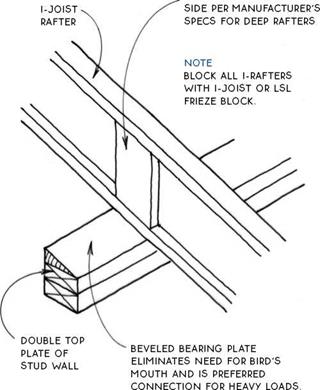
I-JOIST RAFTER AT EAVE

With Beveled Bearing Plate

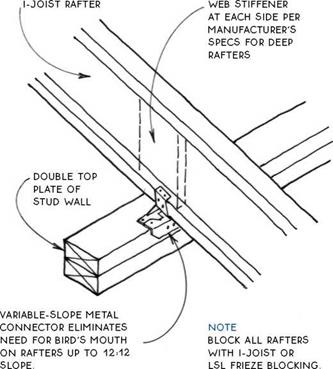
I-JOIST RAFTER AT EAVE

With Metal Connector

RAFTER DIES ON ROOFПодпись: I-JOIST RAFTER AT EAVE

RAFTER DIES ON ROOF

MOST i-JOiST MANUFACTURERS DO NOT SUPPORT THiS DETAiL.

NOTE

BLOCK ALL RAFTERS WiTH i-JOiST OR LSL FRiEZE BLOCK. EXTEND wEB STiFFENERS iNTO EAVE AS REQuIRED FOR

structure.

I-JOIST RAFTER/CEILING JOIST

With Bird’s Mouth

ROOF SHEATHING

RAFTER DIES ON ROOFRAFTERS ATTACHED TO EACH OTHER WITH 3A-IN. PLYWOOD GUSSETS ON BOTH SIDES.

DOUBLE-BEVELED WOOD FILLER PLATE

RAFTER DIES ON ROOFSTRUCTURAL RIDGE BEAM

RAFTER DIES ON ROOFROOF SHEATHiNG METAL STRAP i-JOiST RAFTER

WEB STiFFENER METAL RAFTER HANGER STRUCTURAL RiDGE BEAM

дЛ I-JOIST RAFTER/STRUCTURAL RIDGE BEAM

Подпись: PERPENDICULAR LSL HEADER ON METAL HANGERS Подпись: PLUMB LSL HEADER oN METAL HANGERSПодпись:RAFTER DIES ON ROOFstructural rafter

Подпись:Подпись: RAFTER OF LVL oR LSLRAFTER DIES ON ROOFПодпись:OF LVL, LSL, OR DOUBLE I-JOISTS ® SIDE OF DORMER. SKYLIGHT. OR OTHER ROOF OPENING

STRUCTURAL RAFTER/HEADER

RAFTER DIES ON ROOF

I-joiST RAFTER


roofing


roofing


i-JOiST RAFTER


roof

SHEATHING


WEB STiFFENERS AT BOTH SiDES PER MANUFACTURER’S SPECS –


WEB STIFFENER AT BoTH SiDES pER manufacturer’s specs for deep

RAFTERS


roof

sheathing


NAILING block for SuBFASciA


bird’S-mouth cut at lower

FLANGE oF RAFTER MuST HAVE FuLL BEARING oN

plate.


LSL rim or blocking


BiRD’S-MOUTH CUT AT LOWER FLANGE oF RAFTER MuST

have full bearing on plate.


exterior

finish

WALL WITH

trim


ceiling joist SEE 132


VENTED soffit SEE 202B, c & 203A


ceiling

joist

SEE 132


double top plate of stud wall

note

block all rafters with I-joist or LSL frieze BLocK


WALL

SHEATHING


double top plate of stud wall


WALL

SHEATHING


RAFTER DIES ON ROOF RAFTER DIES ON ROOF

note

dummy rafter laps I-joist RAFTER 11/2 x distance of overhang.


roofing


align top of dummy rafter


roofing


roof sheathing


roof sheathing


(VENTED)

frieze block SEE 202A


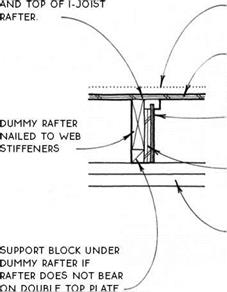
dummy rafter nailed to web

STiFFENERS

i-joist rafter


. i-joist rafter


web stiffener


web stiffener


dummy

RAFTER


double top plate of stud wall


bird’S-mouth cut at lower

FLANGE oF RAFTER MuST HAVE FuLL bearing on plate.

double top plate of stud wall


exterior

WALL

finish


Section Parallel to Eave


WALL

SHEATHING


RAFTER DIES ON ROOF

RAFTER DIES ON ROOFRAFTER DIES ON ROOFRAFTER DIES ON ROOFRAFTER DIES ON ROOF

RAFTER DIES ON ROOF

RAFTER DIES ON ROOF

RAFTER DIES ON ROOF

Roof trusses, like floor trusses, are a framework of small members (usually 2x4s) that are connected so that they act like a single large member. They are always engineered by the manufacturer.

Engineered roof trusses can span much greater distances than the stick-framed rafter-and-tie system. Long spans (over 40 ft.) are possible with simple trusses so that large open rooms may be designed with roof loads bearing only on the perimeter walls. Interior walls may simply be partition walls and may be repositioned without compromising the roof structure.

A second advantage of roof trusses is the reduction in roof framing labor. Trusses are typically set in place

by the delivery truck and may be positioned and fas­tened in a fraction of the time it would take to frame with rafters and ties.

One major disadvantage of roof trusses is the dif­ficulty of adapting them to complex roof forms. Roofs with numerous hips, valleys, or dormers are usually less expensive to build if they are framed with rafters.

Another disadvantage of roof trusses is that the webs of the truss occupy space that could be available for storage or as a full-size attic. Furthermore, these webs cannot be cut for any future remodeling purposes.

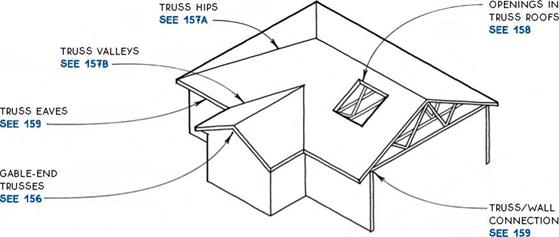
Five common roof truss types are shown in the drawings below.

RAFTER DIES ON ROOFA gable-end truss transfers the load of the roof to the wall on which it bears through 2×4 struts at 24 in. o. c. The standard gable-end truss is the same size as a standard truss. A gable-end truss can be used with a rake overhang of 12 in. or less when the barge rafter is supported by the roof sheathing. It can also be used with flat 2×4 lookouts let into the truss above the struts. A dropped gable-end truss (see 156B) is shorter than a standard truss by the depth of the lookouts.

RAFTER DIES ON ROOF

ROOFiNG ROOF SHEATHiNG

TOP CHORD OR GABLE-END TRUSS

EXTERiOR WALL FiNiSH WALL SHEATHiNG

BOTTOM CHORD OF GABLE-END TRuSS

cEiLiNG NAiLER

iNTERiOR FiNiSH

double top plate

Truss/Gable-End Wall

RAFTER DIES ON ROOF

дЛ STANDARD GABLE-END TRUSS

RAFTER DIES ON ROOF

Подпись: NOTE A DROppED GABLE-END TRuSS iS SHORTER THAN A STANDARD TRuSS BY THE DEpTH OF THE LOOKOuTS.

Подпись: STANDARD TRUSSES - Подпись:Подпись: BARGE RAFTER ATTACHED TO LOOKOUTS RAFTER DIES ON ROOFlookouts BEAR ON TOp cHORD OF dropped truss to support rake

OVERHANG.

SEE DETAIL ON RIGHT

Truss/Gable-End Wall

DROPPED GABLE-END TRUSS

There are several ways to frame a hip roof using trusses. None is simple, so many builders elect to frame hips (even on a truss roof) with rafters (see 138).

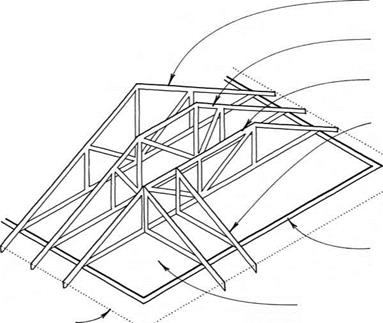
Подпись:Подпись:Подпись:Подпись:Подпись:RAFTER DIES ON ROOFПодпись:Подпись:The most common method of framing a hip with trusses is called the step-down system. A series of progressively shallower trusses with flat tops is used to create the end roof pitch of the hip roof. The last of these trusses is the girder truss, which carries the weight of short jack trusses or rafters that complete the roof.

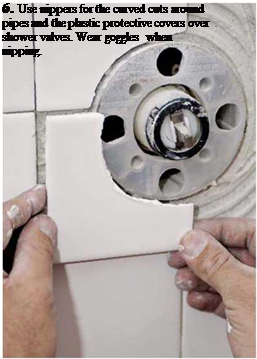
MOSAIC TILE   After you’ve set paper-backed sheets of mosaic tile in adhesive, the paper will start to soften, allowing you to reposition the tiles slightly. To move a row of tiles, place the straight edge of a trowel against them, as shown, and tap the trowel lightly with a hammer handle.   Countertop Front and Back Edges   Use a grout float to seat mosaic tile in the thinset adhesive. Be sure to don knee pads that are comfortable enough to wear all the time.   Flash the front edge of a counter, as shown, to prevent the exposed edges of the plywood from wicking moisture from the thinset adhesives and then swelling. Because the back edges of the countertops are also vulnerable to water damage, caulk and flash them, too.   through those marks, perpendicular to the con­trol line, to the back of the counter. L-SHAPED COUNTER On an L-shaped counter you have, in effect, two counters at right angles to each other, so you will need two control lines, perpendicular to each other, running along the front edge of each section. Any other layout considerations are subordinate to these two control lines, for they determine how the two oncoming tile fields will align.   STRAIGHT COUNTER, WITH SINK To tile a straight counter with a sink, the layout is much the same as a counter without a sink, except that here, your main concern is making symmetrical tile cuts (if necessary) on either side of the sink. If you need to cut tiles, move the story pole side to side until the tile joints are equidistant on each side of the sink’s rough open­ing. Then transfer those two marks to the control line. Finally, use a framing square to run lines &nbsp

Use your framing square and a straightedge to establish control lines and to keep the tiles aligned once you’ve turned the corner. After set­ting V-cap trim tiles, start tiling where the two control lines intersect. As with straight counters, put full tiles along the front of the counters and work back, relegating cut tiles to the very back, to be covered by the backsplash. If you use the same tile for the backsplash, continue the tile joints up the wall so that the backsplash and counter joints line up.

Tub Surround

Never assume tub walls are plumb. Always check them with a 4-ft. level. If walls aren’t plumb with­in % in. in 8 ft., correct them with a mortar bed or reframe them. Otherwise, tile joints from adja­cent walls won’t align. Moreover, never assume that a corner is a good place to start tiling, for it may not be plumb. Instead, establish level and plumb control lines on each wall to guide your layout.

Most tilesetters start by laying out the longest wall, which we’ll call the back wall. Use your 4-ft. level to determine if the tub is level on all three sides of the surround. If tub shoulders are level, you can start measuring tile courses up from the tub; but in renovation, tub shoulders are rarely level. More likely, the tub will slope. So, from the lowest point of the tub shoulder, measure up one tiling unit and mark it onto a wall. (A tiling unit is a tile width plus one grout joint.) Through that mark, draw a horizontal control line, and extend that line to all three walls of the surround.

Now locate a vertical control line, roughly centered along the back wall. Holding your story pole horizontally, determine whether you need to cut tiles and, if so, where to place them. In most cases, back walls look best if there are symmetri­cal (equally wide) vertical columns of cut tiles at each end. That decided, chose the joint mark on your story pole closest to the middle of the wall, and run a plumbed line up, bisecting the back wall and the horizontal control line you drew

Reliability of Simple Systems

In this section the reliability of some simple systems will be discussed. In the framework of time-to-failure analysis, availability of such systems will be pre­sented. Information such as this is essential to serve as the building blocks for determination of reliability or availability of more complex systems.

7.3.1 Series systems

A series system requires that all its components or modes of operation perform satisfactorily to ensure a satisfactory operation of the entire system. In the context of load-resistance interference, the failure event associated with a mode of operation is

Fm = {Wm < 0} form = 1, 2,…, M

in which Wm is the random performance variable associated with the mth mode of operation. Referring to Chap. 4, the failure probability and reliability asso­ciated with the mth mode of operation, respectively, are

P (Fm) = P ( Wm < 0) = P (Zm < ~Pm) = ®(-fim) (7.28a)

P (Fm) = P ( Wm > 0) = P (Zm > – Pm) = 4Pm) (7.28b)

in which Zm is the standard normal random variable associated with Wm, and pm is the reliability index associated with the mth mode of operation.

The failure probability of a series system involving M modes of operation, according to Eq. (7.1), can be expressed as

M

U (Wm < 0)

m=1


Pf, sys = P


P


U (Zm <

m=1


вт)


(7.29)


Reliability of Simple Systems

Reliability of Simple Systems Подпись: (7.30)

Because all the standardized normal random variables Zm’s generally are cor­related, computation of the exact system failure probability using Eq. (7.29) may not be practical, especially when the number of modes of operation M is large. For this case, the second-order bounds for Pf, sys could be viable. According to Eq. (7.26), the bounds for system failure probability are

in which Ф(—вj, —em I Pjm) is the bivariate normal probability, which can be computed by procedures described in Sec. 2.7.2, with Pjm being the correlation coefficient between the performance variables Wj and Wm for the j th and mth modes of operation. Accordingly, the bounds on reliability of a series system can be obtained easily by using Eq. (7.11b).

Подпись: Ф( в j , em 1 pjm > 0) Подпись: <Ф( —emW—ЄІ | m) + Ф(—вj )Ф( — вm | j ) > max[Ф( — вm)Ф(—вj I m), Ф(—вj )Ф( — вm | j )] Подпись: (7.31)

Although computation of the exact bivariate normal probability can be ob­tained through numerical integration, sometimes information about its bounds is sufficient. Under a positively correlated case, narrow bounds of Ф(—вj, —em I Pjm > 0) that require evaluations of only univariate normal probabilities are

where ві Im = в, Ртв" (7.32a)

v/irpm

emu = em,— P’"’m’ (7.32b)

j

In the case that the pair of performance functions is negatively correlated, the bounds for joint failure probability are

0 < Ф(— Єі, —em I Pjm < 0) < minm—emm—ej | m), Ф( — в} m—em | j )] (7.33)

The derivations of Eqs.(7.31) and (7.33) are given in Appendix 7A. Ang and Tang (1984) pointed out that use of an approximation of Eq. (7.31) could improve (tighten) the second-order bound of Eq. (7.30) when the single-mode failure probabilities are small, say, on the order of 10—4. However, if the single-mode
failure probabilities are all large (e. g., 10-2), the bound of Eq. (7.31) will be wide.

Reliability of Simple Systems Подпись: M n m=1 Подпись: P Подпись: П (Zm > Pm) m=1 Подпись: (7.34)

In fact, the reliability of a series system can be computed, according to Eq. (7.2), as

It should be pointed out that, in general, P [n(Zm > —em)] = P [n(Zm < fim)] unless for the univariate case. As can be seen, the reliability of a series system is the multivariate normal probability whose determination can be made by Ditlevsen’s approach, described in Sec. 2.7.2, or by various bounding approaches discussed in Sec. 2.7.3.

Example 7.6 Consider a system consisting of three modes of operation, each of which is specified by the following linear performance functions:

W1( X) = X1 + 2 X2

W2( X) = X1 + X2 + X3

W3( X) = X2 + 2X3

in which the stochastic basic variables X1, X2, and X3 are multivariate normal ran­dom variables with the vector of means

Vx = (М1, М2, М3/ = (6, 6, 6/

and covariance matrix

■9.00

0.00

0.00

Cx =

0.00

9.00

0.00

.0.00

0.00

9.00

The state of the system is such that if any of the three modes of operation fail, the system would fail. Calculate the system reliability.

Solution From the preceding covariance matrix Cx, it is understood that all three stochastic basic variables are uncorrelated, each with a variance of 9, that is, Var(X1) = Var(X2) = Var(X3) = 9. The vector of expected values of W1, W2, and W3 is

Vw = (Mw1, Mw2, Mw3) = [6 + 2(6), 6 + 6 + 6, 6 + 2(6)/ = (18, 18, 18/

The covariance matrix of the three performance functions W’s can be computed as

Cw = S1 Cx S

in which S, the sensitivity matrix, is an K x M matrix, with M and K being the number of performance functions and stochastic basic variables, respectively. The sensitivity matrix S contains, in each column, the vector of sensitivity coefficients for each performance function with respect to individual stochastic basic variable, that is,

S = [S1, 82,…, sm ]

for m = 1,2,…, M. In this example, since all performance functions are linear, the sensitivity matrix consists of coefficients in the performance functions, that is,

1

2

0

s1 =

1

1

1

1

0

1

to 1

Hence the covariance matrix of the three performance functions can be obtained as

45

27

18

Cw =

27

27

27

18

27

45

As can be seen, even though the three stochastic basic variables are uncorrelated, the three performance functions are correlated because they are defined by some stochastic basic variables common to the other performance functions. Hence the variances of W1, W2, and W3 appear on the diagonal of Cw, namely,

Var( W1) = 45 Var( W2) = 27 and Var( W3) = 47

The corresponding correlation matrix of random W’s can be obtained easily as

‘1.000 0.7746 0.4000’

Подпись: RПодпись: w

Подпись: with Подпись: dWm dWm dWm dX 1, dX2’, d XK
Подпись: s

0.7746 1.000 0.7746

0.4000 0.7746 1.000

The system failure probability is defined as

pf ,sys = P [(W1 < 0) U (W2 < 0) U (W3 < 0)]

= P [(Z1 < -2.68) U (Z2 < -3.46) U (Z3 < -2.68)]

The exact system failure probability can be obtained as pf sys = P [(Z1 < -2.68) U (Z2 < -3.46) U (Z3 < -2.68)]

= [P(Z1 < -2.68) + P(Z2 < -3.46) + P(Z3 < -2.68)]

– [P(Z1 < -2.68, Z2 < -3.46) + P(Z1 < -2.68, Z3 < -2.68)

+ P(Z2 < -3.46, Z3 < -2.68)] + P(Z1 < -2.68, Z2 < -3.46, Z3 < -2.68)

= (0.003681 + 0.0002701 + 0.003681) – (0.0001659 + 0.0001987 + 0.0001659) + 0.0001556 = 0.0072572

Hence the system reliability ps>sys = 1 – 0.0072572 = 0.9927428. Note that the preceding bivariate normal probabilities are calculated by Eq. (2.121), whereas the trivariate normal probability is computed according to Ditlevsen’s algorithm using Taylor expansion described in Sec. 2.7.2.

Alternatively, the second-order bounds for the system failure probability can be computed according to Eq. (7.30). The results are

0.007102 < pf, sys < 0.007268

and the corresponding bounds on the system reliability ps, sys are

0.992732 < ps, sys < 0.992898

In the framework of time-to-failure analysis, the reliability ps, m(t) and failure probability pf, m(t) of the mth component over the time interval (0, t ], according to Eqs. (5.1a) and (5.1b), are

/

TO

fm(r) dr (7.35a)

and P(Fm) = pf, m(t) — [ fт(т)dx (7.35b)

70

respectively, where f m(t) is the failure density function for the mth component.

Подпись: ps,sys(t) — P Подпись: M n Fm m=1 Reliability of Simple Systems Подпись: (7.36)

In the case that the performance of individual components is independent of each other, the reliability of a series system is

Similarly, the availability of a series system involving M independent compo­nents is

M

Asys(t) — Ц Am(t) (7.37)

m—1

in which Aeys(t) and Am(t) are availabilities of the entire system and the mth component, respectively, at time t.

Подпись: and Reliability of Simple Systems Reliability of Simple Systems Подпись: fm(t) Подпись: (7.38) (7.39)

According to Eqs. (5.2) and (5.3), the failure density function f sys(t) and the failure rate hsys(t) for a series system involving M independent components can be derived, respectively, as

For the special case of an exponential failure density function such as

Подпись: f m(t) — Xme lmtfor t > 0, Xm > 0, m — 1,2,…, M

Reliability of Simple Systems Подпись: (7.40a) (7.40b)

the reliability and unreliability of a series system with M independent compo­nents, respectively, are

Reliability of Simple Systems Reliability of Simple Systems Подпись: (7.41a)

Assuming an exponential repair function for each independent component, the availability and unavailability for a series system, according to Eqs. (7.37) and (5.59), are

Подпись: (7.41b)and Usys(t) — 1 Asys(t)

Reliability of Simple Systems Reliability of Simple Systems Reliability of Simple Systems Подпись: (7.42)

in which nm is the constant repair rate for the mth component, and Usys(t) is the system unavailability at time t. The stationary system availability, by Eq. (5.60), can be expressed as

in which MTTRm and MTTFm are, respectively, the mean time to repair and mean time to failure of the mth component.

Example 7.7 As an example of a series system, consider a pumping station consisting of two different pumps in series, both of which must operate to pump the required quantity. The constant failure rates for the pumps are Л1 = 0.0003 failures/h and Л2 = 0.0002 failures/h. For a 2000-h mission time, the system reliability, according to Eq. (7.40a), is

Reliability of Simple Systems Reliability of Simple Systems

ps, sys(t = 2000) = exp[-(0.0003 + 0.0002)(2000)] = 0.90484 and the MTTF of the system is

Checking Reference

To check using four reference lines, measure the two diagonals, then write down the measurements on the footprint you used for measuring the dimensions. If the corner points are set correctly, then the diagonals will be the same length. If the reference dry lines are square, then the diagonals will be the same length. (See “Start-up" example.)

If you have only two reference lines to work with, you’ll need to use a triangle to help you check for square. The two reference lines will be “square" with each other if they create a right angle (90°). You can use a 3-4-5 triangle or the Pythagorean

theorem to determine whether the two reference lines create a 90° angle. In each case, the three sides (the rise, run, and diagonal) of a triangle must have a certain length relationship for the reference lines to be “square." Since we can let the two sides of the triangle be the reference lines and make them any length, it is the third line (the diagonal), which will determine if the reference lines are at a 90° angle.

A 3-4-5 triangle works well because as long as one angle is a right angle (90°), and the lines on either side of the right angle (the rise and run) have a relationship of 3 to 4, then the third side (the diagonal) is a 5 in the same relationship.

To use the triangle, use your reference dry lines to replicate a right angle, then create a triangle using the 3-4-5 relationship for the sides. To do this, measure a distance out on each reference string line from the point where the two lines intersect. The measurements of each leg should be a multiple of 3, 4, or 5. Note that the longer the length, the better assurance you have of accuracy. So if you are using a 25′ tape, for example, measure out 20′ on the one side and 15′ on the other side. The distance between these two points—across the diagonal-should be 25′.

The Pythagorean Theorem system sounds a lot worse than it is. If you use a calculator like a

Construction MasterPro®, all you need to know is that the three sides of the triangle are represented on the calculator by a “run" button, a “rise" button, and a “diagonal" button. You’ll need to find the length of the third side of the triangle (diagonal) that is required to make the two reference lines square (90°). Enter into the calculator the lengths of the two sides of the triangle that are next to the angle that needs to be 90°. (Press the run button for the one side and the rise button for the other side.) Pressing the diagonal button will give you the length of the third side of the triangle. This length is the distance needed to have the reference lines square and the angle to be exactly 90°.

If the diagonal length is not what it is supposed to be, then write on the footprint how much over or under it is.

Bounds for system reliability

Despite the system under consideration being a series or parallel system, the evaluation of system reliability or failure probability involves probabilities of union or intersection of multiple events. Without losing generality, the deriva­tion of the bounds for P (A1U A2 U—U AM) and P (A1 n A2 П—П AM) are given below.

For example, consider P(A1 U A2 U-U AM). When Am = Fm, the probability is for the failure probability of a series system, whereas when Am = Fm, the probability is for the reliability of a parallel system. The bounds of system failure probability, that is, can be defined as follows:

Pf ,sys – Pf, sys – Pf, sys (7.11a)

with p f sys and p f, sys being the lower and upper bounds of system failure prob­ability, respectively. The corresponding bounds for system reliability can be obtained as

1 – Pf, sys = PS, SyS – Ps, sys – Ps, sys = 1 – Pf, sys (7.11b)

Similarly, after the bounds on system reliability are obtained, the bounds on system failure reliability can be computed easily.

First-order bounds. These bounds also are called unimodal bounds (Ang and Tang, 1984, p. 450). They can be derived as follows. Referring to Eq. (2.7), the probability of the joint occurrence of several events can be computed as

P ( П A^ = P (A1) x P (A2 | A1) x—x P ( Am | Am-1, Am-2, ■ ■■, A2, A1)

m=1 )

(7.12)

Under the condition that all events Aj and Am are positively correlated, the following inequality relationship holds:

P (Am | Aj ) > P (Am)

Hence

P (Aj, Am) = P (Am | Aj)P ( Aj ) > P ( Am)P (Aj )

This can be extended to a multiple-event case as

Bounds for system reliability

M

П Am

m=1


P


(7.13)


m1


Bounds for system reliability

As can be seen, the lower bound of the probability of an intersection is when all events are as if they are independent. Furthermore, it is also true that

П Am c Aj for any j = 1, 2, ■■■, M

m=1

Therefore,

Подпись: M , П Am m1 c min{ A1, A2, ■■■, Am }

Подпись: P Подпись: M Am Подпись: - min{P(A1), P(A2), ■■■, P(AM)} Подпись: (7.14)

Consequently,

Подпись: M П P (Am ) < P m=1 Подпись: M П Am m1 Подпись: < min {P (Am)} m=1,2,..., M Подпись: (7.15)

Based on Eqs. (7.13) and (7.14), the bounds on probability of joint occurrence of several positively correlated events are

Example 7.3 Consider three standardized normal random variables Z1, Z2, and Z3 with the following correlation matrix:

1.000

0.841

0.014

Rz =

0.841

1.000

0.536

0.014

0.536

1.000

Compute the first-order bounds for P{(Z1 < —2.71) U (Z2 < —2.88) U (Z3 < —3.44)}.

Solution The three events corresponding to the preceding trivariate normal probability are

A1 = {Z1 < -2.71} A2 = {Z2 < -2.88} A3 = {Z3 < -3.44}

Since,

P(A1 U A2 U A3) = 1 — P(Aj П A П A3)

the first-order bounds for P( A1U A2 U A3) can be obtained from those of P(A1П A П A3).

To derive the first-order bounds for P(A1 П A П A3), individual probabilities are required, which can be obtained from Table 2.2 or Eq. (2.63) as

P(A[) = P(Z1 > -2.71) = 0.99664

P(A2) = P(Z2 > -2.88) = 0.99801

P(A3) = P(Z3 > -3.44) = 0.99971

Furthermore, because all Am’s are positively correlated, all Am’s are also positively correlated. According to Eq. (7.15), the first-order bounds for P(A1 П A^ П A3) is

(0.99664)(0.99801)(0.99971) < P[ n Am) < min{0.99664, 0.99801, 0.99971}

m=1

Подпись: 0.99437 < P Подпись: 3 П Am m=1 Подпись: < 0.99664

which can be reduced to

Подпись: 1 - 0.99664 < P Bounds for system reliability Подпись: < 1 - 0.99437

Therefore, the corresponding first-order bounds for P(A1 U A2 U A3) is

Подпись: 0.00336 P Подпись: 3 U Am Подпись: 0.00563

which can be reduced to

Referring to Eq. (7.2), the first-order bounds for reliability of a series system with positively correlated nonfailure events can be computed as

M

П P (Fm) < ps, SyS < min{P (Fm)} (7.16a)

m=1

or in terms of failure probability as

M

IT [1 – P (Fm)] < Ps, sys < min{1 – P (Fm)} (7.16b)

m

m=1

Similarly, referring to Eq. (7.7), by letting Am = Fm, the first-order bounds on the failure probability of a parallel system with positively correlated failure events can be immediately obtained as

M

TT P(Fm) < Pf, sys < min{P(Fm)} (7.17a)

m

m=1

Bounds for system reliability Подпись: (7.17b)

and the corresponding bounds for the system reliability, according to Eq. (7.11b), is

Example 7.4 Consider that the M identical components in a system are positively correlated and the component reliability is ps. Determine the reliability bounds for the system.

Solution If the system is a series system, the bounds on system reliability, according to Eq. (7.16a), are

PM < Ps, sys < Ps

When the system is in parallel, the bounds on the system reliability, according to Eq. (7.17b), are

Ps < Ps, sys < 1 – (1 – Ps)M

The bounds for system reliabilities for different M, with the component reliability of 0.95, for series and parallel systems are shown in Fig. 7.6. As can be observed, the bounds for the system widen as the number of components increases.

In the case that all events Am’s are negatively correlated, the following rela­tionships hold:

P (Am | Aj) < P (Aj) for all j, m

P(Aj, Am) < P(Aj )P(Am)

Hence the first-order bounds for the probability of joint occurrence of several negatively correlated events is

Подпись: M . n Am m=1 Подпись:

Bounds for system reliability

M

< П P (Am)

m=1

The bounds for reliability of a series system, with Am = F’m, containing nega­tively correlated events are

M

0 < Ps, sys < [1 – P (Fm)]

m=1

Подпись: 1

Bounds for system reliability

whereas for a parallel system, with Am = Fm,

It should be pointed out that the first-order bounds for system reliability may be too wide to be meaningful. Tighter bounds sometimes are required and can be obtained at the expense of more computations.

Second-order bounds (Bimodal bounds). The second-order bounds are obtained by retaining the terms involving the joint probability of two events. By Eq. (2.4), the probability of the union of several events is

p(u Am) = E P (Am)-EE P (Ai, Aj) + Y, P (Ai, Aj, Ak)-•••

‘ ‘ m=1 i< j i< j < k

+ (-1) MP (A1, A2,…, Am ) (7.18)

Notice the alternating signs in Eq. (7.18) as the order of the terms increases. It is evident that the inclusion of only the first-order terms, that is, P(Am), produces an upper bound for P (A1 U A2 U ■ ■ ■ U AM). Consideration of the only the first two order terms yields a lower bound, the first three order terms again an upper bound, and so on (Melchers, 1999).

Bounds for system reliability Подпись: M U m=1 Bounds for system reliability Подпись: (7.19)

Simple bounds for the probability of a union are

It should be pointed out that these bounds produce adequate results only when the values of P(Am) and P(Am, Aj) are small. Equation (7.18) alternatively can be written as

P M Am) = [P (A1)] + [P (A2) – P (A1, A2)] + [ P (A3) – P (A1, A3)

m=1

— P (A2, A3) + P (A1, A2, A3)] + [P (A4) — P (A1, A4) — P (A2, A4)

— P (A3, A4) + P (A1, A2, A4) + P (A1, A3, A4) + P (A2, A3, A4)

— P (A1, A2, A3, A4)] + [P (A5) ••• (7.20)

To derive the lower bound, consider each of the terms in brackets in Eq. (7.20). For example, consider the bracket containing the terms associated with event A4. Note that apart from P(A4), the remaining terms in the bracket are

-P [(A1, A4) U (A2, A4) U (A3, A4)]

Подпись: P Bounds for system reliability Bounds for system reliability

Furthermore, event A4 contains (A1, A4)U(A2, A4)U(A3, A4), which implies that P (A4) > P [(A1, A4) U (A2, A4) U (A3, A4)]. Consequently, each of the bracketed terms in Eq. (7.20) has a nonnegative probability value. Also notice that

and thus the following inequality holds:

Подпись:Подпись: P(A4) - P3

> P(A4) – Y P (Aj, At)

j=1

This equation can be generalized as

Подпись: mU1(Aj , Am) j=1m-1

Подпись: P (Am) - P> P(Am) – Y P (Aj, Am) (7.21)

j=1

It should be pointed out that the terms on the right-hand-side of Eq. (7.21) could be negative, especially when m is large. Owing to the fact that each of the

Подпись: P Подпись: M U Am n=1 Bounds for system reliability Bounds for system reliability Подпись: 0 Подпись: (7.22)

bracketed terms should be nonnegative, abetter lower bound to Eq. (7.20) can be obtained if the right-hand-side of Eq. (7.21) makes a nonnegative contribution to the lower bound (Ditlevsen, 1979), namely,

Earlier, Kounias (1968) proposed an alternative second-order lower bound by selecting only those combinations in Eq. (7.20) which give the maximum values of the lower bound:

pQ^ Am^j > P(A1) + max J ^[P(Am) – P(Aj, Am)](7.23)

j <m J

It should be pointed out that both lower bounds for the probability of a union depend on the order in which the events are labeled. Algorithms have been de­veloped for identifying the optimal ordering of events to obtain the best bounds (Dawson and Sankoff, 1967; Hunter, 1977). A useful rule of thumb is to order the events in the order of decreasing importance (Melchers, 1999). In other words, events are ordered such that P(A[1]) > P ( A[2]) > ••• > P(A[M]), with [m] representing the rank of the event according to its probability of occurrence. For a given ordering, Ramachandran (1984) showed that the lower bound pro­vided by Eq. (7.22) is better than Eq. (7.23), whereas both bounds are equal if all possible orderings are considered.

To derive the upper bound, attention is focused back to Eq. (7.20) and on each of the terms in brackets. For example, consider the bracket containing the terms associated with event A4. As discussed earlier, apart from P ( A4), the remaining terms in the bracket are

—P [(A1, A4) U (A2, A4) U (A3, A4)]

Using the fact that P(A U B) > max[P(A), P(B)], the following inequality holds:

Подпись: PU (Aj, A4) > max[P(Aj, A4)]

Lj <4 j j <4

Bounds for system reliability Подпись: < P(A4) — max[P(Aj, A4)] (7.24) j <4

Hence the probability in the fourth bracket involving event A4 satisfies

Bounds for system reliability Подпись: (7.25)

This inequality relation is true for all the bracketed terms of Eq. (7.22), and the upper bound can be obtained as

Bounds for system reliability
Example 7.5 Refer to Example 7.3. Compute the second-order bounds for the multi­variate normal probability.

Solution To compute the second-order bounds, the probabilities of individual events as well as the joint probabilities between two different event pairs must be computed. From Table 2.2 or Eq. (2.63), the probabilities of individual events are

P(A1) = P(Z1 < -2.71) = 0.003364

P(A2) = P(Z2 < -2.88) = 0.001988

P(A3) = P(Z3 < -3.44) = 0.0002909

The joint probabilities, according to the procedures described in Sec. 2.7.2, are P(A1, A2) = P(Z1 < -2.71, Z2 < -2.88 | p = 0.841) = 0.0009247

P(A1, A3) = P(Z1 < -2.71, Z3 < -3.44 | p = 0.014) = 0.000001142

Bounds for system reliability Подпись: m-1 P(Am) -£) P(AJ , Am) J =1 Подпись: ,0

P(A2, A3) = P(Z2 < -2.88, Z3 < -3.44 | p = 0.536) = 0.00004231 The lower bound of P(A1 U A2 U A3), according to Eq. (7.23), is

= P(A1) + max{[P(A2) – P(A1, A2)], ^ + max{[P(A3) – P(A1, A2) – P(A2, Ae)],0} = 0.003364 + max[[0.001988 – 0.0009247], 0} +max{[2.909 x 10⁻⁴ – 1.142 x 10⁻⁶) -4.231 x 10⁻⁵], 0} = 0.003364 + 0.00106633 + 0.00024736 = 0.004675

The upper bound of P(Ai U A2 U A3), according to Eq. (7.25), can be computed as

3 3

V P(Am) – У max[P(Aj, Am)]

m=1 m=2

3

= У P(Am) – {max[P(A1, A2)] + max[P(A1, A3), P(A2, A3)]}

m=i

= (0.003364 + 0.001988 + 0.002909) У max(0.0009247)

+ max[(1.142 x 10⁻⁶, 4.231 x 10⁻⁵)]} = 0.005641 – (0.000924 + 0.0000425)

= 0.004677

In summary, the second-order bounds for the trivariate normal probability P (A1 U A2 U A3) are

0.004675 < P(A1 U A2 U A3) < 0.004677

Comparing with the first-order bounds obtained in Example 7.3, the second-order bounds are definitely tighter.