Category Hydrosystems Engineering Reliability Assessment and Risk Analysis

Multivariate lognormal distributions

Подпись: f X1,X2( x1> x2) Подпись: 1 X1 x2^ln xi ^ln x2 Подпись: , exp 1 — PH Подпись: —Q' 2(1 — pH) Подпись: (2.134)

Similar to the univariate case, bivariate lognormal random variables have a PDF

Подпись: Q' Multivariate lognormal distributions Multivariate lognormal distributions

for x1, x2 > 0, in which

where pln x and ulnx are the mean and standard deviation of log-transformed random variables, subscripts 1 and 2 indicate the random variables X1 and X2, respectively, and p12 = Corr(ln X1, lnX2) is the correlation coefficient of the two log-transformed random variables. After log-transformation is made, prop­erties of multivariate lognormal random variables follow exactly as for the multivariate normal case. The relationship between the correlation coefficients in the original and log-transformed spaces can be derived using the moment­generating function (Tung and Yen, 2005, Sec. 4.2) as

Multivariate lognormal distributions

exp (p12°ln x1 Vln x2) 1

7exp «xj — Vexp ^J — 1


Corr( X1, X 2) = P12


(2.135)


Example 2.23 Resolve Example 2.21 by assuming that both X1 and X2 are bivariate lognormal random variables.

Solution Since X1 and X2 are lognormal variables,

Подпись: = P Подпись: ln(13) - » 1 ln(3) - ix'2 Z1 < 1 , Z2 < 1 Подпись: P

P(X1 < 13, X2 < 3) = P [ln(X1) < ln(13), ln(X2) < ln(3)]

in which »2, a1, and are the means and standard deviations of ln(X1) and ln(X2), respectively; p’ is the correlation coefficient between ln(X1) and ln(X2). The values of »1, »2, a1, and 02 can be computed, according to Eqs. (2.67a) and (2.67b), as

o’x = ] ln(1 + 0.32) = 0.294 e’2 = J ln( 1 + 0.42) = 0.385

p! x = ln(10) – 2(0.294)2 = 2.259 » = ln(5) – 1(0.385)2 = 1.535

Based on Eq. (2.71), the correlation coefficient between ln(X 1) and ln(X2) is

Подпись: 0.623ln[1 + (0.6)(0.3)(0.4)]

Подпись: P = ■(0.294)(0.385)

Then

P(X1 < 13, X2 < 3 | p = 0.6) = P(Z1 < 1.04, Z2 < -1.13 | p’ = 0.623)

= Ф(а = 1.04, b = -1.13 | p’ = 0.623)

Подпись: Problems
From this point forward, the procedure for determining Ф(а = 1.04, b = -1.13 | p’ = 0.623) is exactly identical to that of Example 2.21. The result from using Eq. (2.121) is 0.1285.

2.1 Referring to Example 2.4, solve the following problems:

(a) Assume that P(.Ё!!^) = 1.0 and P(E2ІE1) = 0.8. What is the probability that the flow-carrying capacity of the sewer main is exceeded?

(b) If the flow capacity of the downstream sewer main is twice that of its two upstream branches, what is the probability that the flow capacity of the downstream sewer main is exceeded? Assume that if only branch 1 or branch 2 exceeds its corresponding capacity, the probability of flow in the sewer main exceeding its capacity is 0.15.

(c) Under the condition of (b), it is observed that surcharge occurred in the downstream sewer main. Determine the probabilities that (i) only branch 1 exceeds its capacity, (ii) only branch 2 is surcharged, and (iii) none of the sewer branches exceed their capacities.

2.2 Referring to Example 2.5, it is observed that surcharge occurred in the down­stream sewer main. Determine the probabilities that (a) only branch 1 exceeds its flow-carrying capacity, (b) only branch 2 is surcharged, and (c) none of the sewer branches exceed their capacities.

2.3 A detention basin is designed to accommodate excessive surface runoff temporar­ily during storm events. The detention basin should not overflow, if possible, to prevent potential pollution of streams or other receiving water bodies.

For simplicity, the amount of daily rainfall is categorized as heavy, moderate, and light (including none). With the present storage capacity, the detention basin is capable of accommodating runoff generated by two consecutive days of heavy rainfall or three consecutive days of moderate rainfall. The daily rainfall amounts around the detention basin site are not entirely independent. In other words, the amount of rainfall on a given day would affect the rainfall amount on the next day.

Let random variable Xt represent the amount of rainfall in any day t. The transition probability matrix indicating the conditional probability of the rainfall amount in a given day t, conditioned on the rainfall amount of the previous day, is shown in the following table.

Xt+1 =

H

M

L

H

0.3

0.5

0.2

II

$

0.3

0.4

0.3

L

0.1

0.3

0.6

(a) For a given day, the amount of rainfall is light. What is the probability that the detention basin will overflow in the next three days? (After Mays and Tung, 1992.)

(b) Compute the probability that the detention basin will overflow in the next three days. Assume that at any given day of the month the probabilities for having the various rainfall amounts are P(H) = 0.1, P(M) = 0.3, P (L) = 0.6.

2.4 Before a section of concrete pipe of a special order can be accepted for installation in a culvert project, the thickness of the pipe needs to be inspected by state high­way department personnel for specification compliance using ultrasonic reading. For this project, the required thickness of the concrete pipe wall must be at least 3 in. The inspection is done by arbitrarily selecting a point on the pipe surface and measuring the thickness at that point. The pipe is accepted if the thickness from the ultrasonic reading exceeds 3 in; otherwise, the entire section of the pipe is rejected. Suppose, from past experience, that 90 percent of all pipe sections manufactured by the factory were found to be in compliance with specifications. However, the ultrasonic thickness determination is only 80 percent reliable.

(a) What is the probability that a particular pipe section is well manufactured and will be accepted by the highway department?

(b) What is the probability that a pipe section is poorly constructed but will be accepted on the basis of ultrasonic test?

2.5 A quality-control inspector is testing the sample output from a manufacturing pro­cess for concrete pipes for a storm sewer project, wherein 95 percent of the items are satisfactory. Three pipes are chosen randomly for inspection. The successive

quality evaluations may be considered as independent. What is the probability that (a) none of the three pipes inspected are satisfactory and (b) exactly two are satisfactory?

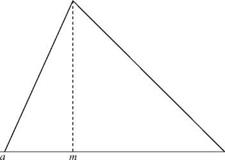
2.6 Derive the PDF for a random variable having a triangular distribution with the lower bound a, mode m, and the upper bound b, as shown in Fig. 2P.1.

2.7 Show that F 1(sq) + F2(x^) – 1 < F^xb x2) < min[F1(x1), F2(x2)]

2.8 The Farlie-Gumbel-Morgenstern bivariate uniform distribution has the following joint CDF (Hutchinson and Lai, 1990):

Fx, y(x, y) — xy [1 + в(1 – x)(1 – y)] for 0 < x, y < 1

with —1 < в < 1. Do the following exercises: (a) derive the joint PDF, (b) obtain the marginal CDF and PDF of X and Y, and (c) derive the conditional PDFs fx(x|y) and fy(y|x).

2.9 Refer to Problem 2.8. Compute (a) P(X < 0.5, Y < 0.5), (b) P(X > 0.5, Y > 0.5), and (c) P(X > 0.5 | Y = 0.5).

2.10 Apply Eq. (2.22) to show that the first four central moments in terms of moments about the origin are

Подпись: =0 _ ’ 2 — M2 Mx = M3 3MX M2 + 2MX — M4 — 4MX М3 + 6M2 М2 — 3M4 M1 М2 М3 М4

Multivariate lognormal distributions

Figure 2P.1 Triangular distribution.


b


2.11 Apply Eq. (2.23) to show that the first four moments about the origin could be expressed in terms of the first four central moments as

m1 = Mx

/ _ ,2 M2 — М2 + Mx

M3 = M3 + 3Mx М2 + m3

M4 = M4 + 4Mx М3 + 6m2 m2 +

2.12 Based on definitions of a – and ^-moments, i. e., Eqs. (2.26a) and (2.26b), (a) derive the general expressions between the two moments, and (b) write out explicitly their relations for r = 0,1, 2, and 3.

2.13 Refer to Example 2.9. Continue to derive the expressions for the third and fourth L-moments of the exponential distribution.

2.14 A company plans to build a production factory by a river. You are hired by the company as a consultant to analyze the flood risk of the factory site. It is known that the magnitude of an annual flood has a lognormal distribution with a mean of 30,000 ft3/s and standard deviation 25,000 ft3/s. It is also known from a field investigation that the stage-discharge relationship for the channel reach is Q = 1500H14, where Q is flow rate (in ft3/s) and H is water surface elevation (in feet) above a given datum. The elevation of a tentative location for the factory is 15 ft above the datum (after Mays and Tung, 1992). (a) What is the annual risk that the factory site will be flooded? (b) At this plant site, it is also known that the flood-damage function can be approximated as

n і – (Нпппч_/0 if H < 15 ft

Damage (in $1000) = |40(lnh + 8)(lnH — 2.7) if H > 15 ft

What is the annual expected flood damage? (Use the appropriate numerical ap­proximation technique for calculations.)

2.15 Referring to Problem 2.6, assume that Manning’s roughness coefficient has a triangular distribution as shown in Fig. 2P.1. (a) Derive the expression for the mean and variance of Manning’s roughness. (b) Show that (i) for a symmetric triangular distribution, a = (b — m)/V6 and (ii) when the mode is at the lower or upper bound, a = (b — a)/3 V2.

2.16 Suppose that a random variable X has a uniform distribution (Fig. 2P.2), with a and b being its lower and upper bounds, respectively. Show that (a) E (X) = xx = (b + a)/2, (b) Var(X) = (b — a)2/12, and (c) ^x = (1 — a/мх)/V3.

2.17 Referring to the uniform distribution as shown in Fig. 2P.2, (a) derive the expres­sion for the first two probability-weighted moments, and (b) derive the expressions for the L-coefficient of variation.

2.18 Refer to Example 2.8. Based on the conditional PDF obtained in part (c), de­rive the conditional expectation E(Y | x), and the conditional variance Var(Y |x).

Подпись: .Ш
Подпись: 1/(b - a)
Подпись: a Figure 2P.2 Uniform distribution.
Подпись: > x
Подпись: b

Furthermore, plot the conditional expectation and conditional standard deviation of Y on x with respect to x.

2.19 Consider two random variables X and Y having the joint PDF of the following form:

fx, y(X, y) = c (5 – 2 + x2) for 0 < x, y < 2

(a) Determine the coefficient c. (b) Derive the joint CDF. (c) Find fx (x) and fy( y).

(d) Determine the mean and variance of X and Y. (e) Compute the correlation coefficient between X and Y.

2.20 Consider the following hydrologic model in which the runoff Q is related to the rainfall R by

Q = a + bR

if a > 0 and b > 0 are model coefficients. Ignoring uncertainties of model coeffi­cients, show that Corr( Q, R) = 1.0.

2.21 Suppose that the rainfall-runoff model in Problem 2.4.11 has a model error, and it can expressed as

Q = a + bR + є

in which є is the model error term, which has a zero mean and standard deviation of ає. Furthermore, the model error є is independent of the random rainfall R. Derive the expression for Corr( Q, R).

2.22 Let X = X1 + X3 and Y = X2 + X3.FindCorr(X, Y), assuming that X1, X2, and X3 are statistically independent.

2.23 Consider two random variables Y1 and Y2 that each, individually, is a linear function of two other random variables X1 and X2 as follows:

Y1 = anX 1 + a12X 2 Y2 = a21X 1 + a>22X2

It is known that the mean and standard deviations of random variable Xk are and ffk, respectively, for k = 1, 2. (a) Derive the expression for the correlation

coefficient between Y]_ and Y2 under the condition that X1 and X2 are statistically independent. (b) Derive the expression for the correlation coefficient between Y1 and Y2 under the condition that X1 and X2 are correlated with a correlation coefficient p.

2.24 As a generalization to Problem 2.23, consider M random variables Y1, Y2,…, Ym that are linear functions of K other random variables X1, X2,…, Xk in a vector form as follows:

Ym = X for m = 1,2,…, M

in which X = (X1, X2,…, Xk)t, a column vector of K random variables Xs and aim = (am1, am2,…, amK), a row vector of coefficients for the random variable Ym. In matrix form, the preceding system of linear equations can be written as Y = AtX. Given that the mean and standard deviations of the random variable Xk are i^k and Ok, respectively, for k = 1,2,…, K, (a) derive the expression for the correlation matrix between Ys assuming that the random variable Xs are statis­tically independent, and (b) derive the expression for the correlation coefficient between Y s under the condition that the random variable Xs are correlated with a correlation matrix Rx.

2.25 A coffer dam is to be built for the construction of bridge piers in a river. In an economic analysis of the situation, it is decided to have the dam height designed to withstand floods up to 5000 ft3/s. From flood frequency analysis it is estimated that the annual maximum flood discharge has a Gumbel distribution with the mean of 2500 ft3/s and coefficient of variation of 0.25. (a) Determine the risk of flood water overtopping the coffer dam during a 3-year construction period.

(b) If the risk is considered too high and is to be reduced by half, what should be the design flood magnitude?

2.26 Recompute the probability of Problem 2.25 by using the Poisson distribution.

2.27 There are five identical pumps at a pumping station. The PDFs of the time to fail­ure of each pump are the same with an exponential distribution as Example 2.6, that is,

f (t) = 0.0008 exp(-0.0008t) for t > 0

The operation of each individual pump is assumed to be independent. The system requires at least two pumps to be in operation so as to deliver the required amount of water. Assuming that all five pumps are functioning, determine the reliability of the pump station being able to deliver the required amount of water over a 200-h period.

2.28 Referring to Example 2.14, determine the probability, by both binomial and Pois­son distributions, that there would be more than five overtopping events over a period of 100 years. Compare the results with that using the normal approxima­tion.

2.29 From a long experience of observing precipitation at a gauging station, it is found that the probability of a rainy day is 0.30. What is the probability that the next year would have at least 150 rainy days by looking up the normal probability table?

2.30 The well-known Thiem equation can be used to compute the drawdown in a con­fined and homogeneous aquifer as

in which Sik is drawdown at the ith observation location resulting from a pumpage of Qk at the kth production well, rok is the radius of influence of the kth production well, rik is the distance between the ith observation point and the kth production well, and T is the transmissivity of the aquifer. The overall effect of the aquifer drawdown at the ith observation point, when more than one production well is in operation, can be obtained, by the principle of linear superposition, as the sum of the responses caused by all production wells in the field, that is,

K K

si ‘У ‘sik ‘У ‘hikQk

k = 1 k = 1

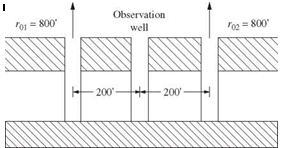
where K is the total number of production wells in operation. Consider a sys­tem consisting of two production wells and one observation well. The locations of the three wells, the pumping rates of the two production wells, and their zones of influence are shown in Fig. 2P.3. It is assumed that the transmissivity of the aquifer has a lognormal distribution with the mean гт = 4000 gallons per day per foot (gpd/ft) and standard deviation от = 2000 gpd/ft (after Mays and Tung, 1992). (a) Prove that the total drawdown in the aquifer field also is lognormally distributed. (b) Compute the exact values of the mean and variance of the total drawdown at the observation point when Q1 = 10, 000 gpd and Q2 = 15, 000 gpd.

(c) Compute the probability that the resulting drawdown at the observation point does not exceed 2 ft. (d) If the maximum allowable probability of the total draw­down exceeding 2 ft is 0.10, find out the maximum allowable total pumpage from the two production wells.

2.31 A frequently used surface pollutant washoff model is based on a first-order decay function (Sartor and Boyd, 1972):

Mt = M0e-cRt
Multivariate lognormal distributions
where M0 is the initial pollutant mass at time t = 0, R is runoff intensity (mm/h), c is the washoff coefficient (mm-1), Mt is the mass of the pollutant remaining

on the street surface (kg), and t is time elapsed (in hours) since the beginning of the storm. This model does not consider pollutant buildup and is generally appropriate for the within-storm event analysis. Suppose that M0 = 10, 000 kg and c = 1.84/cm. The runoff intensity R is a normal random variable with the mean of 10 cm/h and a coefficient of variation of 0.3. Determine the time t such that P(Mt/M0 < 0.05) = 0.90.

2.32 Consider n independent random samples X1, X2,…, Xn from an identical dis­tribution with the mean /xx and variance a2. Show that the sample mean Xn = ^2П= 1 Xi/n has the following properties:

2

E (Xn) = Px and Var( Xn) = ^

n

What would be the sampling distribution of Xn if random samples are normally distributed?

2.33 Consider that measured hydrologic quantity Y and its indicator for accuracy S are related to the unknown true quantity X as Y = SX. Assume that X ~ LN(px, ax), S ~ LN(ps = 1, as), and X is independent of S. (a) What is the distribution function for Y? Derive the expressions for the mean and coefficient of variation of Y, that is, py and Qy, in terms of those of X and S. (b) Derive the expression for rp = yp /xp with P(Y < yp) = P(X < Xp) = p and plot rp versus p. (c) Define measurement error as є = Y — X. Determine the minimum reliability of the measurement so that the corresponding relative absolute error |є/X| does not exceed the require precision of 5 percent.

2.34 Consider that measured discharge Q’ is subject to measurement error є and that both are related to the true but unknown discharge Q as (Cong and Xu, 1987)

Q = Q + є

It is common to assume that (i) E(є | q) = 0, (ii) Var^ | q) = [a(q)q]2, and (iii) ran­dom error є is normally distributed, that is, є | q ~ N(рє | q = 0, ає q).

(a) Show that E(Q’ | q) = q, E [(Q’/Q) — 11 q] = 0, and Var[( Q’/Q — 1)2 | q] = a2(q).

(b) Under a(q) = a, showthat E (Q’) = E (Q),VarW = a2 E (Q2),andVar( Q’) = (1 + a2)Var( Q) + a2 E 2( Q). (c) Suppose that it is required that 75 percent of measure­ments have relative errors in the range of ±5 percent (precision level). Determine the corresponding value of a(q) assuming that the measurement error is normally distributed.

2.35 Show that the valid range of the correlation coefficient obtained in Example 2.20 is correct also for the general case of exponential random variables with parameters в1 and @2 of the form of Eq. (2.79).

2.36 Referring to Example 2.20, derive the range of the correlation coefficient for a bivariate exponential distribution using Farlie’s formula (Eq. 2.107).

2.37 The Pareto distribution is used frequently in economic analysis to describe the randomness of benefit, cost, and income. Consider two correlated Pareto random
variables, each of which has the following marginal PDFs:

adk

fk (xk) = — xk >dk > 0 a > 0, for k = 1,2

xk

Derive the joint PDF and joint CDF by Morgenstern’s formula. Furthermore, derive the expression for E(X1X2) and the correlation coefficient between X1 and X2.

2.38 Repeat Problem 2.37 using Farlie’s formula.

2.39 Analyzing the stream flow data from several flood events, it is found that the flood peak discharge Q and the corresponding volume V have the following relation­ship:

ln(V) = a + b x ln( Q) + є

in which a and b are constants, and є is the model error term. Suppose that the model error term є has a normal distribution with mean 0 and standard deviation ає. Then show that the conditional PDF of V | Q, h(v |q), is a lognormal distribution. Furthermore, suppose that the peak discharge is a lognormal random variable. Show that the joint PDF of V and Q is bivariate lognormal.

2.40 Analyzing the stream flow data from 105 flood events at different locations in Wyoming, Wahl and Rankl (1993) found that the flood peak discharge Q (in ft3/s) and the corresponding volume V (in acre-feet, AF) have the following relation­ship:

ln(V) = ln(0.0655) + 1.011 x ln( Q) + є

in which є is the model error term with the assumed ає = 0.3. A flood frequency analysis of the North Platte River near Walden, Colorado, indicated that the annual maximum flood has a lognormal distribution with mean xq = 1380 ft3/s and ffQ = 440 ft3/s. (a) Derive the joint PDF of V and Q for the annual maximum flood. (b) Determine the correlation coefficient between V and Q. (c) Compute P(Q > 2000 ft3/s, V > 180 AF).

2.41 Let X2 = <0) + a1 Z1 + 02 Z2 and X2 = b0 + b1 Z2 + b2 Z^ in which Z1 and Z2 are

bivariate standard normal random variables with a correlation coefficient p, that is, Corr(Z1, Z2) = p. Derive the expression for Corr(X1, X2) in terms ofpolynomial coefficients and p.

2.42 Let X1 and X2 be bivariate lognormal random variables. Show that

Подпись: < Corr(X1, X2)

Multivariate lognormal distributions Multivariate lognormal distributions Подпись: 1

exp ( tfln X1 tfln X2) 1

Multivariate lognormal distributions Multivariate lognormal distributions Подпись: 1

exp aln x1 aln x2 – 1

What does this inequality indicate?

2.43 Derive Eq. (2.71) from Eq. (2.135):

Подпись: ln(1 + pi2^i^2) y/ln(l + n2^/in(i +Corr(lnXi, lnX2) = pi2

where pi2 = Corr(Xi, X2) and ^ = coefficient of variation of Xk, k = i, 2.

2.44 Develop a computer program using Ditlevsen’s expansion for estimating the mul­tivariate normal probability.

2.45 Подпись: References
Develop computer programs for multivariate normal probability bounds by Rack – witz’s procedure and Ditlevsen’s procedure, respectively.

Abramowitz, M., andStegun, I. A., eds. (i972). Handbook of Mathematical Functions with Formulas,

Determination of bounds on multivariate normal probability

Instead of computing the exact value of Ф(z |Rx), several methods have been proposed to determine the bounds on the exact value of Ф(z |Rx). This section describes three such bounds.

Bounds of Rackwitz. The scheme of Rackwitz (1978) is based on the decompo­sition of a positive correlation coefficient pij = XiXj, for i, j = 1, 2,…, K. The multivariate normal probability Ф(z |Rx) is obtained according to Eq. (2.120). Instead of solving for the exact values for all K(K – 1)/2Xs, Rackwitz selects the smallest three values of z = (z1, z2,…, zK)* in Ф^ |Rx) and solves for the corresponding Xs that satisfy pij = XiXj, for i, j = [1], [2], [3] with subscript [i]
representing the rank of zs in ascending order, that is, Z[p < Z[2] < Z[3] <• ■ ■ < zyK-i] < Z[K]. For example, assume that all ptj s are positive. Based on the three smallest zs, one can solve for X[i] for i = 1, 2, 3 in terms of рщ[j] as

Determination of bounds on multivariate normal probability

P[1][2] P[1][3]
P[2][3]


1/2


P[1][2] P[2][3]
P[1][3]


1/2


P[1][3] P[2][3]
P[1][2]


1/2


X[1]


X[2]


X[3]


(2.131)

Determination of bounds on multivariate normal probability Подпись: i = [4], [5], ...,[K ] i = [4], [5], ...,[K ] Подпись: (2.132a) (2.132b)

For the remaining Xs, their values can be computed as

The upper bound and lower bound of Ф(z |Rx) can be obtained by Eq. (2.120) along with Xs computed by Eqs. (2.132a) and (2.132b), respectively.

Подпись: ФL(z |Rx) = Ф^1) -^2 max I Ф(-Zk) - max |>(-Zk, -Zj | pkj)] / k 2 j < k Подпись: (2.133a)

Подпись: K Фи(z |Rx) = Ф^1) -^2 max ^ 0, k = 2 K Determination of bounds on multivariate normal probability
Подпись: j = 1

Bounds of Ditlevsen. Ditlevsen (1979) proposed an approach for the bounds of the multivariate normal probability as follows:

(2.133b)

in which Фи (z | Rx) and Ф^ | Rx) are the upper and lower bounds of the multi­variate normal probability, respectively, and Ф(zk, Zj | pkj) is the bivariate nor­mal probability. Ditlevsen (1979) further simplified these bounds to involve the evaluation of only the univariate normal probability at the expense of having a more complicated algebraic expression where a narrow bound can be obtained under |p | < 0.6. For a larger correlation coefficient, Ditlevsen (1982) proposed a procedure using conditioning to obtain a narrow bound. The derivations of various probability bounds for system reliability are presented in Sec. 7.2.5

1.00

0.80

0.64

0.51

0.41

0.80

1.00

0.80

0.64

0.51

0.64

0.80

1.00

0.80

0.64

0.51

0.64

0.80

1.00

0.80

0.41

0.51

0.64

0.80

1.00

Example 2.22 Z1, Z2, Z3, Z4, and Z5 are correlated standard normal variables with the following correlation matrix:

Rx —

Determine the multivariate probability P (Zi < -1, Z2 < —2, Z3 < 0, Z4 < 2, Z5 < 1) by Ditlevsen’s approach using the Taylor series expansion. Also compute the bounds for the preceding multivariate normal probability using Rackwitz’s and Ditlevsen’s approaches.

Solution Using Ditlevsen’s Taylor series expansion approach, the initial equicorrela – tion value can be used according to Eq. (2.124) as p = 0.655. The corresponding mul­tivariate normal probability, based on Eq. (2.121), is Ф(г | p = 0.655) = 0.01707. From Eq. (2.122), the first-order error, d Ф(г | p = 0.655), is 0.003958. Results of iterations according to the procedure outlined in Fig. 2.29 are shown below:

i

p

Ф(2|p)

dФ(г|p)

1

0.6550

0.01707

0.3958 x 10—2

2

0.8069

0.02100

—0.1660 x 10—3

3

0.8005

0.02086

—0.3200 x 10—4

4

0.7993

0.02083

—0.5426 x 10—5

At p = 0.7993, the corresponding second-order error term in the Taylor series ex­pansion, according to Eq. (2.126), is

d2Ф(г| p) = 0.01411

Based on Eq. (2.125), the multivariate normal probability can be estimated as Ф(z| Rx) = Ф(г| p = 0.7993) + 0.5d2Ф(г| p = 0.7993)

= 0.02083 + 0.5(0.01411)

0.02789

Using the Rackwitz approach for computing the bounds of the multivariate normal probability, the values ofzs are arranged in ascending order as (гщ, Z[2], Z[3], Z[4], Z[5]) = (—2, —1, 0,1, 2) = (Z2, Z1, Z3, Z5, Z4) with the corresponding correlation matrix as

1.00

0.80

0.80

0.51

0.41

0.80

1.00

0.64

0.41

0.51

0.80

0.64

1.00

0.64

0.80

0.51

0.41

0.80

1.00

0.80

0.64

0.51

0.80

0.80

1.00

R[kj]

The values of ks corresponding to the three smallest zs, that is, —2, —1, and 0, are computed according to Eq. (2.131), and the results are

k[1] = 1.00 k[2] = 0.80 k[3] = 0.80

Using Eq. (2.132a), the values of the remaining ks for computing the upper bound are obtained as

Determination of bounds on multivariate normal probability

Determination of bounds on multivariate normal probability Determination of bounds on multivariate normal probability

k[4]u = max


1.00


k[5],U = max


and, by the same token, for the lower bound are

k[4], l = 0.51 X[5], l = 0.6375

Applying Eq. (2.120), along with Хц = (1.0, 0.8, 0.8, 0.8, 1.0), one obtains the upper bound for the multivariate normal probability Фц(z |Rx) = 0.01699. Similarly, using Xl = (1.0, 0.8, 0.8, 0.51, 0.6375), the lower bound is obtained as ФL(z |Rx) = 0.01697.

To use Eqs. (2.133a) and (2.133b) for computing the upper and lower bounds for the multivariate normal probability, the marginal probabilities and each pair of bivariate normal probabilities are computed first, according to Eq. (2.3). The results are

Ф(г1) = 0.1587 Ф( z2) = 0.02275 Ф(г3) = 0.5000 Ф( z4) = 0.9772 Ф(г5) = 0.8413

Ф(-z1, —z2) = 0.8395 Ф(-z1, —z3) = 0.4816

Ф(—z1, —z4) = 0.0226 Ф(—z1, —z5) = 0.1523

Ф(—z2, — z3) = 0.5000 Ф(—z2, —z4) = 0.0228 Ф(—z2, —z5) = 0.1585

Ф(—z3, —z4) = 0.0227 Ф(—z3, —z5) = 0.1403 Ф(—z4, —z5) = 0.0209

The lower and upper bounds of the multivariate probability can be obtained as 0.02070 and 0.02086, respectively.

Computation of multivariate normal probability

Подпись: Ф( z | Rx ) = P (Z1 < Z1, Z2 < Z2, ■■■ , ZK < ZK | Rx ) Computation of multivariate normal probability Подпись: <£( z | Rx) dz 0 (2.116)

Evaluation of the probability of multivariate normal random variables involves multidimensional integration as

Accurate evaluation for Ф(г |Rx) is generally difficult and often is resolved by approximations.

Подпись: L(a, b | p) = L Computation of multivariate normal probability Подпись: + L b,0 Подпись: (pb - a)(sign b) /a2 - 2pab + b2

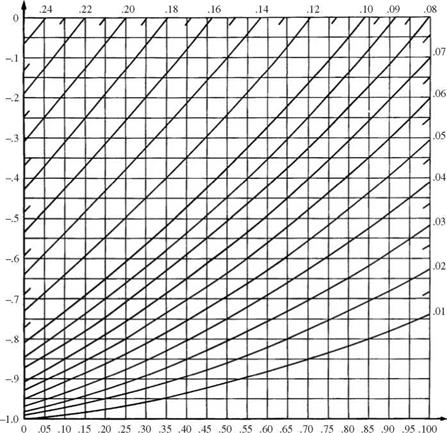
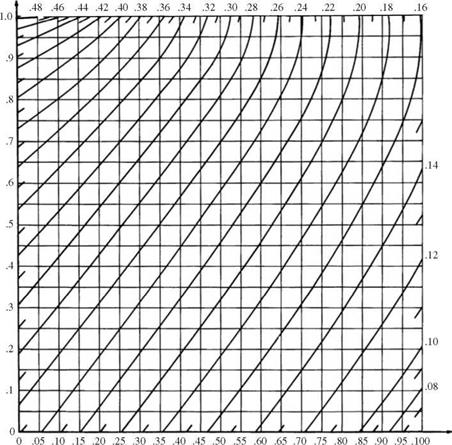
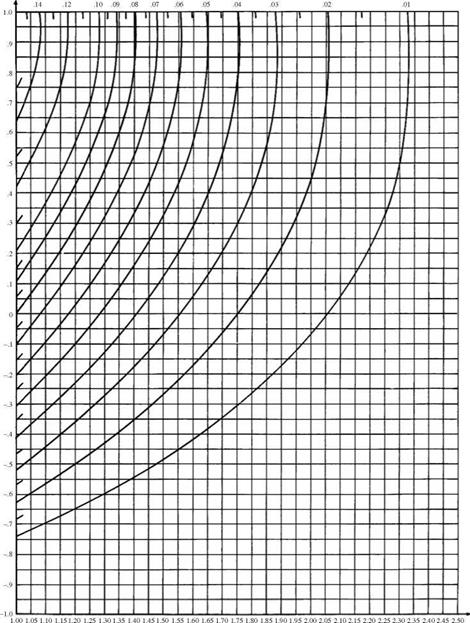
Bivariate normal probability. For abivariate case, Fortran computer programs for computing the lower left volume under the density surface, that is, Ф(а, b | p) = P(Z1 < a, Z2 < b | p), have been developed by Donnelly (1973) and Baughman (1988). The double integral for evaluating the bivariate normal probability can be reduced to a single integral as shown in Eq. (2.111). Sev­eral approximations have been derived (Johnson and Kotz, 1976). Derivation of bounds for the bivariate normal probability is presented in Sec. 2.7.3. For a bivariate normal probability, exact solutions have been obtained in the form of figures such as Fig. 2.28 for computing the upper-right volume under the bivari­ate standard normal density surface, that is, L(a, b | p) = P (Z1 > a, Z2 > b | p), in which L(a, b | p) can be expressed in terms of L(a, 0 | p) as

0, if (ab > 0 or ab = 0) and a + b > 0

1, Подпись: (2.117)otherwise 2

P

Computation of multivariate normal probability

L(a, 0lp) for 0 < a < 1 and -1 < p < 0.

Values for a < 0 can be obtained using L(a, 01—p) = 0.5 – L(-a, 0lp)

Figure 2.28 Bivariate normal cumulative distribution function. (After Abramowitz and Stegun, 1972.)

The relationship between Ф^, b | p) and L(a, b | p) is

Ф(a, b | p) = —1 + Ф^) + Ф(Ь) + L(a, b | p) (2.118)

From the definitions of Ф^, b | p) and L(a, b | p) and the symmetry of the bivari­ate normal PDF, the following relations are in order:

Ф^, to| p) = Ф^) Ф(то, b | p) = Ф(Ь) (2.119a)

L(a, – to | p) = 1 – Ф^) L(-to, b | p) = 1 – Ф(Ь) (2.119b)

P

Computation of multivariate normal probability

L(a, 0lp) for 0 < a < 1 and 0 < p < 1.

Values for a < 0 can be obtained using L(a, 01—p) = 0.5 – L(-a, 0lp) Figure 2.28 (Continued)

L(a, b | p) = L(b, a | p) (2.119c)

L(-a, b | p) + L(a, b | —p) = 1 – Ф(Ь) (2.119d)

L(-h, —k | p) — L(k, h | p) = 1 — Ф(К) — Ф(к) (2.119e)

Example 2.21 Consider two correlated normal random variables X1 and X2 with

their statistical properties being

E(X1) = 10 Var(X1) = 9 E(X2) = 5 Var(X2) = 4 Cov(Xb X2) = 3.6

Compute P(X1 < 13, X2 < 3).

Computation of multivariate normal probability

p


h


Figure 2.28 (Continued)


Computation of multivariate normal probability

L(a, 0ip) for a > 1 and -1 < p < 1.

Values for a < 0 can be obtained using L(a, 01-p) = 0.5 – L(-a, 0lp)

Solution Based on the given information, the correlation coefficient between X1 and X2 is

Cov( X ь X2) 3.6 n„

P1,2 = ————————- = r – r – = 0.6

&X2 V9v4

Then

Подпись: P1,2 = 0.6P(X! < 13, X2 < 3) = PIZ! < 13 – 10, Z2 < 3-5

= P(Zi < 1, Z2 < -11 P1,2 = 0.6) = ф(а = 1, b = -11 P12 = 0.6)

By Eq. (2.118),

Подпись: (a)Ф(1,-1|0.6) = -1 + Ф(1) + Ф(-1) + Д1, —1|0.6) Since ab = -1 < 0, according to Eq. (2.117),

,|й6)=К Чж)+К-Чж)- 2

= Д1, 0 | 0.894) + Д-1, 0 | 0.894) – 0.5

From Fig. 2.28b, Д1, 0 | 0.894) = 0.159. Since Д-1, 0 | 0.894) = 0.5 – L(1, 0 | -0.894), and according to Fig. 2.28a, by extrapolation, Д1, 0 | —0.894) = 0.004,

Д-1,0 | 0.894) = 0.5 – 0.004 = 0.496

Consequently, Д1, -11 0.6) = 0.159 + 0.496 – 0.5 = 0.155.

According to (a), the bivariate normal probability is Ф(1, -11 0.6) = Д1, -11 0.6) = 0.155. Alternatively, the bivariate normal probability can be computed by Eq. (2.121), and the result of the numerical integration for this example is 0.1569.

Multivariate normal probability. Johnson and Kotz (1976) show that if the correla­tion coefficient pij can be expressed as pij = XiXj for all i and j and |Xj | < 1, then each correlated standard normal random variable Zk can be represented by

Zk = Xk Z0 + J1 – Zk for k = 1> 2> ••• > K

where Z0, Z1, Z2,…, Z’Kare independent standard normal variables. The in­equality Zk < zk can be expressed as

iyl zk – Xkz0

Zk < —/

Подпись: Ф( г | Rx) Подпись: Ф (u) Computation of multivariate normal probability Подпись: Zk - Aku Подпись: du Подпись: (2.120)

Then the multivariate normal probability can be calculated as

Подпись: Ф( г | Rx) Computation of multivariate normal probability Подпись: zk J~pu /1 — P Подпись: du Подпись: (2.121)

As can be seen from Eq. (2.120), the computation of the multivariate normal probability is reduced from multiple integrals to a single integral for which the result can be obtained accurately by various numerical integration techniques. (see Appendix 4A) Under the special case of equicorrelation, that is, ptj = p, for all i and j, the multivariate normal probability can be computed as

This equation, in particular, can be applied to evaluate the bivariate normal probability.

Подпись: dФ( z | p) Computation of multivariate normal probability Computation of multivariate normal probability Подпись: Zk fpu /1 - p Подпись: K=1 K E E ak (u)aj (u)Apkj k = 1 j = k + 1 Подпись: du

Under the general unequal correlation case, evaluation of multivariate nor­mal probability by Eq. (2.120) requires solving for K A’s based on K(K – 1)/2 different values of p in the correlation matrix Rx. This may not necessarily be a trivial task. Ditlevsen (1984) proposed an accurate algorithm by expanding Ф(г | Rx) in a Taylor series about an equal correlation pij = p > 0, for i = j. The equicorrelation p is determined in such a way that the first-order expansion term dФ(z | p) vanishes. The term dФ(z | p) can be expressed as

Подпись: where Подпись: ak (u) = ф Подпись: zk Jpu /1 - p Подпись: Zk fpu /1 - p Подпись: (2.123)

(2.122)

and Apij = pij – p. In computing the value of d Ф^ | p), numerical integration generally is required. However, one should be careful about the possible nu­merical overflow associated with the computation of ak (u) as the value of u gets large. It can be shown that by the L’Hospital rule, limu^TO ak(u) = 0 and

limu^-TO ak (u) = u.

Determination of the equicorrelation p for the expansion point can be made through the iterative procedure, as outlined in Fig. 2.29. A sensible starting value for p is the average of pij:

Подпись: (2.124)— 2

p = K (K – 1) ^ pij

KJ

Подпись: Figure 2.29 Flowchart for determining the equicorrelation in a Taylor series expansion.

Once such p is found, Ditlevsen (1984) suggests that the value of Ф(г | Rx) can be estimated accurately by a second-order approximation as

Ф(г |Rx) ^ Ф(г | p) + 1 d2Ф(г | p) (2.125)

Подпись: d2Ф(г | p) Подпись: 1 4(1 - p )2 Computation of multivariate normal probability Подпись: Zk — Vpu V1 — p

in which Ф(г | p) is computed by Eq. (2.121), and the second-order error term is computed as

KKKK

Подпись: du(u)aj (u)a, r (u)as(u)(—br )Sir (—bs)SjsApij Aprs

i = 1 j = 1 r = 1 s = 1

(2.126)

Подпись: bk (u) Подпись: zkJ~P u ak(u)/1 - p Подпись: (2.127)

where Sir is the Kronecker’s delta, having a value of 1 if i = r and otherwise 0, and

As can be seen, the evaluation of Ф(z |Rx) is reduced from a multiple integral to a single integral, which can be executed efficiently and accurately by many numerical integration algorithms.

Подпись: Ф(-г) Computation of multivariate normal probability Подпись: z Computation of multivariate normal probability

For the univariate normal distribution, an asymptotic expansion of Ф(гО is (Abramowitz and Stegun, 1972) for z

(2.128)

Подпись: Ф(^ |Rx) Подпись: exp(- 2zt Rx1 z) VIRx| Пf= 1 ak Подпись: for |z |^ж Подпись: (2.129)

This expansion for Ф(z) is smaller than every summand with an odd number of terms and is larger than every summand with an even number of terms. The truncation error decreases as the number of terms increases. Note that Eq. (2.128) is particularly appropriate for evaluating the normal tail probabil­ity. The expansion has been generalized by Ruben (1964) for the multivariate normal distribution as

in which the coefficients ak are elements in a vector a obtained from

Подпись: (2.130)a= Rx 1z

It should be noted that Eq. (2.130) is valid only when all coefficients ak are positive. The right-hand-side of Eq. (2.129) provides an upper bound for the multivariate normal probability.

Multivariate normal distributions

Multivariate normal distributions

A bivariate normal distribution has a PDF defined as

for k = 1 and 2. As can be seen, the two random variables having a bivariate normal PDF are, individually, normal random variables. It should be pointed out that given two normal marginal PDFs, one can construct a bivariate PDF that is not in the form of a bivariate normal as defined by Eq. (2.108).

Multivariate normal distributions Multivariate normal distributions Multivariate normal distributions

According to Eq. (2.17), the conditional normal PDF of X11 x2 can be ob­tained as

(2.109)
>■;

Подпись: 0.1

Подпись: 0 Подпись: p = 0.0 Подпись: 0 Подпись: 2
Multivariate normal distributions
Подпись: 0
Multivariate normal distributions
Подпись: p = - 0.8
Multivariate normal distributions
Подпись: 0
Подпись: 0.2
Подпись: 0
Подпись: 2
Подпись: 2
Подпись: p = - 0.4
Подпись: 0.2
Подпись: 2
Подпись: 2
Подпись: 2

.H.

Multivariate normal distributions Multivariate normal distributions Multivariate normal distributions Multivariate normal distributions Multivariate normal distributions Multivariate normal distributions Multivariate normal distributions Multivariate normal distributions Multivariate normal distributions

0.1

Multivariate normal distributionsMultivariate normal distributionsMultivariate normal distributionsMultivariate normal distributionsMultivariate normal distributionsMultivariate normal distributionsFigure 2.26 Three-dimensional plots of bivariate standard normal probability density functions. (After Johnson and Kotz, 1976.)

Multivariate normal distributions

O1 > O2 Oj = O2 O1 < O2

Multivariate normal distributions


x2


Multivariate normal distributions

в = 135° XJ


Multivariate normal distributionsMultivariate normal distributionsMultivariate normal distributionsMultivariate normal distributions

Multivariate normal distributions

Figure 2.27 Contour of equal density of bivariate standard normal probability density func­tions. (After Johnson and Kotz, 1976.)

for —to < x1 < to. Based on Eq. (2.109), the conditional expectation and variance of the normal random variable X11 x2 can be obtained as

E(X1 | x2) = P1 + P12(ff1/V2)(x2 – P2) (2.110)

Var(X11 x2) = (1 – P22) (2.111)

Expressions of the conditional PDF, expectation, and variance for X2 | x1 can be obtained immediately by exchanging the subscripts in Eqs. (2.109) through (2.111).

Подпись: for —TO < x < TO (2.112)

Подпись: , , . IC,-1!1'2 f-(x) = ГПт exp
Подпись: (x f-lx) Cx (x f-lx)

For the general case involving K correlated normal random variables, the multivariate normal PDF is

in which і, = (д1, p.2,…, /гК )t, a К x 1 column vector of the mean values of the variables, with the superscript t indicating the transpose of a matrix or vector, and Cx is a К x К covariance matrix:

^11

012

■ ‘ ‘ p1K

021

022

■ ■ ■ 02K

Pk 1

pK 2

■ ■ ■ °KK_

Cov(X) = С, =

This covariance matrix is symmetric, that is, Pjk = okj, for j = k, where ajk = Cov(Xj, Xk). In matrix notation, the covariance matrix for a vector of random variables can be expressed as

Подпись: (2.113)С, = E [(X — і,)(X — і,)4

Подпись: | R —111'2 ( 1 Ф (z) = (2;) К /2 exp (- 2zt R— z Подпись: for —TO < z < TO Подпись: (2.114)

In terms of standard normal random variables, Zk = (Xk — ik)’ak, the stan­dardized multivariate normal PDF, can be expressed as

in which Rx = Cz = E (ZZ *) is a К x К correlation matrix:

1

P12 ■

■ P1K

P21

1 ■

■ P2K

PK1

PK2 ■

■ 1

Corr(X) = Cov(Z) = Rx =

with pjk = Cov(Zj, Zk) being the correlation coefficient between each pair of normal random variables Xj and Xk. For bivariate standard normal variables,

Multivariate normal distributions Подпись: (2m)!(2n)! minm,n) (2p^)2і 2m+n (m - І)!(n - І)! (2j)! (2m + 1)!(2n + 1)! (2p12)2 j 2m+n P12 (m - І )!(n - j )!(2j + 1)! E [Z2mZ2n+1 ] = 0 (2.115)

the following relationships of cross-product moments are useful (Hutchinson and Lai, 1990):

for m and n being positive integer numbers.

Multivariate Probability Distributions

Multivariate probability distributions are extensions of univariate probability distributions that jointly account for more than one random variable. Bivari­ate and trivariate distributions are special cases where two and three random variables, respectively, are involved. The fundamental basis of multivariate probability distributions is described in Sec. 2.3.2. In general, the availability of multivariate distribution models is significantly less than that for univari­ate cases. Owing to their frequent use in multivariate modeling and reliabil­ity analysis, two multivariate distributions, namely, multivariate normal and multivariate lognormal, are presented in this section. Treatments of some mul­tivariate nonnormal random variables are described in Secs. 4.5 and 7.5. For other types of multivariate distributions, readers are referred to Johnson and Kotz (1976) and Johnson (1987).

Several ways can be used to construct a multivariate distribution (Johnson and Kotz, 1976; Hutchinson and Lai, 1990). Based on the joint distribution dis­cussed in Sec. 2.2.2, the straightforward way of deriving a joint PDF involving K multivariate random variables is to extend Eq. (2.19) as

f x(x) = f 1(X1) X f 2(X2 | X1) X—X fK(X1, X2, . . ., Xk-1) (2.105)

in which x = (x1, x2,…, xK)t is a vector containing variates of K random vari­ables with the superscript t indicating the transpose of a matrix or vector. Ap­plying Eq. (2.105) requires knowledge of the conditional PDFs of the random variables, which may not be easily obtainable.

One simple way of constructing ajoint PDF of two random variables is by mix­ing. Morgenstern (1956) suggested that the joint CDF of two random variables could be formulated, according to their respective marginal CDFs, as

F 1,2(xb x2) = Fhx1)F2(x2){1 + в[1 – F 1(x1)][1 – F2(x2)]} for -1 < в < 1

(2.106)

in which Fk(xk) is the marginal CDF of the random variable Xk, and в is a weighting constant. When the two random variables are independent, the weighting constant в = 0. Furthermore, the sign of в indicates the positive­ness or negativeness of the correlation between the two random variables. This equation was later extended by Farlie (1960) to

F1,2(xb x2) = F1U1)F2(x2)[1 + ef 1U1)f2(x2)] for-1 < в < 1 (2.107)

in which fk (xk) is the marginal PDF of the random variable Xk. Once the joint CDF is obtained, the joint PDF can be derived according to Eq. (2.15a).

Constructing a bivariate PDF by the mixing technique is simple because it only requires knowledge about the marginal distributions of the involved random variables. However, it should be pointed out that the joint distribu­tion obtained from Eq. (2.106) or Eq. (2.107) does not necessarily cover the entire range of the correlation coefficient [-1, 1] for the two random variables under consideration. This is illustrated in Example 2.20. Liu and Der Kiureghian (1986) derived the range of the valid correlation coefficient value for the bivariate distribution by mixing, according to Eq. (2.106), from various combinations of marginal PDFs, and the results are shown in Table 2.4.

Nataf (1962), Mardia (1970a, 1970b), and Vale and Maurelli (1983) proposed other ways to construct a bivariate distribution for any pair of random variables. This was done by finding the transforms Zk = t(Xk), for k = 1, 2, such that Z1 and Z2 are standard normal random variables. Then a bivariate normal distri­bution is ascribed to Z1 and Z2. One such transformation is zk = Ф-1[^(xk)], for k = 1, 2. A detailed description of such a normal transformation is given in Sec. 4.5.3.

Example 2.20 Consider two correlated random variables X and Y, each ofwhich has a marginal PDF of an exponential distribution type as

fx(x) = e—x for x > 0 fy(y) = e—y for y > 0

To derive a joint distribution for X and Y, one could apply the Morgenstern formula. The marginal CDFs of Xand Y can be obtained easily as

Fx(x) = 1 — e—x for x > 0 Fy(y) = 1 — e—y for y > 0

According to Eq. (2.106), the joint CDF of X and Y can be expressed as

Fx, y(x, y) = (1 — e—x)(1 — e—y )(1 + вe—x—y) for x, y > 0

Then the joint PDF of X and Y can be obtained, according to Eq. (2.7a), as

fx, y(x, y) = e—x—y [1 + в(2e—x — 1)(2e—y — 1)] for x, y > 0

TABLE 2.4 Valid Range of Correlation Coefficients for the Bivariate Distribution Using the Morgenstern Formula

Marginal

distribution

N

U

SE

SR

T1L

T1S

LN

GM

T2L

T3S

N

0.318

U

0.326

0.333

SE

0.282

0.289

0.25

SR

0.316

0.324

0.28

0.314

T1L

0.305

0.312

0.27

0.303

0.292

T1S

0.305

0.312

0.27

0.303

0.292

0.292

LN

<0.318

<0.326

<0.282

<0.316

<0.305

<0.305

<0.318

GM

<0.318

<0.326

<0.282

<0.316

<0.305

<0.305

<0.318

<0.381

T2L

<0.305

<0.312

<0.270

<0.303

< 0.292

< 0.292

<0.305

<0.305

< 0.292

T3S

<0.305

<0.312

<0.270

<0.303

< 0.292

< 0.292

<0.305

<0.305

< 0.292

< 0.292

NOTE: N = normal; U = uniform; SE = shifted exponential; SR = shifted Rayleigh; T1L = type Ilargest value; T1S = type I smallest value; LN = lognormal; GM = gamma; T2L = type II largest value; T3S = type III smallest value. SOURCE : After Lin and Der Kiureghian (1986).

To compute the correlation coefficient between X and Y, one first computes the covari­ance of X and Y as Cov( X, Y) = E (XY) – E (X) E (Y ),in which E (XY) is computed by

f ж f ж a

E (XY) = xyfx, y(x, y) dxdy = 1 +-

J0 J0 4

Referring to Eq. (2.79), since the exponential random variables X and Y currently considered are the special cases of в = 1, therefore, xx = Xy = 1 and ax = ay = 1. Conse­quently, the covariance of X and Y is 0/4, and the corresponding correlation coefficient is 0/4. Note that the weighing constant 0 lies between [-1, 1]. The preceding bivariate exponential distribution obtained from the Morgenstern formula could only be valid for X and Y having a correlation coefficient in the range [-1/4, 1/4].

Distributions related to normal random variables

The normal distribution has been playing an important role in the development of statistical theories. This subsection briefly describes two distributions related to the functions of normal random variables.

Distributions related to normal random variables

Distributions related to normal random variables

Figure 2.23 Shapes of standard beta probability density functions. (After Johnson and Kotz, 1972.)


X2 (chi-square) distribution. The sum of the squares of K independent standard normal random variables results in a x2 (chi-square) random variable with K degrees of freedom, denoted as x2- In other words,

E z2 ~ xK (2-101)

k=і

in which the Zks are independent standard normal random variables. The PDF of a x 2 random variable with K degrees of freedom is

f x2(* I K) = 2k/2r1 K/2)x(K/2-1)e-x/2 for x > 0 (2.102)

Comparing Eq. (2.102) with Eq. (2.72), one realizes that the x2 distribution is a special case of the two-parameter gamma distribution with a = K/2 and в = 2. The mean, variance, and skewness coefficient of a xK random variable, respectively, are

ix = K aI = 2 K Yx = 2/v/K72

Thus, as the value of K increases, the x2 distribution approaches a symmetric distribution. Figure 2.24 shows a few x2 distributions with various degrees of freedom. If X1, X2,…, XK are independent normal random variables with the common mean ix and variance a2, the x2 distribution is related to the sample of normal random variables as follows:

1. The sum of K squared standardized normal variables Zk = (Xk – X)/ax, k = 1, 2,…, K, has a x2 distribution with (K – 1) degrees of freedom.

2. The quantity (K – 1)S2/a* has a x2 distribution with (K – 1) degrees of freedom in which S2 is the unbiased sample variance computed according to Table 2.1.

Distributions related to normal random variables

Figure 2.24 Shapes of chi-square probability density functions where d. f. refers to the degrees of freedom.

f-distribution. A random variable having a t-distribution results from the ratio of the standard normal random variable to the square root of the x2 random variable divided by its degrees of freedom, that is,

Z

Tk = (2.103)

Xk / K

in which Tk is a t – distributed random variable with K degrees of freedom. The PDF of Tk can be expressed as

Г[( K 4- 1)/21 / r2 -(K+1)/2

f t(r | K) = – + – 1 + for – TO < r < TO (2.104)

1 ж K r( K/2) K

A t-distribution is symmetric with respect to the mean /гг = 0 when K > 1. Its shape is similar to the standard normal distribution, except that the tails of the PDF are thicker than ф(z). However, as K ^to, the PDF of a t – distributed ran­dom variable approaches the standard normal distribution. Figure 2.25 shows some PDFs for t – random variables of different degrees of freedom. It should be noted that when K = 1, the t-distribution reduces to the Cauchy distribu­tion, for which all product-moments do not exist. The mean and variance of a t-distributed random variable with K degrees of freedom are

!i:r = 0 ol = K/(K – 2) for K > 3

When the population variance of normal random variables is known, the sample mean X of K normal random samples from N(p. r, o^) has a normal distribu­tion with mean /гг and variance ol /K. However, when the population variance is unknown but is estimated by S2 according to Table 2.1, then the quantity VK(X – /гг )/S, which is the standardized sample mean using the sample vari­ance, has a t-distribution with (K – 1) degrees of freedom.

Distributions related to normal random variables

t

Figure 2.25 Shapes of t-distributions where d. f. refers to degrees of freedom.

Beta distributions

The beta distribution is used for describing random variables having both lower and upper bounds. Random variables in hydrosystems that are bounded on both limits include reservoir storage and groundwater table for unconfined aquifers.

The nonstandard beta PDF is

Подпись: 1

Подпись: f NB(x | a, b, a, в) = ■WI. —j—r(x – a)a 1(b – x)e 1 for a < x < b B(a, в)(b – a)a+e-1 “ “

(2.96)

Подпись: Г(д)Г(в) na + в) Подпись: B(a, в) = Подпись: (2.97)

in which a and b are the lower and upper bounds of the beta random variable, respectively; a > 0, в > 0; and B(a, в) is a beta function defined as

Using the new variable Y = (X — a)/(b — a), the nonstandard beta PDF can be reduced to the standard beta PDF as

f B(y | а, в) = 1 Уа—1(1 — y)e—1 for 0 < y < 1 (2.98)

B(а, в)

The beta distribution is also a very versatile distribution that can have many shapes, as shown in Fig. 2.23. The mean and variance of the standard beta random variable Y, respectively, are

а ав

11У = а + в °У = (а + в + 1)(а + в )2 ‘

Beta distributions Подпись: for a < x < b Подпись: (2.100)

When а = в = 1, the beta distribution reduces to a uniform distribution as

Extreme-value distributions

Hydrosystems engineering reliability analysis often focuses on the statisti­cal characteristics of extreme events. For example, the design of flood-control structures may be concerned with the distribution of the largest events over the recorded period. On the other hand, the establishment of a drought- management plan or water-quality management scheme might be interested in the statistical properties of minimum flow over a specified period. Statistics of extremes are concerned with the statistical characteristics of Xmax, n = max{X1, X2,…, Xn} and/or Xmjn,„ = min{X1, X2,…, Xn} in which X1, X2,…, Xn are observations of random processes. In fact, the exact distributions of extremes are functions of the underlying (or parent) distribution that generates the ran­dom observations X1, X2,…, Xn and the number of observations. Of practi­cal interest are the asymptotic distributions of extremes. Asymptotic distribu­tion means that the resulting distribution is the limiting form of Fmax, n(y) or Fmin, n(y) as the number of observations n approaches infinity. The asymptotic distributions of extremes turn out to be independent of the sample size n and the underlying distribution for random observations. That is,

limn^x Fmax, n( y) = Fmax( y) limnxx Fmin, n( y) = Fmin( y)

Furthermore, these asymptotic distributions of the extremes largely depend on the tail behavior of the parent distribution in either direction toward the extremes. The center portion of the parent distribution has little significance for defining the asymptotic distributions of extremes. The work on statistics of extremes was pioneered by Fisher and Tippett (1928) and later was extended

by Gnedenko (1943). Gumbel (1958), who dealt with various useful applications of Xmax, n and Xmin, n and other related issues.

Three types of asymptotic distributions of extremes are derived based on the different characteristics of the underlying distribution (Haan, 1977):

Type I. Parent distributions are unbounded in the direction of extremes, and all statistical moments exist. Examples of this type of parent distribution are normal (for both largest and smallest extremes), lognormal, and gamma distributions (for the largest extreme).

Type II. Parent distributions are unbounded in the direction of extremes, but all moments do not exist. One such distribution is the Cauchy distribution (Sec. 2.6.5). Thus the type II extremal distribution has few applications in practical engineering analysis.

Type III. Parent distributions are bounded in the direction of the desired extreme. Examples of this type of underlying distribution are the beta dis­tribution (for both largest and smallest extremes) and the lognormal and gamma distributions (for the smallest extreme).

Owing to the fact that Xmin, n = – max{-X1, -X2,…, – Xn}, the asymptotic distribution functions of Xmax, n and Xmin n satisfy the following relation (Leadbetter et al., 1983):

Fmin(У) = 1 – Fmax(-y) (2.84)

Consequently, the asymptotic distribution of Xmin can be obtained directly from that of Xmax. Three types of asymptotic distributions of the extremes are listed in Table 2.3.

Extreme-value type I distribution. This is sometimes referred to as the Gumbel distribution, Fisher-Tippett distribution, and double exponential distribution. The CDF and PDF of the extreme-value type I (EV1) distribution have, respec­tively, the following forms:

x – f

~T~


FeV1( x | f, в) = exp ^ – exp


for maxima


(2.85a)


x – f

~T~


for minima


= 1 – exp – exp


+


Extreme-value distributions

TABLE 2.3 Three Types of Asymptotic Cumulative Distribution Functions (CDFs) of Extremes

Type

Maxima

Range

Minima

Range

I

exp(-e-y)

-го < y < ro

1 – exp(-ey)

-ro < y < ro

II

exp( – ya)

a < 0, y > 0

1 – exp[ ( y)a]

a < 0, y < 0

III

exp[ ( y )a ]

a > 0, y < 0

1 – exp( – ya)

a > 0, y > 0

Extreme-value distributions Подпись: for maxima (2.85b) for minima

y

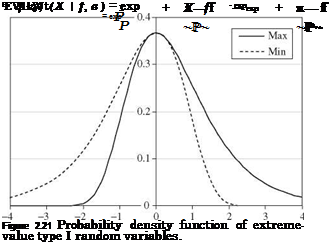
for —to < x, f < to, and P > 0. The shapes of the EV1 distribution are shown in Fig. 2.21, in which transformed random variable Y = (X — f )/p is used. As can be seen, the PDF associated with the largest extreme is a mirror image of the smallest extreme with respect to the vertical line passing through the common mode, which happens to be the parameter f. The first three product-moments of an EV1 random variable are

Px = A1 = f + °.5772p

for the largest extreme

= f — 0.5772P

for the smallest extreme

(2.86a)

= 1.645P2

for both types

(2.86b)

Kx = 1.13955

for the largest extreme

= -1.13955

for the smallest extreme

(2.86c)

The second – to fourth-order L-moments of the EV1 distribution for maxima are A2 = P ln(2) T3 = 0.1699 T4 = 0.1504 (2.87)

Using the transformed variable Y = (X — f )/p, the CDFs of the EV1 for the maxima and minima are shown in Table 2.3. Shen and Bryson (1979) showed

Подпись: XT 1 Подпись: rln( T1) _ln( T 2) Подпись: XT 2 Подпись: (2.88)

that if a random variable had an EV1 distribution, the following relationship is satisfied when f is small:

where xT is the quantile corresponding to the exceedance probability of 1/T.

Example 2.19 Repeat Example 2.17 by assuming that the annual maximum flood follows the EV1 distribution.

Solution Based on the values of a mean of 6000 ft3/s and standard deviation of 4000 ft3/s, the values of distributional parameters f and в can be determined as follows. For maxima, в is computed from Eq. (2.86b) as

Подпись: 4000 1.2826 Подпись: 3118.72 ft3/sв =

V1.645

and from Eq. (2.86a), one has

f = nQ – 0.577в = 6000 – 0.577(3118.72) = 4200.50 ft3/s

Подпись: P (Q > 10, 000) Extreme-value distributions

(a) The probability of exceeding 10,000 ft3/s, according to Eq. (2.85a), is

= 1 – exp[- exp(-1.860)]

= 1 – 0.8558 = 0.1442

(b) On the other hand, the magnitude of the 100-year flood event can be calculated as

У100 = g10° – f = – ln[- ln(1 – 0.01)] = 4.60

в

Hence q100 = 4200.50 + 4.60(3118.7) = 18,550 ft3/s.

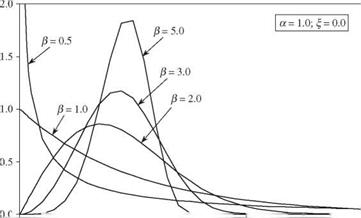
Подпись: f W(x | f, а, в) Подпись: а в Подпись: x - f Подпись: a-1 exp Extreme-value distributions Подпись: a- Подпись: for x > f and а, в > 0 (2.89)

Extreme-value type III distribution. For the extreme-value type III (EV3) distri­bution, the corresponding parent distributions are bounded in the direction of the desired extreme (see Table 2.3). For many hydrologic and hydraulic ran­dom variables, the lower bound is zero, and the upper bound is infinity. For this reason, the EV3 distribution for the maxima has limited applications. On the other hand, the EV3 distribution of the minima is used widely for modeling the smallest extremes, such as drought or low-flow condition. The EV3 distri­bution for the minima is also known as the Weibull distribution, having a PDF defined as

Подпись: FW(x | f, a, в) = 1 - exp Extreme-value distributions Подпись: a Подпись: (2.90)

When f = 0 and a = 1, the Weibull distribution reduces to the exponential dis­tribution. Figure 2.22 shows that the versatility of the Weibull distribution function depends on the parameter values. The CDF of Weibull random vari­ables can be derived as

Extreme-value distributions Подпись: (2.91a) (2.91b)

The mean and variance of a Weibull random variable can be derived as

Подпись: (2.92)І2 = в (1 – 2-1/a) Г 1 + 1

Generalized extreme-value distribution. The generalized extreme-value (GEV) distribution provides an expression that encompasses all three types of extreme – value distributions. The CDF of a random variable corresponding to the maxi­mum with a GEV distribution is

Extreme-value distributions

Extreme-value distributions

Fgev(x | f, a, в) = exp


for a = 0


(2.93)


Extreme-value distributions

I “————— 1————————– 1————————– f———————————————– і

0.0 0.5 1.0 1.5 2.0 2.5 3.0

x

Figure 2.22 Probability density functions of a Weibull random variable.


When a = 0, Eq. (2.93) reduces to Eq. (2.85a) for the Gumbel distribution. For a < 0, it corresponds to the EV2 distribution having a lower bound x > % + в/а, whereas, on the other hand, for a > 0, it corresponds to the EV3 distribution having an upper bound x < % + в/а. For |a| < 0.3, the shape of the GEV distribution is similar to the Gumbel distribution, except that the right-hand tail is thicker for a < 0 and thinner for a > 0 (Stedinger et al., 1993).

Extreme-value distributions Подпись: (2.94a) (2.94b) (2.94c)

The first three moments of the GEV distribution, respectively, are

where sign(a) is +1 or -1 depending on the sign of a. From Eqs. (2.94b) and (2.94c) one realizes that the variance of the GEV distribution exists when a > -0.5, and the skewness coefficient exists when a > -0.33. The GEV distri­bution recently has been used frequently in modeling the random mechanism of hydrologic extremes, such as precipitation and floods.

Extreme-value distributions Подпись: 6(2-a) Подпись: (2.95a) (2.95b) (2.95c)

The relationships between the L-moments and GEV model parameters are

Gamma distribution and variations

The gamma distribution is a versatile continuous distribution associated with a positive-valued random variable. The two-parameter gamma distribution has
a PDF defined as

f g(x | а, в) = 1 (x/в)а—1 ex/fl for x > 0 (2.72)

вГ(а)

in which в > 0 and а > 0 are the parameters and Г(») is a gamma function defined as

ta-1e-t dt


Г(а)


(2.73)


0


The mean, variance, and skewness coefficient of a gamma random variable having a PDF as Eq. (2.72) are

gx = A.1 = ав = ав2 Yx = 2/ja (2.74)

In terms of L-moments, the second-order L-moment is

Подпись: (2.75)вГ(а + 0.5)

^2 = ,—r( s

Gamma distribution and variations

(а)

where f is the lower bound. The two-parameter gamma distribution can be reduced to a simpler form by letting Y = X/в, and the resulting one-parameter gamma PDF (called the standard gamma distribution) is

Подпись: (2.78)f g(y | а) = –Цya V for y > 0 Г(а)

Tables of the cumulative probability of the standard gamma distribution can be found in Dudewicz (1976). Shapes of some gamma distributions are shown in Fig. 2.20 to illustrate its versatility. If а is a positive integer in Eq. (2.78), the distribution is called an Erlang distribution.

When а = 1, the two-parameter gamma distribution reduces to an exponential distribution with the PDF

f EXp(x | в) = e х/в/в for x > 0 (2.79)

An exponential random variable with a PDF as Eq. (2.79) has the mean and standard deviation equal to в (see Example 2.8). Therefore, the coefficient of

Подпись: Figure 2.20 Shapes of gamma probability density functions.

variation of an exponential random variable is equal to unity. The exponential distribution is used commonly for describing the life span of various electronic and mechanical components. It plays an important role in reliability mathe­matics using time-to-failure analysis (see Chap. 5).

Two variations of the gamma distribution are used frequently in hydrologic frequency analysis, namely, the Pearson and log-Pearson type 3 distributions. In particular, the log-Pearson type 3 distribution is recommended for use by the U. S. Water Resources Council (1982) as the standard distribution for flood frequency analysis. A Pearson type 3 random variable has the PDF

‘"’x"*,"-о)-ЩО) (it)w,2-80’

with a > 0, x > * when ft > 0 and with a > 0, x < * when ft < 0. When ft > 0, the Pearson type 3 distribution is identical to the three-parameter gamma distribution. However, the Pearson type 3 distribution has the flexibility to model negatively skewed random variables corresponding to ft < 0. Therefore, the skewness coefficient of the Pearson type 3 distribution can be computed, from modifying Eq. (2.74), as sign(^)2Д/а.

Gamma distribution and variations Подпись: ln(x) - * ] Gamma distribution and variations Подпись: -[ln(x)-* ]/e Подпись: (2.81)

Similar to the normal and lognormal relationships, the PDF of a log-Pearson type 3 random variable is

with a > 0, x > e* when ft > 0 and with a > 0, x < e* when ft < 0. Numerous studies can be found in the literature about Pearson type 3 and log-Pearson

type 3 distributions. Kite (1977), Stedinger et al. (1993), and Rao and Hamed (2000) provide good summaries of these two distributions.

Evaluation of the probability of gamma random variables involves computa­tions of the gamma function, which can be made by using the following recursive formula:

r(a) = (a – 1)r(a – 1) (2.82)

When the argument a is an integer number, then Г(а) = (a — 1)! = (a — 1)(a — 2) • •• 1. However, when a is a real number, the recursive relation would lead to r(a;) as the smallest term, with 1 < a’ < 2. The value of T(a7) can be determined by a table of the gamma function or by numerical integration on Eq. (2.73). Al­ternatively, the following approximation could be applied to accurately estimate the value of r(a;) (Abramowitz and Stegun, 1972):

5

r(a;) = Г(x + 1) = 1 + ^ aixl for 0 < x < 1 (2.83)

i = 1

in which a1 = -0.577191652, a2 = 0.988205891, a3 = -0.897056937, a4 = 0.4245549, and a5 = – 0.1010678. The maximum absolute error associated with Eq. (2.83) is 5 x 10⁻⁵.

Lognormal distribution

The lognormal distribution is a commonly used continuous distribution for posi­tively valued random variables. Lognormal random variables are closely related to normal random variables, by which a random variable X has a lognormal distribution if its logarithmic transform Y = ln(X) has a normal distribution with mean xln x and variance оЩx. From the central limit theorem, if a natural process can be thought of as a multiplicative product of a large number of an independent component processes, none dominating the others, the lognormal
distribution is a reasonable approximation for these natural processes. The PDF of a lognormal random variable is

ln( x) Mln x

Oln x


2


Lognormal distribution

for x > 0 (2.65)


Lognormal distribution

which can be derived from the normal PDF. Statistical properties of a lognor­mal random variable in the original scale can be computed from those of log – transformed variables as

Mx — A — exp ^ Mln x + j (2.66a)

el — МІ [exp (°-l2nx) – 1] (2.66b)

^2 — exp (ol2nx) – 1 (2.66c)

Kx — ^3 + 3^x (2.66d)

Lognormal distribution Подпись: ln(Mx) Lognormal distribution Подпись: Oln x Подпись: (2.67a) (2.67b)

From Eq. (2.66d), one realizes that the shape of a lognormal PDF is always positively skewed (Fig. 2.19). Equations (2.66a) and (2.66b) can be derived easily by the moment-generating function (Tung and Yen, 2005, Sec. 4.2). Conversely, the statistical moments of ln(X) can be computed from those of X by

It is interesting to note from Eq. (2.67b) that the variance of a log-transformed variable is dimensionless.

Подпись: A2 — exp Lognormal distribution Подпись: exp Подпись: Mln x + Lognormal distribution Подпись: 1
Lognormal distribution Lognormal distribution

In terms of the L-moments, the second-order L-moment for a two – and three – parameter lognormal distribution is (Stedinger et al., 1993)

(2.68)

in which erf( ) is an error function the definitional relationship of which, with

Ф(г) is

2 fx 2 fx

erf(x) — ^= e~“2 du — e-Z/2 dz — 2Ф(^/2x) – 1 (2.69)

Vn Jo vn Jo

Hence the L-coefficient of variation is r2 — 2Ф(о1пx Д/2) – 1. The relationship between the third- and fourth-order L-moment ratios can be approximated by the following polynomial function with accuracy within 5 x 10⁻⁴ for | r2 | < 0.9 (Hosking, 1991):

T4 — 0.12282 + 0.77518т32 + 0.12279т34 – 0.13638t36 + 0.11386r38 (2.70)

Подпись:Lognormal distribution

Lognormal distribution

0.6

0.5

z

i – J

0.3 0.2 0.1 0

Since the sum of normal random variables is normally distributed, the prod­uct of lognormal random variables also is lognormally distributed (see Fig. 2.15). This useful reproductive property of lognormal random variables can be stated as if X1,X2,…,XK are independent lognormal random variables, then W = b0nK= 1 Xbb has a lognormal distribution with mean and variance as

K K

M-ln w = ln(b0) + 53 bk M-lnXk °ln w =53 bk alnxk

к = 1 k = 1

In the case that two lognormal random variables are correlated with a corre­lation coefficient pXyy in the original scale, then the covariance terms in the

log-transformed space must be included in calculating аЩ w. Given px, y, the cor­relation coefficient in the log-transformed space can be computed as

Corr(ln X, lnY) = Pln x, ln y = , ln(1 + Px’yUx Uy) (2.71)

^ln(1 + Д2) x ln(1 + Д2)

Derivation of Eq. (2.71) can be found in Tung and Yen (2005).

Example 2.18 Re-solve Example 2.17 by assuming that the annual maximum flood magnitude in the river follows a lognormal distribution.

Solution (a) Since Q has a lognormal distribution, ln( Q) is normally distributed with a mean and variance that can be computed from Eqs. (2.67a) and (2.67b), respectively, as

Qq = 4000/6000 = 0.667 afn Q = ln(1 + 0.66 72) = 0.3 68 MlnQ = ln(6000) – 0.368/2 = 8.515

The probability of the annual maximum flood magnitude exceeding 10,000 ft3/s is P (Q > 10, 000) = P [ln Q > ln(10, 000)]

= 1 – P [Z < (9.210 – 8.515)/V0.368]

= 1 – Ф(1.146) = 1 – 0.8741 = 0.1259

(b) A 100-year flood qw0 represents the event the magnitude of which corresponds to P(Q > <7100) = 0.01, which can be determined from

P(Q < 7100) = 1 – P(Q > 7100) = 0.99

because P(Q < 7100) = P [ln Q < ln(q100)]

= P {Z < [ln(7100) – Mln Q]/oln Q1

= P{Z < [ln(q100) – 8.515]/V0.368}

= Ф{[1п(7100) – 8.515]Д/0.368} = 0.99 From Table 2.2 or Eq. (2.64), one can find that Ф(2.33) = 0.99. Therefore,

[ln(q100) – 8.5151Л/0.368 = 2.33

which yields ln(q100) = 9.9284. The magnitude of the 100-year flood event then is q100 = exp(9.9284) = 20, 500 ft3/s.