SLIDING DOORS

SLIDING DOORS
SLIDING DOORS
Подпись: Interior Door

Because they do not have to be sealed against the weather, interior doors are much simpler than exterior doors. Interior doors are used primarily for privacy and to control air flow. The doors themselves are typi­cally made of wood or composite wood products. They are 1% in. thick, and have either panels, like the one shown above, or a flush plywood veneer over a hollow core or solid core.

Hinged interior doors are usually prehung on a jamb without casings. The jamb on the hinged side is first nailed to the frame of the building, using shims to make it plumb. The jambs at the head and opposite side are then shimmed for proper clearance and nailed.

Some doors are hinged to a split jamb that will expand to accommodate some variation in wall thick­ness. Interior doors do not have sills and rarely have a threshold unless the floor material changes at the door.

The Nabatians of Petra, hydraulicians of the desert

Antigonus, the old one-eyed general of Alexandria, sought to solidify its domain in the Near East, between the domains of Ptolemy in Egypt and that of Seleucos in Mesopotamia. He coveted the wealth of the semi-nomad “barbarians” who frequented the routes of caravans carrying spices, myrrh, and incense from Maryab in Arabia Felix, to the south of the Dead Sea. In 312 BC, he sends his friend Athenes on an expedition toward the “formidable citadel”, the “rock” (petra in Greek) where these “barbarians” store their riches. Athenes does not come back alive. Antigonus then sends his son Demetrius to lay siege to Petra, again without success. Later, the Seleucids, new mas­ters of Syria, attempt the same exploit and also fail. These “barbarians”, objects of such envy for the successors of Alexander, call themselves the Nabatu. They likely came from central Arabia in the 5th century BC, and settled peacefully in the south of Palestine, left unpopulated by the deportation of the Assyrians and the Babylonians.

The Nabatian civilization becomes sort of a synthesis of the civilization of the ancient East and the new Hellenistic influences, since some degree of normal exchange continues during the wars with the Seleucids. Its golden age is at the very beginning of the Christian era before the Romans, new masters of Egypt, establish a direct maritime route toward the land of incense through Alexandria and the port of Myos Hormos on the Red Sea. In 106 AD, on the orders of Trajan, the kingdom of the Nabatians is peace­fully integrated with the Roman Empire, henceforth becoming the province of Arabia. The prosperity of the Nabatians is founded not only on the spice trade, but also on the technical prowess that enables them to farm the desert. This echoes the situation of the kingdom of Sheba, as we discussed in Chapter 3. Here, the main problem is to create arable land in the mineral wasteland of rocks and stones of the Negev desert. Weirs that partially block watercourses retain not only the annual floodwaters, but also and perhaps more importantly, they retain the silt conveyed by the floodwaters. This silt, accumulat­ed flood after flood, creates lands that eventually can be cultivated. This technique is surely inspired by earlier practices in Arabia Felix. But the reader may also recall the very ancient developments of Jawa and Khirbet el-Umbashi, in the Syrian-Jordanian desert (Figures 2.6 and 2.8). The technique will later be used by the Romans for the development of North Africa.

Under Nabatian control, the Negev becomes a land of immense orchards, farms, and villages, with roads, numerous water mills, and even cities like Oboda (today Advat) and Mampsis (Kurnub).

If Petra, the capital, is able to resist all attempts at conquest, it is because it is locat­ed on a site that is a natural fortress. The city is constructed in the valleys of the wadis, and served, thanks to the Nabatian techniques, by small dams. It is deeply entrenched in a tall sandstone massif, contoured by the combined actions of water and wind:

“The capital of the Nabatians is Petra; this is what it is called, for it is situated on a site that

■ wadis

deviation of the wadi Musa flood altitude above 950 m altitude above 1000 m (800) altitude in m A principal rock monuments

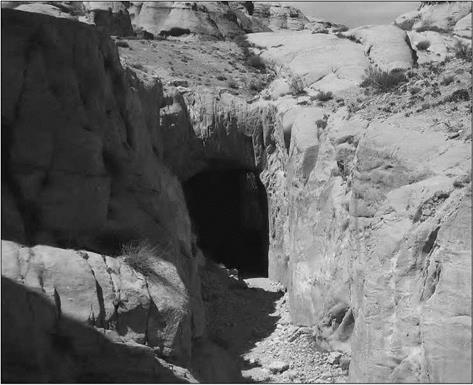
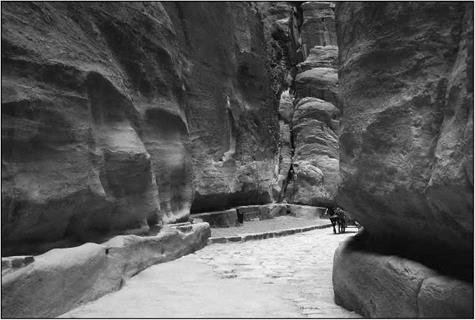
The site is accessible only through narrow gorges. The main route for access and communication, called Siq, is the gorge through which the Musa wadi, whose source is several kilometers to the east, penetrates the massif. This gorge is 1,500 m long, but only several meters wide (sometimes less than 3 m), and about a hundred meters deep. The wadi is usually dry, but the winter flood can be very sudden. To keep the Siq safely dry, once it had been transformed into a paved road, the Nabatians constructed a dam on the Musa wadi at its entry into the narrowest portion of the gorge. They also construct a tun­nel, 9 m high and 6 m wide and 88 m long, to redirect the flood waters toward the el – Mudhim wadi, then toward the el Metaha wadi, the flood waters rejoining their natural course at the city center (Figure 5.13).

This proj ect was very likely built at the beginning of the 1st century BC, at the same time as the planning for the urbanization of the city. The dam itself is 14 m high and 43 m long. The violence of the torrential rain, combined with the slope of the gullies and [196]
wadis (the bed of the Musa wadi, itself, has in the Siq a steep slope, around 40 m per kilometer), explains the rapidity of the floods. A recent hydrological study estimated that the maximum discharge of the Musa wadi flood must be about 200 m3/sec, reached in only one hour.[197] This dam was reconstructed in 1964, following the death of 24 tourists carried away by a sudden flood. Since then, the floodwaters have again drained through the Nabatian tunnel.

The city’s water supply is provided by aqueducts as well as by extended systems of dams, canals, reservoirs and cisterns collecting stormwater runoff. The first aqueduct was a channel which captured the spring water of the Musa wadi valley, and was built in the beginning of the 1 st century BC, then destroyed by a flash flood of the Musa wadi. It is rebuilt in the third quarter of the 1st century BC as a terracotta conduit following the right wall of the Siq, and complemented by the end of the 1st centuryAD by five other aqueducts, including a second aqueduct in the Siq (see photo fig5.13c), carved along the left wall of the Siq (Bellwald, 2006).

The Nabatians of Petra, hydraulicians of the desert

Figure 5.13b. The tunnel constructed by the Nabateans to redirect the flood waters of the Musa wadi towards the el-Mudhim wadi. The tunnel is, at its entrance, 9 m high and 6 m wide (photo by the author).

The Nabatians of Petra, hydraulicians of the desert

Figure 5.13 c. The Siq, which is the main access route to Petra, and which was the course of the Musa wadi before the dam and tunnel were constructed. On the right, the channel containing the terracotta aqueduct (dated by 25 BC), and on the left the channel of the other aqueduct constructed in the middle of the 1st century AD (photo by the author).

ATTACHING THE MUDSILL

Builders may attach new mudsills at different stages of form assembly. But here are the essen­tials. Before nailing up the mudsill (to the bot­tom of the pony-wall studs) predrill for anchor bolts, as described earlier, making sure that no bolt occurs under a stud. If local codes require metal termite shields, tack them to the under­side of the mudsill after first predrilling it with anchor-bolt holes. Then, using a pneumatic nailer, end-nail the sill to the studs, using two 16d nails per stud. If there isn’t enough room to end-nail upward into the sill, jack the mudsill tight to the studs and toenail down from the studs into the mudsill.

Once the mudsill is nailed to the studs, insert anchor bolts into the predrilled holes, screw on washers and nuts, and tie the free ends of the bolts to the rebar. At this point, the nuts should be just snug; you can tighten them down after the concrete has cured. If you end – nailed the mudsill, make sure the studs are tight to the top plates above: Jack up any studs that have separated. You may also need to brace the pony wall if it’s loose, which is often the case if you have to demolish siding to remove it. Pony walls should be plumb and aligned with the forms.

POURING CONCRETE

After installing the outside form boards, you are almost ready to pour. If you are using a 2-in. hose (interior diameter) to pump the concrete to the site, make sure there is at least a 3-in. clearance between the edge of the form board and the out­side edge of the new mudsill, to accommodate the width of the pump nozzle. If necessary, notch the forms so the nozzle can fit. The top of the form should be slightly higher than the bottom of the mudsill.

Fill the footing to the bottom of the wall forms before filling the forms. Some concrete may slop over from the walls onto the footing and bottom form boards, but slopover isn’t a problem if you remove the concrete from the form bottoms before it sets up. That will allow easy removal of the forms once the concrete has cured.

When the concrete begins to set, but is not completely hard, pull out the perforated steel stakes holding the bottom form boards in place. To do this, remove the duplex nails and then use either a pipe wrench to grip the stakes or a commercial stake puller. If you leave the stakes in till the next day, you’ll likely be able to pull them only if you remembered to oil them first.

Подпись: If I У . Vу 4.’-1 t.t Кв л ll Wi/fYw-r ШжТш image451This 2-in. (interior diameter) concrete-pump hose is easier to handle than a 3-in. hose. But its smaller diameter requires smaller, 7o-in. aggregate in the mix. Although a 2-in. hose is much lighter than a 3-in., tons of concrete pass through it—so you’ll need helpers to support the hose and move it to the pouring points.

Подпись: PROnP If you have a septic tank, show the driver of the concretemixer truck where the tank and fields lie, so he or she doesn't drive over and crush them. After the pour, make sure the driver doesn't rinse and empty the truck's residue on your yard. You may want to plant a lawn there someday. ■ ill

Time-Dependent Reliability Models

The development of hydrosystems engineering projects often includes the de­sign of various types of hydraulic structures, such as pipe networks for water supply, storm sewer systems for runoff collection, levee and dike systems for flood control and protection, and others. Generally, the system, once designed and constructed, is expected to serve its intended objectives over a period of several years, during which the system behavior and environmental factors could change with respect to time. In such circumstances, engineers often are interested in evaluating the reliability of the hydraulic structure with respect to a specified time framework. For example, one might be interested in the risk of overflow of an urban storm water detention basin in the summer when convective thunderstorms prevail. Loads to most hydrosystems are caused by the occurrence of hydrologic events such as floods, storms, or droughts that are random by nature. Time-dependent reliability analysis considers repeated applications of loads and also can consider the change of the distribution of resistance with time.

In preceding sections, emphasis was placed on static reliability analysis, which does not consider the time dependency of the load and resistance. This section considers the time-dependent random variables in reliability analysis. As a result, the reliability is a function of time, i. e., time dependent or time vari­ant. The difference between the time-to-failure analysis described in Chap. 6 and the time-dependent reliability analysis should be pointed out. The com­monality between the two reliability analyses is that both attempt to assess the variation of reliability with respect to time. The difference lies in the man­ner in which the reliability is computed. Time-to-failure analysis is concerned
only with the time history of the performance of the system as a whole without giving explicit consideration to the load-resistance interference as done by time – dependent reliability analysis. The objective of time-dependent reliability mod­els is to determine the system reliability over a specified time interval in which the number of occurrences of loads is a random variable.

When both loading and resistance are functions of time, the performance function W(t) = R(t) – L(t) is time-dependent. Consequently, the reliability Ps(t) = P [W(t) > 0] would vary with respect to time. Figure 4.19 shows schematically the key feature of the time-dependent reliability problem in which the PDFs of load and resistance change with time. In Fig. 4.19, the mean of resistance has a downward trend with time, whereas that of the load increases with time. As the standard deviations of both resistance and load increase with time, the area of interference increases, and this results in an increase in the failure probability with time. The static reliability analy­sis described in preceding sections considers neither load nor resistance being functions of time.

If the load is to be applied many times, it is often the largest load that is considered in reliability analysis. Then this maximum load can be described by an extreme-value distribution such as the Gumbel distribution described in Sec. 2.6.4. In doing so, the effect of time is ignored in reliability analysis, which may not be appropriate, especially when more than one load is involved or the resistance changes with time. A comprehensive treatment of time-dependent reliability issues can be found in Melchers (1999).

Time-Dependent Reliability Models

Time t

Figure 4.19 Time-dependence of load and resistance probability distribution functions.

What Makes a Good Frame?

When most people choose windows, they begin by considering the frame material. They might be predisposed to traditional wood or low-maintenance vinyl. However, according to Nils Petermann at the Efficient Windows Collaborative, the most important factor to consider is the frame’s durability. This is where I’d like to refer you to an in­dependent organization that provides unbi­ased durability ratings for window frames. Unfortunately, there isn’t one.

You can make educated guesses about durability based on the frame material. But whether it’s wood, vinyl, fiberglass, alumi­num, clad, or composite, a well-constructed window lasts longer and performs better than a poorly constructed one regardless of the relative benefits of its frame material.

The best way to get a sense of window quality is to read all the product literature you can get your hands on and to look at actual windows—a lot of them. Go to the big-box store and the local building supply, and open and close the windows on display, paying attention to how the corners are joined, how well the sashes seal, and how rigid the unit is.

On vinyl windows, look for continuous thermally welded corners. Examine the cor­ner cutaway displays of aluminum windows for a continuous thermal break in both frame and sash. On a clad window, the clad­ding should have well-sealed corners and gaskets to prevent water from getting behind the cladding. Aluminum is an excellent heat conductor, so be sure that aluminum clad­ding doesn’t contact conditioned interior air at any point.

Another way to sift through the options is to talk to reputable builders and architects in your area. Ask what windows they use and how long they have been using them. They won’t stick with windows that make their clients unhappy.

Thirty years ago, when single-pane win­dows were the rule rather than the excep­tion, companies looking to improve window performance focused their research on insulating glass. It was the lowest-hanging fruit. They’ve done such a good job that the R-value of insulated glass is good enough to make the window frame the weak link in the thermal chain. That’s one reason why manufacturers list performance data for relatively large windows, say, 4 ft. by 5 ft. (When you’re comparing windows, make sure the performance data are for windows of the same size.) Windows with large areas of glass yield better performance numbers because the frame is a smaller percentage of the window area. Savvy window designers understand this and tweak their windows ac­cordingly for optimal performance. By using strong materials that permit low-profile sills, sashes, and jambs, they minimize the size of

Подпись: Window AnatomyWhat Makes a Good Frame?Подпись: DOUBLE-GLAZED iNSULATED FiBERGLASSWhat Makes a Good Frame?To understand and appreciate how a window works,

■ you need to know the components that make up a basic window. While there are several types of windows besides the double-hung and casement illustrated here, the terminology used to describe each piece is universal.

Windows need to insulate

Sealed airspaces improve insulation. The more insulating spaces in the glass unit, the better the performance; triple­glazed windows are among the most energy efficient you can buy. Aluminum, vinyl, and fiberglass frames use extruded chambers both for strength and as a thermal break. Filling these cavities with foam provides additional insulation. Solid-wood frames are about as efficient as vinyl.

Window DNA: The NFRC Label by the Numbers

U-FACTOR

A measure of the insulating value. U-factor is the nonsolar heat flow through all parts of the window (glass, frame, and sash).

A lower number means better insulation and greater performance.

Подпись: SOLAR HEAT GAIN COEFFICIENT (SHGC) The percentage of the sun's solar heat that passes through the window. Higher numbers mean more passive solarheating potential. Подпись: AIR LEAKAGE (AL) A measure of the amount of air passing through the window as-sembly; a source of heat gain and loss. This optional rating is expressed in cubic feet per minute through a square foot of window. Look for ratings under 0.3; lower is better.

visiBLE TRANSMiTTANCE (vT)

A measure of the amount of vis­ible light that passes through the window. Values range from 0 to 1 (a higher number equals more light). However, most ratings are between 0.3 and 0.8 because they take into account the light blocked by the frame. Choose windows with higher VT to maxi­mize daylight and views.

CoNDENsAHoN RESiSTANCE

A relative scale from 0 to 100 — based on the window’s properties. It predicts the likelihood of con­densation, with higher numbers indicating less condensation.

the conductive frame while being sure to in­corporate materials that reduce air leakage.

Frame material can also influence how long a window stays airtight. Like most building materials, windows expand and contract with changes in temperature and humidity. When you see a window with moisture between panes, it’s likely that movement between the glass and the sash broke the insulating seal. By choosing stable materials, you can reduce stress on the seal and increase the window’s longevity. Fiber­glass expands at the rate of glass, while aluminum and vinyl expand respectively 3 times and 7 times more than glass. Wood moves in response to humidity changes rather than temperature.

REMOVING OLD FOUNDATIONS

To tear out an old foundation, you’ve got several options. All require safety glasses, hearing protec­tion, heavy gloves, a mask, patience, and a strong back. Before acquiring heavy and expensive equipment, try to break out a section of the old foundation using a 9-lb. sledgehammer and a 6-ft. pointed steel bar. Old concrete without rebar is often cracked and soft. Once you’ve removed a small section, the rest may come out easily.

If the concrete is too thick and hard, rent a towable air compressor and jackhammer. A 90-lb. jackhammer will break almost anything, but it’s a beast to maneuver; a 60-lb. hammer is light enough to lift onto a foundation wall and almost always strong enough to break a wall apart. A 60-lb. electric jackhammer is less powerful than a compressor-driven one, but it may have enough muscle to get the job done.

Or you can rent a gas-powered saw with a 10-in. concrete-cutting blade that cuts 4 in. to 5 in. deep, letting you cut the concrete into man­ageable chunks. A third option is rotohammering a line of 58-in. holes across the foundation and then splitting along that line with a large mason’s chisel and a hand sledge.

Should you encounter rebar, you’ll either need an acetylene torch to cut through it or a metal abrasive wheel in a circular saw or grinder. Rebar cutting is monstrously hard work. With the old foundation removed, you can excavate new foot­ings from outside the house and install forms for the concrete.

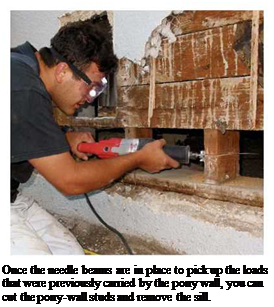
Подпись:Подпись: A 60-lb. jackhammer is powerful enough to bust concrete yet light enough to lift onto the foundation. Jackhammering is bone-rattling work, so have workers take turns at it. Подпись: POSITIONING Foundation FACES Подпись: Traditionally, the outside face of a foundation wall is flush to the edge of the house framing, allowing sheathing to overhang the foundation 1 in. or so, covering the joint between foundation and framing. However, contractors who install a lot of stucco argue that a foundation face flush to the outer face of the sheathing better protects the sheathing edge and creates a stucco edge that's less bulky—that is, one that sticks out less beyond the foundation wall. Whichever detail you prefer, drop a plumb bob to establish the foundation's outside face. If the foundation wall is 8 in. thick, measure back 8 in. from the plumb line to mark the foundation's inside face.

CONCRETE FORMWORK

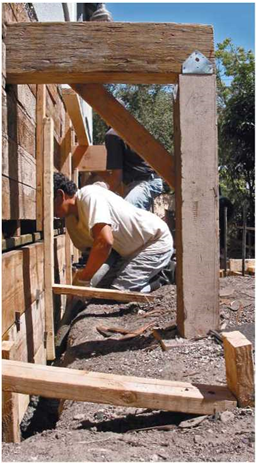
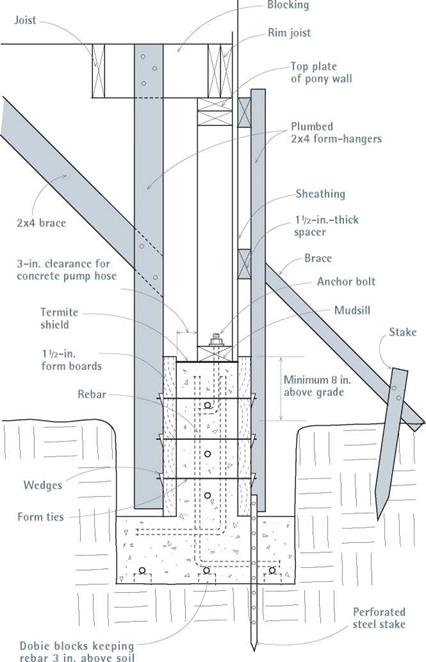
Correctly positioning 1 ^-in.-thick form boards can be tricky, and there are myriad ways to do so. Here’s a relatively foolproof method, in which you first erect the inner (house side) form walls, by nailing them to 2×4 form-hangers nailed to joists. This method also enables easy access for tying rebar, reattaching sills, and the like.

Inner form walls. If floor joists run perpendicu­lar to the foundation wall, start by nailing 2×4 form-hangers into the joists at both ends of the foundation wall section being replaced. The 2x4s should extend down into the foundation trench, stopping 1 in. or 2 in. above the tops of footing forms, if any. Position each 2×4 so its edge is exactly 9/2 in. from the outside face of the foun­dation (8-in.-thick concrete plus "2-in.-thick form board). First nail the bottom form board to the 2x4s; then add 2×4 form-hangers between the first two. Spacing 2×4 form-hangers every 32 in., use two 16d nails to nail them to each joist. Then stack additional form boards atop the first until the top board is slightly above the bottom of the mudsill. As shown in "Concrete Forms for a Shallow Foundation,” on p. 217, run diagonal 2×4 braces from joists to the 2×4 form-hangers to stiffen the inner form wall, thereby keeping it plumb and in place (see also the photos on p. 200 and on p. 216, left).

If the joists instead run parallel to the founda­tion, first add blocking between the rim joist and the first joist back, across the top of the pony wall. Nail the 2×4 form supports to the blocking, much as just described for perpendicular joists. Once the inside forms are complete, you can cut, bend, and assemble the rebar; attach the mudsill
to the pony-wall studs; and insert anchor bolts before build­ing the outside form walls. Even if local building codes don’t require steel-reinforced founda­tions, adding steel is money well spent (see "Adding Steel,” on p. 217).

Outer form walls. If your foun­dation is shallow and the sides of its trenches are cleanly cut, you may not need form boards for footings. But if your footings will have form boards, install them before building the foun­dation’s outer form walls.

If there are no footing form boards, drive 4-ft.-long perfor­ated steel stakes down into the footing area to secure the bot­tom form boards for the outer form walls. Plumb and space these stakes out 1 ‘h in. from the outside face of the foundation, to allow for the thickness of the form boards. Use two stakes per form board to get started.

Use 8d duplex nails to attach form boards to the steel stakes.

Install this first outer form board a little higher than the inner form board initially; then hammer the stakes down to achieve level. Note: You may need several tries to drive stakes that are plumb and accurately positioned because, during driv­ing, stake points are often deflected by rocks. Use a magnetic level to plumb the stakes.

Once the steel stakes are correctly posi­tioned and the bottom form boards are nailed to them, add 2×4 form-hangers so you can hang additional form boards above. But first, nail spacers to the pony-wall studs, to compen­sate for the thickness of the U2-in.-thick form boards. If the pony-wall studs are sheathed,

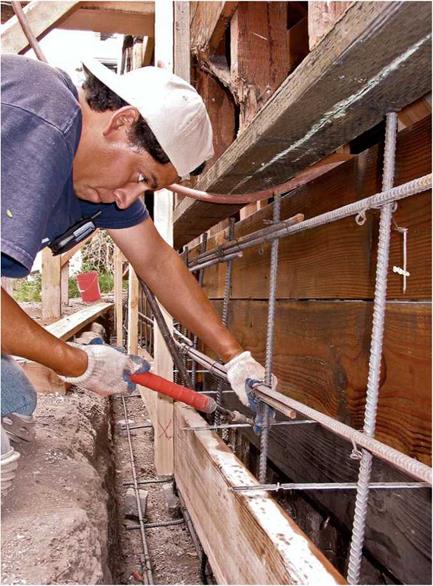
Подпись: Use prelooped wire ties to splice lengths of rebar, overlapping rebar sections at least 12 in. Note the cleanly cut sides of this trench, which will serve as forms for the poured foundation footings. An electric demolition hammer with a shovel bit was used to cut this dense soil. nail 1 й-in.-thick spacer boards to the studs, so the back face of the form boards lines up with the exterior sheathing. If the studs aren’t presently sheathed, nail up 2-in.-thick spacers to accommodate the thickness of the form boards and the sheathing to come. If the outer face of the foundation wall aligns to the face of the sheathing, you can easily cover that often- troublesome joint with siding.

As you install each form board atop the pre­ceding one, set the form ties that tie together inner and outer form boards. Form ties are designed to space the form boards exactly the right distance apart; they are available in 6-in., 8-in., 10-in., and 12-in. lengths. Use wire to tie the form ties to each vertical rebar, typically spaced 32 in. on center. At the ends of each form tie, insert metal wedges into the slots to keep
forms from spreading when filled with concrete. The top form board should overlap the mudsill slightly.

The outer form boards are braced by the plumbed 2×4 form-hangers, which are in turn supported by diagonal braces running back down to perforated steel stakes or to 2×4 stakes driven into the ground. Under the house, diagonal braces run from the inner form-hangers to the joists.

image443
image442

Note: After the pour, you’ll be able to remove form boards and steel stakes if you first sprayed them with form-release oil. But be careful not to spill the oil onto the rebar, anchor bolts, or old foundation, because the oil will weaken the bond with new concrete.

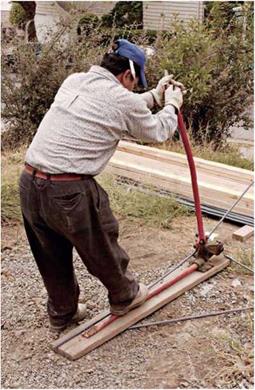
Подпись: To use this rebar cutter-bender, you feed rebar parallel with the base arm for bending, as shown, and perpendicular to the base arm when cutting.
image444
Подпись: In this example, foundation walls are flush to the sheathing, and the trench walls serve as forms for the footings. Details will vary slightly, depending on the direction of joist, (as described in the text) and on other framing particulars.

image445

Structural steel used in renovated foundations includes rebar, anchor bolts, to attach framing to concrete; pins (or dowels), which tie old founda­tions to new ones; and a plethora of metal connec­tors, including the popular Simpson Strong-Ties), which strengthen joints against earthquakes, high winds, and other racking forces.

Rebar. Rebar in foundations is not specified by all building codes, but it’s cost-effective insurance against cracking caused by lateral pressures of soil and water against foundations. Rebar can also eliminate concrete shrinkage cracks. Common sizes in residential construction are No. 3 (58 in. in diameter), No. 4 (52 in.), and No. 5 (58 in.). One common configuration is No. 4 rebar spaced every 32 in. or 48 in. on center.

In footings and foundation walls below grade, place rebar back 3 in. from forms and at least 3 in. above the soil. On the inner side of the foun­dation walls, rebar can be within 152 in. of the forms. You should run rebar the length of a foun­dation, tying the lengths together after overlapping them at least 12 in. Use prelooped wire ties to join them. (Wire ties don’t lend strength; they simply hold the bars in place before and during the pour.) Use wire ties to attach rebar to the anchor bolts, pins, form ties, and the like. Use a cutter-bender to cut and bend bars on small jobs. When rebar is delivered, store it above the ground—dirty rebar doesn’t bond as well.

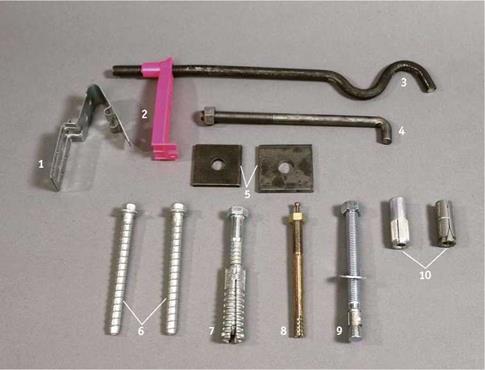
Подпись: Masonry anchors. 1, anchor bolt holder (monkey paw); 2, anchor bolt holder; 3, Simpson SSTB anchor bolt, used with seismic hold-downs; 4, J-bolt anchor; 5, square plate washers; 6, concrete screws (high- strength threaded anchors); 7, lag screw within expansion shield; 8, pin-drive expansion anchor; 9, wedge expansion anchor; 10, expansion shields for machine screws. Подпись: PROnP If you're retrofitting anchor bolts to existing mudsills, begin with a wood-cutting bit to drill through the sill. Then switch to a rotary hammer bit to drill into the concrete foundation. Because the tip of the wood bit invariably hits concrete as it clears wood, you'll ruin the bit before long. But rotary hammer bits are too slow and ineffective at cutting wood. llll image446Anchor bolts. Place й-in. or й-in. anchor bolts no more than 6 ft. apart in one-story house foun­dations and no more than 4 ft. apart in two-story foundations. In earthquake zones, 4-ft. spacing is acceptable, but conscientious contractors space the bolts every 3 ft. There should also be an anchor bolt no farther than 1 ft. from each end of the sills. For maximum grip, use square washers. When pouring a new foundation, use J-type anchor bolts; the plastic bolt holders shown in the photo on p. 202 will position the anchor bolts in the middle of the foundation wall.

When retrofitting bolts to existing founda­tions, use 58-in. all-thread rod cut to length. Rod lengths will vary according to code specs and sill thickness. For example, a 10-in. rod will accom­modate a washer, nut, and l-in.-thick mudsill and will embed 7 in. in the concrete. You can also buy precut lengths of threaded rod, called retrofit bolts, which come with washers and nuts. Drill through the mudsill into the concrete, clean out the holes well, inject epoxy, and then insert the rods and bolts. The procedure is essentially the same for epoxying rebar pins to tie new concrete to old.

Because bolts, all-thread rods, and other tie-ins are only as strong as the material around them, you should center bolt holes in the top of the old foundation and drill them 6 in. to 8 in. deep, or whatever depth local codes require. Use an impact drill if you’re drilling concrete. Drill
holes 58 in. larger than the diameter of the bolt so there’s room for epoxy. For example, for 58-in. all-thread rod, drill 54-in. holes; for 58-in. rod, drill 58-in. holes. Even if you oversize such holes, the bond probably won’t be weaker, but you may waste a lot of expensive epoxy.

Note: To anchor mudsills in retrofits, threaded rod and epoxy have largely replaced expansion bolts. These chemical bonds are almost always stronger than mechanical ones, and epoxy’s com­pressive strength is roughly four times greater than that of concrete.

Pins. Concrete cold joints are inherently weak. Cold joints occur when new concrete is butted against old or when separate pours create seams. To keep cold joints from separating, you need to join them with rebar pins. When drilling lateral holes to receive rebar pins that tie old walls to new (or secure a foundation cap), angle the drill bit slightly downward, so the adhesive you’ll inject into the hole won’t run out and so pins will be less likely to pull out.

Local codes and structural engineers will have the final say on sizing and spacing rebar pins. But, in general, drill 5й-іп. holes for й-in. rebar to be epoxied; drill holes at least every 58 in. and embed rebar at least 7 in. into the top of founda­tions, and at least 4 in. into the side of 8-in.-thick walls. Extend rebar epoxied into the old founda­tion at least 18 in. into new formwork, and over­lap rebar splices at least 58 in.

image447

Retrofitting anchor bolts requires drilling in tight spaces. Bolts should be centered in the sill and embedded at least 7 in. into the concrete.

STEP2 Install the Gable Truss

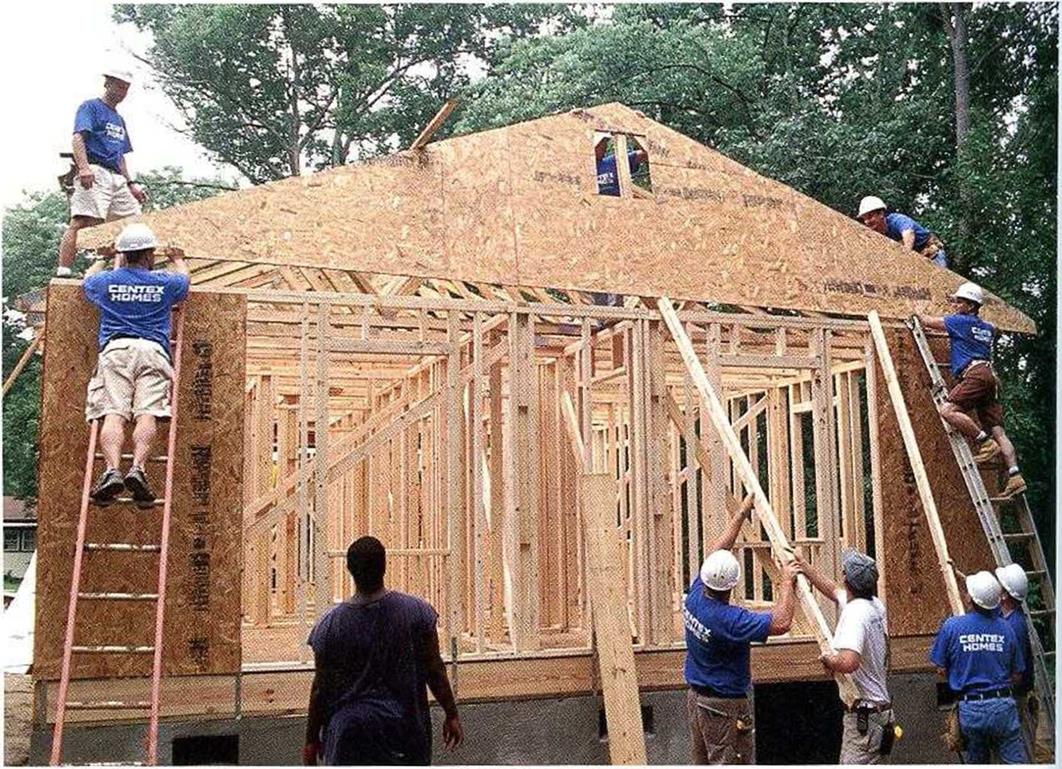
The first truss to be installed is the gable truss (also called an end truss or a rake truss) that rests on the top plate of an end wall. This truss is usually built differently from regular trusses. Instead of having angled web pieces, these end trusses often have vertical webbing spaced 16 in. or 24 in. o. c. to allow for easy installation of sheathing or siding.

Some carpenters like to sheathe end trusses with OSB and even finish siding before raising them upright (see the photo below). Another option is to cut all the sheathing pieces on the ground, raise the truss, and then nail the pre­cut sheathing in place. It is certainly easier to sheathe a truss on the ground, but it makes the truss substantially heavier and more clifti-

4

cult to handle. If you do decide to sheathe the trusses before raising them, let the sheathing lap down below the ceiling joist chord by a couple of inches. T he lap will be nailed to the top plates once the gable is raised upright. This helps ensure a strong union between the truss and the wall, which is especially impor­tant in windv areas.

4

Notch the gable-end truss

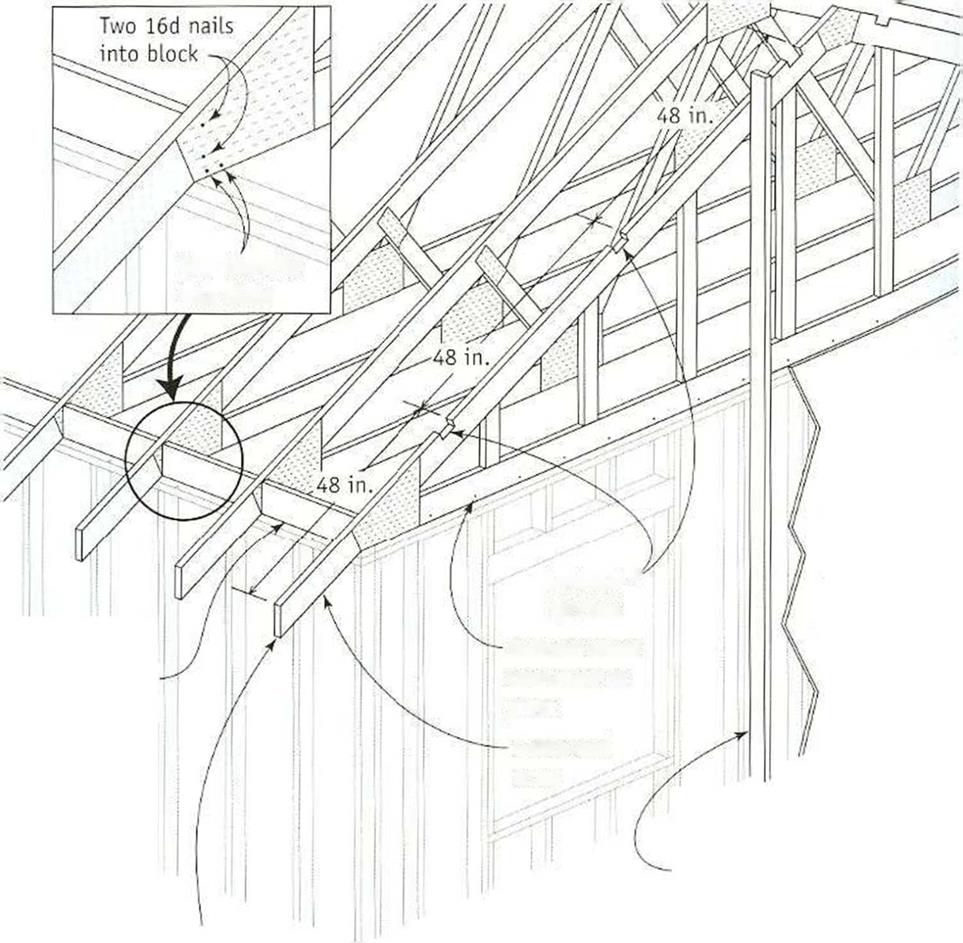
Notches for lookouts arc exceptions to the 11 never cut a truss" rule. Lookouts hold the barge rafters, which extend beyond the build-

STEP2 Install the Gable TrussINSTALLING THE LAST GABLE-END TRUSS. Unlike the other roof trusses, this one was sheathed on the ground and then hoisted into position.

ingline at each gable end to create a roof overhang (see the photos at right). Gable trusses can be notched because they are nailed directly over a load-bearing wall. As a result, the entire joist chord of each a gable-end truss is fully supported.

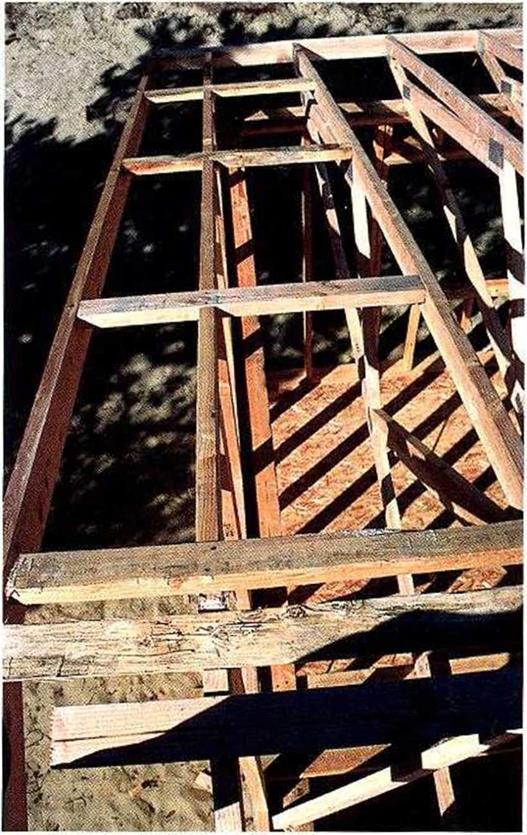
Its best to cut notches for 2×4 lookouts while the gable truss is still lying Hat. For the first lookout, measure and mark 48 in. from the end of the truss tail. Cut a 2×4 notch (which is actually I in. deep and 32 in. wide) below the first 48 in. mark and every 48 in. thereafter (see the illustration on p. 122). With the gutter hoard or fascia in place, 4-ft.-wide sheathing will fall on the lookouts.

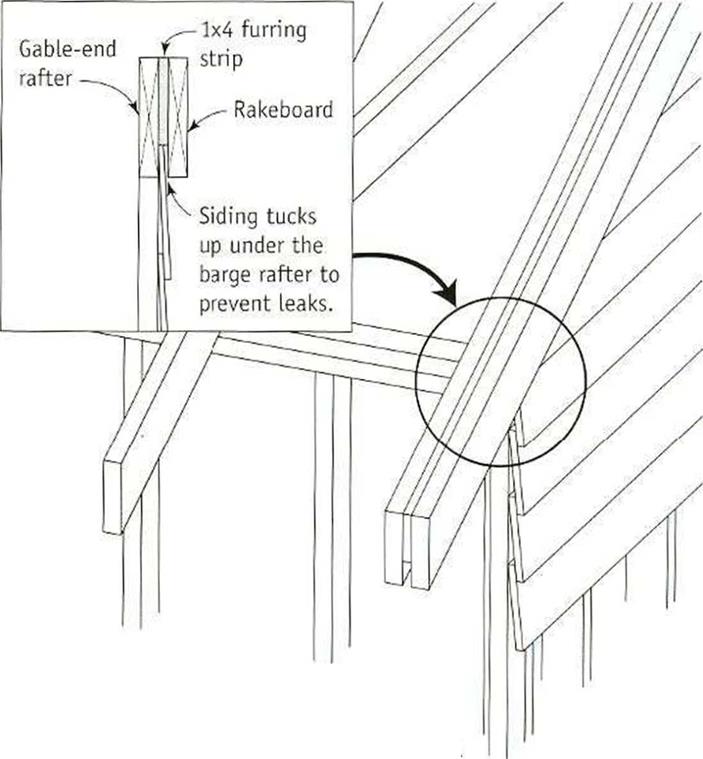
CHOOSING NOT TO NOTCH. Some houses (especially in northern areas) are designed without gable-end overhangs so that more sunlight can get into the house. If this is how you plan to build a house, lookouts or notches are not necessary. Instead, fur out the rake

4

board with lx lumber, so that t ic exterior siding tucks under it (see the illustration on p. 123).

Unless the trusses were set on the walls at the time of delivery, they must be hoisted onto the walls by hand (see the photo on p. 122). Oneway to do this is to set good, strong lad­ders at both corners of the building. If you’re dealing with long trusses, place a 2x in the center, from the ground to the top plate, at the same angle as the ladders. This way, two peo­ple can lift a truss, lay it against the ladders and the center 2x, and walk it up to the top. Another person in the middle with a notched pole can push on the truss as needed.

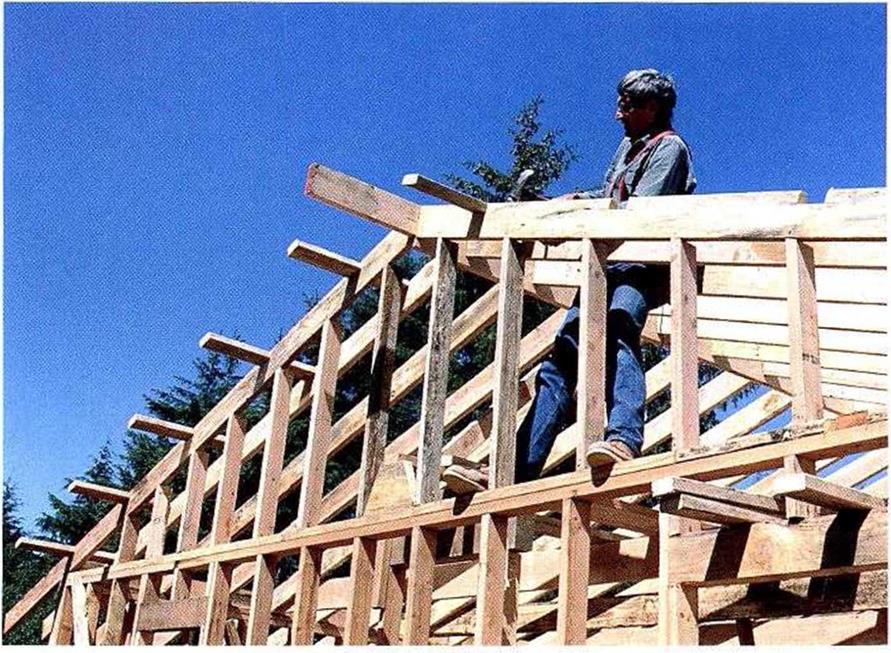
STEP2 Install the Gable TrussПодпись: MAKING GABLE-END NOTCHES. Whether you're installing trusses (see the photo at left) or traditional rafters and ridge boards (see the photo below), the gable-end rafters require notches every 4 ft. to hold the lookout boards that support the barge rafter. Each lookout butts against the face of the closest inboard rafter, where it's nailed fast. [Top photo Larry Haun; bottom photo Roger Turk. | STEP2 Install the Gable TrussIn preparation for installing the first truss the gable-end truss), I nail a long, straight.

STEP2 Install the Gable Truss

Helping Hand


Подпись:Be aware of wind. Take care with trusses while the wind is blowing. Sheathed trusses can catch the wind like a boat’s sail. Even bare trusses can be difficult to control. If it’s windy, have extra helpers on hand and use extra bracing to keep installed trusses in place.

Lookout ^ notches

Bottom chord toenailed to plate

Gable-end

truss


Frieze

block


Wall ^ sheathing


2×4 temporary brace nailed to wall to hold truss plumb


Position trusses side-to-side to give you an equal overhang at both eaves.


The gable-end truss is set in place first, followed by all the regular trusses.


STEP2 Install the Gable Truss

STEP2 Install the Gable TrussTRUSSES TAKE TEAM­WORK. A crew of four does a good job of getting roof trusses up on the walls. Using a long push stick, the ground worker helps elevate the truss.

temporary 2x brace on edge to the wall frame near the center of the end wall. This holds the gable-end truss stable until other braces are installed. If the truss is not too large, one per­son on top can drag the truss to the opposite end and lift it up against the temporary brace. Make sure that the cave overhangs are correct and that the outside of the bottom chord is flush with the outside of the end wall’s top plate. Toenail the bottom chord to the double top plate, driving 16d nails every 16 in.

Подпись: BUILDING WITHOUT A GABLE-END OVERHANGПодпись: A furring strip nailed to the gable-end rafter moves the barge rafter cr rakeboard out 3Д in., providing a space into which the siding can tuck.STEP2 Install the Gable TrussSTEP3 Install

the Remaining Trusses

Trusses by themselves arc rather fragile. They gain strength when they’re properly blocked and braced. I will now explain various block­ing and bracing strategies, because this work needs to be done as the trusses are installed.

Safely on the Job WORK SAFELY ON A ROOF

KEEP YOUR WITS about you and pay extra attention to what you’re doing when you’re up on a roof— both to keep yourself safe and to ensure that the integrity of the roof is not compromised.

ж To get on and off the roof, use a good, sturdy ladder that extends 3 ft. above the edge of the roof.

ж Keep the roof dean so that there won’t be any­thing to trip over.

ж Be careful when sawdust is on the roof. Sawdust on a sloped roof can be as slick as ice. To be safe, call out measurements to cutters on the ground and have them dear the board of sawdust before handing it up to you.

Never throw anything off a roof, not even a shin­gle, without first checking to see that no one is down below.

In the hot sun, asphalt shingles soften and tear. Walk gently so you don’t damage the shingles. In hot weather, install shingles early in the morning or late in the afternoon.

In bitter cold weather, shingles become brittle and crack. Work carefully, and pray for sunshine.

Shinglers who nail off a roof by hand often sit on the roof as they work. In hot weather, try sitting on a piece of foam while nailing shingles. Otherwise, hot shingles can literally burn your backside.

STEP2 Install the Gable Truss

HURRICANE CLIPS TIE TRUSSES TO WALLS. Required by code in many areas, these metal connectors are designed to fit around the bottom chord of a truss and against the top plate of a wall. Here, a volunteer attaches a clip with an air hammer.


Sampling Design

In establishing a monitoring programme and data collection schedule, the following points will need addressing. This is not a comprehensive list for every eventuality, but most monitoring programmes will need to consider this list as a minimum:

• The equipment, skills, storage and transportation facilities (and, if required, power to the site):

о Sampling, transport and storage protocols should be obtained or prepared to promote good practice and consequently to yield reliability of readings ob­tained from tests.

о A responsible person should be identified for sample collection and instru­ment readings and made available over the life of the programme. о Health and safety plans are required for personnel engaged in the sampling.

• Timing of sample collection:

о Sometimes a frequency that reduces over time will be satisfactory if adequate behaviour is demonstrated by early analysis, especially where some new ma­terial or construction is being tried or where a singular event has occurred (such as a cargo spillage). Otherwise regular sampling will usually be pre­ferred. There are some cases where only a single sample or one “before” and one “after” sample are necessary at any particular point. о Sampling needs to take account of the weather conditions in which the me­dia will be sampled / measured (rain, wind, heat, etc.). Sometimes collection should be at a fixed time of day, a certain temperature or in a certain season when, otherwise, there wouldn’t be (or would be doubts about) comparability between specimens.

о Sometimes samples are to be collected from a discrete, sometimes from a continuous, source. In some low flow situations, sampling may exhaust the source until slow seepage provides the next specimen. This may have an in­fluence on sampling frequency and/or volume.

• Location of sampling:

о There is usually a conflict between the desired number of points to be sampled and the budget available. As far as possible, the locations should aim to ensure spatial reliability and representativeness. In particular the design should give confidence that all “hot-spots” will be located and that invalid and unreliable readings can be easily distinguished from genuine extreme values. о Vertical and horizontal positions in the ground should be chosen depending on the expected source and route of contaminant flow and the receiving media. For example, where traffic factors are thought to be influential, closeness to the wheel path may be important; where runoff is important, measurements in the verge may be important; where a developing pollutant front is to be detected (or refuted) then positions laterally and beneath the source point may be required. There are similar issues for water bodies – at what depth(s)

and water velocity(ies) should specimens be collected? In the context of road construction, such a question will be irrelevant if water is collected from seep­ages.

о Consideration should be given to the accessibility of sampling locations once the road is open to traffic. Access through the carriageway will often require lane closures that are expensive or difficult to arrange. The access point may also be difficult to keep sealed under traffic loading thereby compromising the quality of specimens collected.

• Protection:

о Sample collection points and instruments should be designed to be replace­able if they become damaged or aged. Appropriate protection of collection points and instruments against vandalism, traffic over-run, grass-cutting and other maintenance/rehabilitation will often be needed.

• Materials to be sampled:

о The sampling programme needs to assess all relevant material, i. e., ground­water, surface water, soils and aggregates as well as these media in their ref­erence condition(s).

о Adjacent surface water bodies may need assessment if an affect by polluted water from the road is suspected.

о Soil or construction material may need monitoring as well as groundwater. If the subgrade or a construction material will (or may) transport or sorb contaminants, it may need to be sampled from time-to-time to check for any alteration (e. g. permeability value or sorbed contaminant level). Similarly, if construction material, in-place, is thought to be a source of ongoing contami­nation, the plan should consider sampling it and testing its leachability as use continues.

о While water samples are only tested for their chemical properties, soil speci­mens may need testing for total solids make-up, organic content, mineralogy, particle size distribution and specific surface area. The last two are important in understanding sorption behaviour. Water can also be extracted from soil samples, e. g. by using a centrifuge.

• Selecting parameters for analysis:

о It is expensive to analyse for all species all of the time. Therefore, it may be necessary to identify key analytes that may act as indicators of change in the seepage/transport process, and to concentrate monitoring on these.

о Often, a regular frequency of assessment can be maintained at modest cost if full chemical analysis is sometimes replaced by surrogates, e. g. pH, Eh, electrical conductivity, etc. by electrical means.

о Where “trigger” values have been set for some intervention, the concentra­tions of the “trigger” species will require specific, ongoing, analysis.

о It can be a false economy only to analyse collected specimens for the analytes of known concern. A record of the contamination of other species may yield important information on an underlying chemical process (e. g. ion exchange) or may give rise to unexpected values that will lead to the identification of some unexpected problem or benefit.

о The water or soil should be sampled in amounts large enough to permit all the desired testing to be performed on it.

Some duplicated sampling will be needed, usually from the same location. The aims are:

• to ensure evidence of a reading’s representativeness;

• to adequately define statistical scatter in readings;

• to monitor genuine fluctuations in source concentration (e. g. as a consequence of flow levels, season, traffic, etc.);

• to ensure that both mean and “worst-case” values are available; and

• to allow repeated analyses in case of dispute.

To ensure best practice in this area most environmental regulatory authorities issue guidance on sampling (see reference list at end of Section 7.4.1).

Data Storage and Retrieval

An appropriate database / record keeping system must be provided (or constituted):

• To hold the data.

• To have data extracted/interpreted in a manner that has meaning. There is no point in collecting data that cannot be successfully accessed.

• To allow it to be interrogated in a way that permits the likely users (owners, regulators, researchers, etc.) to apply the method of interpretation that meets their needs. As most data storage is archived electronically, consideration should also be given to providing secure network access.

• To be easily maintained and amended.

• To have some semi-automatic processing capability that will alert the database owner to take some investigative action if the data contained seems to indicate a problem. There are more than a few examples of a record system holding the data

that would have indicated a potential problem long before it became an issue

if only someone had looked at the data!

• The database / system must be properly documented and backed-up. Accepted archival systems are required for both electronic and paper records.

• The database should hold all the data that passes certain pre-defined quality levels. The quality levels should not be set too high otherwise too many useful data points will be excluded. The disadvantage is that some invalid or unreliable readings will be stored. Therefore, sufficient data points should be stored in the database so that later data analyses can differentiate genuinely high or low values from those readings that are unreliably high or low.

An ongoing budget should be secured to enable monitoring and database main­tenance to continue over the full time-scale required by the probable contaminant transport behaviour. If it cannot be ensured, a sustainable “fall-back” programme should be incorporated into the plan.

Modern software systems are readily, and economically, available to provide se­cure, accessible data storage and retrieval capability. Data entry to these systems is also considerably more user-friendly than in the past. The standardized data format of the Association of Geotechnical and Geoenvironmental Specialists (AGS, 2004) is one such system that has the great advantage of being non-proprietary. Thus, data stored in this manner is readily interchangeable between different users. Field data can be collected by “palmtop” (“PDA”) computer and combined with applications developed using open source software (e. g. Walthall & Waterman, 2006; Chandler et al., 2006).

Second-Order Reliability Methods

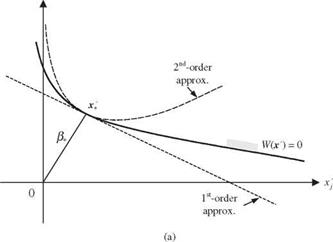
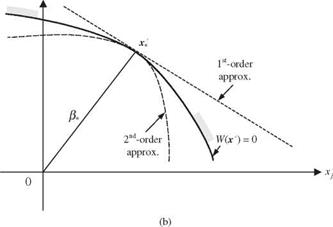
By the AFOSM reliability method, the design point on the failure surface is identified. This design point has the shortest distance to the mean point of the stochastic basic variables in the original space or to the origin of standard­ized normal parameter space. In the AFOSM method, the failure surface is locally approximated by a hyperplane tangent to the design point using the first-order terms of the Taylor series expansion. As shown in Fig. 4.14, second – order reliability methods (SORMs) can improve the accuracy of calculated re­liability under a nonlinear limit-state function by which the failure surface is approximated locally at the design point by a quadratic surface. Literature on the SORMs can be found elsewhere (Fiessler et al., 1979; Shinozuka, 1983;

Breitung, 1984; Ditlevsen, 1984; Naess, 1987; Wen, 1987; Der Kiureghian et al., 1987; Der Kiureghian and De Stefano, 1991). Tvedt (1983) and Naess (1987) developed techniques to compute the bounds of the failure probability. Wen (1987), Der Kiureghian et al. (1987), and others demonstrated that the second – order methods yield an improved estimation of failure probability at the expense of an increased amount of computation. Applications of second-order reliability analysis to hydrosystem engineering problems are relatively few as compared with the first-order methods.

In the following presentations of the second-order reliability methods, it is assumed that the original stochastic variables X in the performance function W (X) have been transformed to the independent standardized normal space by Z’ = T (X), in which Z’ = (Z1, Z’2,…, Z’K) is a column vector of independent standard normal random variables. Realizing that the first-order methods do not account for the curvature of the failure surface, the first-order failure prob­ability could over – or underestimate the true pf depending on the curvilinear nature of W(Z’) at z*. Referring to Fig. 4.15a, in which the failure surface is convex toward the safe region, the first-order method would overestimate the failure probability pf, and, in the case of Fig. 4.156, the opposite effect would result. When the failure region is a convex set, a bound ofthe failure probability is (Lind, 1977)

Ф(-&) < Pf < 1 – Fxf(&) (4.84)

in which в* is the reliability index corresponding to the design point z *, and Fx|(e+) is the value of the xK CDF with K degrees of freedom. Note that the upper bound in Eq. (4.84) is based on the use of a hypersphere to approximate the failure surface at the design point and, consequently, is generally much more conservative than the lower bound. To improve the accuracy of the failure – probability estimation, a better quadratic approximation of the failure surface is needed.

4.6.1 Quadratic approximations of the performance function

At the design point z * in the independent standard normal space, the perfor­mance function can be approximated by a quadratic form as

W (Z’) « 8 z (Z’ – z i) + ± (Z’ – z( / Gz> (Z’ – z:)

Second-Order Reliability Methods

Second-Order Reliability Methods

xk

Second-Order Reliability Methods

xk

Second-Order Reliability Methods

Figure 4.15 Schematic sketch of nonlinear performance functions: (a) convex performance function (positive curvature); (b) concave per­formance function (negative curvature).

in which sz’t = Vz W (z 7+) and GZt = V|, W (z ^) are, respectively, the gradient vector containing the sensitivity coefficients and the Hessian matrix of the performance function W (Z’) evaluated at the design point z The quadratic approximation by Eq. (4.85) involves cross-product of the random variables. To eliminate the cross-product interaction terms in the quadratic approximation, an orthogonal transform is accomplished by utilizing the symmetric square

nature of the Hessian matrix:

Подпись: d 2 W (г Q" 9 zj d z'kGzi = Al W (г 1) =

Byway of spectral decomposition, Gz>t = V tGt KGt VG,, with VG, and AG, being, respectively, the eigenvector matrix and the diagonal eigenvalue matrix of the Hessian matrix Gz,. Consider the orthogonal transformation Z" = VGt Z’ by which the new random vector Z" is also a normal random vector because it is a linear combination of the independent standard normal random variables Z’. Furthermore, it can be shown that

E (Z") = 0

Cov( Z") = Cz« = E (Z "Z"l) = V G, Cz VGt = V G, VGt = I

This indicates that Z" is also an independent standard normal random vector. In terms of Z", Eq. (4.85) can be expressed as

W (Z") « 8 z, (Z" – г.) + 1(Z" – г,) Ag. (Z" – г,0

K 1 K

= ^2 8z’l, k(Zk – г,,k) + ^53 ^k(Zk7 – г,,k)2 = 0 (4.86)

k=i k=i

in which sz"tk is the kth element of sensitivity vector sz« = V tGt sz, in г "-space, and X’k is the kth eigenvalue of the Hessian matrix Gz,.

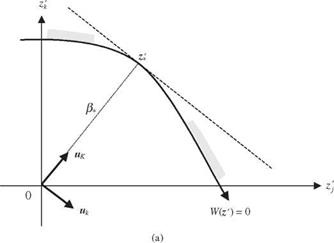
In addition to Eqs. (4.85) and (4.86), the quadratic approximation of the per­formance function in the second-order reliability analysis can be expressed in a simpler form through other types of orthogonal transformation. Referring to Eq. (4.85), consider a K x K matrix H with its last column defined by the negativity of the unit directional derivatives vector d* = – at = – sz>t /1sz, | eval­uated at the design point г,, namely, H = [A1, h2,…, hK-1, d,], with hk being the kth column vector in H. The matrix H is an orthonormal matrix because all column vectors are orthogonal to each other; that is, ht hk = 0, for j = k, hkd, = 0, and all of them have unit length Ht H = HHt = I. One simple way to find such an orthonormal matrix His the Gram-Schmid orthogonal transfor­mation, as described in Appendix 4D. Using the orthonormal matrix as defined above, a new random vector U can be obtained as U = Ht Z’. As shown in Fig. 4.16, the orthonormal matrix H geometrically rotates the coordinates in the г ‘-space to a new ы-space with its last uK axis pointing in the direction of the design point г,. It can be shown easily that the elements of the new ran­dom vector U = (U1, U2,…, UK)t remain to be independent standard normal random variables as Z’.

Second-Order Reliability Methods

UK

Second-Order Reliability Methods

Figure 4.16 Geometric illustration of orthonormal rotation. (a) Before rotation (b) After rotation.

Knowing z * = в* d *, the orthogonal transformation using H results in

u* = H1 z* = H1 (e*d*) = в*H1 d* = в*(0, 0,… ,1)

indicating that the coordinate of the design point in the transformed u-space is (0, 0, …, 0, в*). In terms of the new u-coordinate system, Eq. (4.2) can be expressed as

W (U) « s U* (U – u*)+hu – uj H1 Gz-* H(U – u*) = 0 (4.87)

2

where su, = H1 szt, which simply is

s U, = (s z, hi, s Z h2> •••>s Z hK-i, s z, d,)

= ( |sZ.,d, hi, |sz,|d, h2,|sz,|d„h^-i, -|sz,|d, d,)

= (0,0, …,0,-|s z,|) (4.88)

After dividing |s z, | on both sides of Eq. (4.4), it can be rewritten as

W(U) « в, U k + 1(U – u,)‘ A,(U – u,) = 0 (4.89)

in which A, = Hг Gz, H/ |s z,|. Equation (4.6) can further be reduced to a parabo­lic form as

W(U) « в, – Uk + 1U1 A, U = 0 (4.90)

2

where U = (U1, U 2, …, UK-1) and A, is the (K – 1)th order leading principal submatrix of A, obtained by deleting the last row and last column of matrix

A.

To further simplify the mathematical expression for Eq. (4.7), an orthogonal transformation is once more applied to U as U = У1А U with being the eigenvector matrix of A, satisfying A, = Уд Лд, Уд,, in which Aa, is the diag­onal eigenvalues matrix of A,. It can easily be shown that the elements of the new random vector U s are independent standard normal random variables. In terms of the new random vector U’, the quadratic term in Eq. (4.7) can be rewritten as

W(U’, Uk) « в, – Uk + iUЛд, U’

1 K-1

= в, – Uk + KkUk2 = 0 (4.91)

2 k=1

Second-Order Reliability Methods
where к’s are the main curvatures, which are equal to the elements of the diagonal eigenvalue matrix Лд, of matrix A,. Note that the eigenvalues of A, are identical to those of Gz, defined in Eq. (4.2). This is so because A, = H1 Gz, H is a similarity transform. Therefore, the main curvatures of the hyperparabolic approximation of W(Z’) = 0 are equal to the eigenvalues of A,.

where фк(z 0 is the joint PDF of K independent standard normal random vari­ables. This type of integration is called the Laplace integral, and its asymptotic characteristics have been investigated recently by Breitung (1993).

Once the design point z* is found and the corresponding reliability index в* = z * is computed, Breitung (1984) shows that the failure probability based on a hyperparabolic approximation of W(Z0, Eq. (4.92), can be estimated asymptotically (that is, в* ^-<x>) as

K-1

Pf « Ф(-в,) Ц(1 + вк)-1/2 (4.93)

k=1

where Kk, k = 1,2,…, K — 1, are the main curvatures of the performance func­tion W(Z’) at z*, which is equal to the eigenvalues of the (K — 1) leading principal submatrix of A * defined in Eq. (4.90). It should be pointed out that owing to the asymptotic nature of Eq. (4.93), the accuracy of estimating pf by it may not be satisfactory when the value of в* is not large.

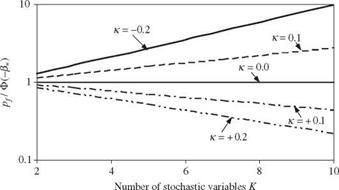
Equation (4.93) reduces to pf = Ф(—в*) if the curvature of the performance function is zero. A near-zero curvature of W (Z’) in all directions at the design point implies that the performance function behaves like a hyperplane around z*. In this case, W(Z’) at z* can be described accurately by the first-order expansion terms, and reliability corresponds to the first-order failure probabil­ity. Figure 4.17 shows the ratio of second-order failure probability by Eq. (4.93) to the first-order failure probability as a function of main curvature and num­ber of stochastic variables in the performance function. It is clearly shown in Fig. 4.17a that when the limit-state surface is convex toward the failure re­gion with a constant positive curvature (see Fig. 4.15a), the failure probability estimated by the first-order method is larger than that by the second-order methods. This magnitude of the overestimation increases with the curvature

Second-Order Reliability Methods

Figure 4.17 Comparison of the second-order and first-order failure probabilities for performance function with different curvatures.

and the number of stochastic basic variables involved. On the other hand, the first-order methods yield a smaller value of failure probability than the second – order methods when the limit-state surface is concaved toward the safe region (see Fig. 4.156), which corresponds to a negative curvature. Hohenbichler and Rackwitz (1988) suggested further improvement on Breitung’s results using the importance sampling technique (see Sec. 6.7.1).

Подпись: Pf Second-Order Reliability Methods Подпись: (4.94)

In case there exists multiple design points yielding the same minimum dis­tance в*, Eq. (4.93) for estimating the failure probability pf can be extended as

in which J is the number of design points with в* = z *1| = |z *2| = ■ ■ = |z * J |, and Kk, j is the main curvature for the kth stochastic variables at the j th design point.

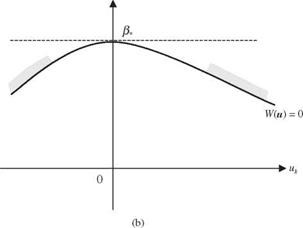
The second-order reliability formulas described earlier are based on fit­ting a paraboloid to the failure surface at the design points on the basis of curvatures. The computation of failure probability requires knowledge of the main curvatures at the design point, which are related to the eigenvalues of the Hessian matrix of the performance function. Der Kiureghian et al. (1987) pointed out several computational disadvantages of the paraboloid-fitting procedure:

1. When the performance function is not continuous and twice differentiable in the neighborhood of the design point, numerical differencing would have to be used to compute the Hessian matrix. In this case, the procedure may be computational intensive, especially when the number of stochastic vari­ables is large and the performance function involves complicated numerical algorithms.

2. When using numerical differencing techniques for computing the Hessian, errors are introduced into the failure surface. This could result in error in computing the curvatures.

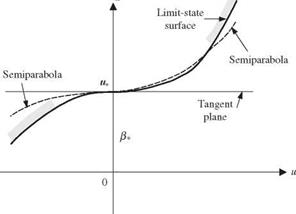
3. In some cases, the curvatures do not provide a realistic representation of the failure surface in the neighborhood of design point, as shown in Fig. 4.18.

To circumvent these disadvantages of curvature-fitting procedure, Der Kiureghian et al. (1987) proposed an approximation using a point-fitted paraboloid (see Fig. 4.18) by which two semiparabolas are used to fit the failure surface in such a manner that both semiparabolas are tangent to the failure surface at the design point. Der Kiureghian et al. (1987) showed that one important advantage of the point-fitted paraboloid is that it requires less computation when the number of stochastic variables is large.

Second-Order Reliability Methods

W(u) = 0


u


k


Figure 4.18 Fitting of paraboloid in rotated standard space. (Der Kiurighian et al., 1987.)


Second-Order Reliability Methods