Category Hydrosystems Engineering Reliability Assessment and Risk Analysis

Time-dependent reliability models

Reliability computations for time-dependent models can be made for determin­istic and random cycle times. The development of a model for deterministic cycles is given first, which naturally leads to the model for random cycle times.

Number of occurrences is deterministic. Consider a hydrosystem with a fixed resistance (or capacity) R = r subject to n repeated loads L1, L2,…, Ln. When the number of loads n and system capacity r are fixed, the reliability of the system after n loadings ps(n, r) can be expressed as

Ps(n, r ) = P [(L1 < r ) n (L2 < r ) П—П (Ln < r )] = P (Lmax < Г ) (4.100)

where Lmax = max{L1, L2,…, Ln}, which also is a random variable. If all ran­dom loadings L are independent with their own distributions, Eq. (4.100) can be written as

Ps(n, r) = [FLi(r)] (4.101)

i=1

where FLi (r) is the CDF of the ith load. In the case that all loadings are gener­ated by the same statistical process, that is, all Ls are identically distributed with FLi(r) = FL(r), for i = 1, 2,…, n, Eq. (4.101) can further be reduced to

Подпись: (4.102)Ps(n, r) = [FL(r )]

Подпись: Ps(n) Time-dependent reliability models Подпись: (4.103)

If the resistance of the system also is a random variable, the system reliability under the fixed number of loads n can be expressed as

Number of occurrences is random. Since the loadings to hydrosystems are re­lated to hydrologic events, the occurrence of the number of loads, in general, is uncertain. The reliability of the system under random loading in the specified time interval [0, t] can be expressed as

TO

Подпись: (4.104)Ps(t) = n (t |n) Ps(n)

n=0

in which n(t |n) is the probability of n loadings occurring in the time interval [0, t]. A Poisson distribution can be used to describe the probability of the num­ber of events occurring in a given time interval. In fact, the Poisson distribution has been found to be an appropriate model for the number of occurrences of hy­drologic events (Clark, 1998; Todorovic and Yevjevich, 1969; Zelenhasic, 1970). Referring to Eq. (2.55), n(t |n) can be expressed as

e Xt ( X t )n

n (t |n) =————- (— (4.105)

n!

where X is the mean rate of occurrence of the loading in [0, t], which can be estimated from historical data.

Substituting Eq. (4.105) in Eq. (4.104), the time-dependent reliability for the random independent load and random-fixed resistance can be expressed as

Подпись: e Xt (Xt)n" n! Подпись: Ps(t) = n= 0 Подпись: Ps (n, r) fR (r) drПодпись: 0(4.106)

Under the condition that random loads are independently and identically dis­tributed, Eq. (4.106) can be simplified as

n TO

Ps (t) = e- t [1-FL(r)] fR (r) dr (4.107)

0

Modeling intensity and occurrence of loads

A hydraulic structure placed in a natural environment over an expected ser­vice period is subject to repeated application of loads of varying intensities. The magnitude of load intensity and the number of occurrences of load are, in gen­eral, random by nature. Therefore, probabilistic models that properly describe the stochastic mechanisms of load intensity and load occurrence are essential for accurate evaluation of the time-dependent reliability of hydrosystems.

Probability models for load intensity. In the great majority of situations in hy­drosystems reliability analysis, the magnitudes of load to be imposed on the system are continuous random variables. Therefore, univariate probability dis­tributions described in Sec. 2.6 potentially can be used to model the intensity of a single random load. In a case in which more than one type of load is considered in the analysis, multivariate distributions should be used. Some commonly used multivariate distribution models are described in Sec. 2.7.

The selection of an appropriate probability model for load intensity depends on the availability of information. In a case for which sample data about the load intensity are available, formal statistical goodness-of-fit tests (see Sec. 3.7) can be applied to identify the best-fit distribution. On the other hand, when data on load intensity are not available, selection of the probability distribution for modeling load intensity has to rely on the analyst’s logical judgment on the basis of the physical processes that produce the load.

Probability models for load occurrence. In time-dependent reliability analysis, the time domain is customarily divided into a number of intervals such as days, months, or years, and the random nature of the load occurrence in each time interval should be considered explicitly. The occurrences of load are discrete by nature, which can be treated as a point random process. In Sec. 2.5, basic features of two types of discrete distributions, namely, binomial and Poisson distributions, for point process were described. This section briefly summarizes two distributions in the context of modeling the load-occurrences. Other load – occurrence models (e. g., renewal process, Polya process) can be found elsewhere (Melchers, 1999; Wen, 1987).

Bernoulli process. A Bernoulli process is characterized by three features:

(1) binary outcomes in each trial, (2) constant probability of occurrence of out­come in each time interval, and (3) the outcomes are independent between trials. In the context of load-occurrence modeling, each time interval repre­sents a trial in which the outcome is either the occurrence or nonoccurrence of the load (with a constant probability) causing failure or nonfailure of the sys­tem. Hence the number of occurrences of load follows a binomial distribution, Eq. (2.51), with parameters p (the probability of occurrence of load in each time interval) and n (the number of time intervals). It is interesting to note that the number of intervals until the first occurrence T (the waiting time) in a Bernoulli process follows a geometric distribution with the PMF

g(T = t) = (1 – p)t-1 p (4.97)

The expected value of waiting time T is 1/p, which is the mean occurrence period. It should be noted that the parameter p depends on the time interval used.

Poisson process. In the Bernoulli process, as the time interval shrinks to zero and the number of time intervals increases to infinity, the occurrence of events reduces to a Poisson process. The conditions under which a Poisson process applies are (1) the occurrence of an event is equally likely at any time instant,

(2) the occurrences of events are independent, and (3) only one event occurs at
a given time instant. The PMF describing the number of occurrences of loading in a specified time period (0, t] is given by Eq. (2.55) and is repeated here:

e Xt ( Xt )x

Px (xX, t) =—— for x = 0,1, …

x!

in which X is the average time rate of occurrence of the event of interest. The interarrival time between two successive occurrences is described by an expo­nential distribution with the PDF

ft(tX) = Xe-t for t > 0 (4.98)

Although condition (1) implies that the Poisson process is stationary, it can be generalized to a nonstationary Poisson process, in which the rate of occurrence is a function of time X(t). Then the Poisson PMF for a nonstationary process can be written as

Подпись: (4.99)P(x = x) [/0 x(t) d t]x exp [-/0 x(t) d t]

x!

Equation (4.99) allows one to incorporate the seasonality of many hydrologic events.

Classification of time-dependent reliability models

Repeated loadings on a hydrosystem are characterized by the time each load is applied and the behavior of time intervals between load applications. From a reliability theory viewpoint, the uncertainty about the loading and resistance variables may be classified into three categories: deterministic, random fixed, and random independent (Kapur and Lamberson, 1977). For the deterministic category, the loadings assume values that are exactly known a priori. For the random-fixed case, the randomness of loadings varies in time in a known man­ner. For the random-independent case, the loading is not only random, but the successive values assumed by the loading are statistically independent.

Deterministic. A variable that is deterministic can be quantified as a constant without uncertainty. A system with deterministic resistance and load implies that the behavior of the system is completely controllable, which is an ideal­ized case. However, in some situations, a random variable can be treated as deterministic if its uncertainty is small and can be ignored.

Random fixed. A random-fixed variable is one whose initial condition is random in nature, and after its realization, the variable value is a known function of time. This can be expressed as

Xt = X0 g(T) for t > 0 (4.95)

where X0 and Xt are, respectively, the random variable X at times t = 0 and t = t, and g(T) is a known function involving time. Although Xt is a random variable, its PDF, however, is completely dependent on that of X0. Therefore, once the value of the random initial condition X0 is realized or observed, the value of subsequent time can be uniquely determined. For this case, given the PDF of X0, the PDF and statistical moments of Xt can be obtained easily. For instance, the mean and variance of Xt can be obtained, in terms of those of X0, as

E(Xt) = E(X0)g(t) for t > 0 (4.96a)

Var(Xt) = Var(X0)g2(t) for t > 0 (4.96b)

in which E(X0) and E(Xt) are the means of X0 and Xt, respectively, andVar(X0) and Var(Xt) are the variances of X0 and Xt, respectively.

Random independent. A random-independent variable, unlike the random-fixed variable, whose values occurred at different times are not only random but also independent each other. There is no known relationship between the values of X0 and Xt.

Time-dependent load

In time-dependent reliability analysis, one is concerned with system reliability over a specified time period during which external loads can occur more than once. Therefore, not only the intensity or magnitude of load is important but also the number or frequency of load occurrences is an important parameter.

Over an anticipated service period, the characteristics of load to be imposed on the system could change. For example, when a watershed undergoes a pro­gressive change, it could induce time dependence in load. More specifically, the magnitude of floods could increase as urbanization progresses, and sediment discharge from overland erosion and non-point-source pollution could decrease over time if the farming and irrigation practices in the watershed involve pol­lution control measures. Again, characterization of the time-varying nature of load intensity requires extensive monitoring, data collection, and engineering analysis.

The occurrence of load over an anticipated service period can be classified into two cases (Kapur and Lamberson, 1977): (1) The number and time of occurrence are known, and (2) the number and time of occurrences are ran­dom. Section 4.7.4 presents probabilistic models for describing the occurrence and intensity of load.

Time-dependent resistance

For a hydraulic structure placed in a natural environment over a period of time, its operational characteristics could change over time owing to deterioration, aging, fatigue, and lack of maintenance. Consequently, the structural capacity (or resistance) would vary with respect to time. Examples of time-dependent characteristics of resistance in hydrosystems are change in flow-carrying capacity of storm sewers owing to sediment deposition and settlement, decrease in flow-carrying capacity in water distribution pipe networks owing to aging, seasonal variation in waste assimilative capacity of natural streams, etc.

Modeling time-dependent features of the resistance of a hydrosystem re­quires descriptions of the time-varying nature of statistical properties of the resistance. This would require monitoring resistance of the system over time, which, in general, is not practical. Alternatively, since the resistance of a hydrosystem may depend on several stochastic basic parameters, the time – dependent features of resistance of hydraulic structures or hydrosystems can be deduced, through appropriate engineering analysis, from the time-varying behavior of the stochastic parameters affecting the resistance of the systems. For example, the flow-carrying capacity of a storm sewer depends on pipe slope, roughness coefficient, and pipe size. Therefore, the time-dependent behavior of storm sewer capacity may be derived from the time-varying features of pipe slope, roughness coefficient, and pipe size by using appropriate hydraulic models.

Although simplistic in idea, information about the time-dependent nature of stochastic basic parameters in the resistance function of a hydrosystem is gen­erally lacking. Only in a few cases and systems is partial information available. Table 4.6 shows the value of Hazen-Williams coefficient of cast iron pipe types

TABLE 4.6 Typical Hazen-Williams Pipe Roughness Coefficients for Cast Iron Pipes

Age (years) new

Pipe diameter all sizes

Roughness coefficient Chw 130

5

>380 mm (15 in)

120

>100 mm ( 4 in)

118

10

>600 mm (24 in)

113

>300 mm (12 in)

111

> 100 mm (4 in)

107

20

>600 mm (24 in)

100

>300 mm (12 in)

96

> 100 mm (4 in)

89

30

>760 mm (30 in)

90

>400 mm (16 in)

87

> 100 mm (4 in)

75

40

>760 mm (30 in)

83

>400 mm (16 in)

80

> 100 mm (4 in)

64

SOURCE: After Wood (1991).

as affected by pipe age. Owing to a lack of sufficient information to accurately define the time-dependent features of resistance or its stochastic basic parame­ters, it has been the general practice to treat them as time-invariant quantities by which statistical properties of resistance and its stochastic parameters do not change with time.

The preceding discussions consider the relationship between resistance and time only, namely, the aging effect. In some situations, resistance also could be affected by the number of occurrences of loadings and/or the associated intensity. If the resistance is affected only by the load occurrences, the effect is called cyclic damage, whereas if both load occurrence and its intensity affect the resistance, it is called cumulative damage (Kapur and Lamberson, 1977).

Time-Dependent Reliability Models

The development of hydrosystems engineering projects often includes the de­sign of various types of hydraulic structures, such as pipe networks for water supply, storm sewer systems for runoff collection, levee and dike systems for flood control and protection, and others. Generally, the system, once designed and constructed, is expected to serve its intended objectives over a period of several years, during which the system behavior and environmental factors could change with respect to time. In such circumstances, engineers often are interested in evaluating the reliability of the hydraulic structure with respect to a specified time framework. For example, one might be interested in the risk of overflow of an urban storm water detention basin in the summer when convective thunderstorms prevail. Loads to most hydrosystems are caused by the occurrence of hydrologic events such as floods, storms, or droughts that are random by nature. Time-dependent reliability analysis considers repeated applications of loads and also can consider the change of the distribution of resistance with time.

In preceding sections, emphasis was placed on static reliability analysis, which does not consider the time dependency of the load and resistance. This section considers the time-dependent random variables in reliability analysis. As a result, the reliability is a function of time, i. e., time dependent or time vari­ant. The difference between the time-to-failure analysis described in Chap. 6 and the time-dependent reliability analysis should be pointed out. The com­monality between the two reliability analyses is that both attempt to assess the variation of reliability with respect to time. The difference lies in the man­ner in which the reliability is computed. Time-to-failure analysis is concerned
only with the time history of the performance of the system as a whole without giving explicit consideration to the load-resistance interference as done by time – dependent reliability analysis. The objective of time-dependent reliability mod­els is to determine the system reliability over a specified time interval in which the number of occurrences of loads is a random variable.

When both loading and resistance are functions of time, the performance function W(t) = R(t) – L(t) is time-dependent. Consequently, the reliability Ps(t) = P [W(t) > 0] would vary with respect to time. Figure 4.19 shows schematically the key feature of the time-dependent reliability problem in which the PDFs of load and resistance change with time. In Fig. 4.19, the mean of resistance has a downward trend with time, whereas that of the load increases with time. As the standard deviations of both resistance and load increase with time, the area of interference increases, and this results in an increase in the failure probability with time. The static reliability analy­sis described in preceding sections considers neither load nor resistance being functions of time.

If the load is to be applied many times, it is often the largest load that is considered in reliability analysis. Then this maximum load can be described by an extreme-value distribution such as the Gumbel distribution described in Sec. 2.6.4. In doing so, the effect of time is ignored in reliability analysis, which may not be appropriate, especially when more than one load is involved or the resistance changes with time. A comprehensive treatment of time-dependent reliability issues can be found in Melchers (1999).

Time-Dependent Reliability Models

Time t

Figure 4.19 Time-dependence of load and resistance probability distribution functions.

Second-Order Reliability Methods

By the AFOSM reliability method, the design point on the failure surface is identified. This design point has the shortest distance to the mean point of the stochastic basic variables in the original space or to the origin of standard­ized normal parameter space. In the AFOSM method, the failure surface is locally approximated by a hyperplane tangent to the design point using the first-order terms of the Taylor series expansion. As shown in Fig. 4.14, second – order reliability methods (SORMs) can improve the accuracy of calculated re­liability under a nonlinear limit-state function by which the failure surface is approximated locally at the design point by a quadratic surface. Literature on the SORMs can be found elsewhere (Fiessler et al., 1979; Shinozuka, 1983;

Breitung, 1984; Ditlevsen, 1984; Naess, 1987; Wen, 1987; Der Kiureghian et al., 1987; Der Kiureghian and De Stefano, 1991). Tvedt (1983) and Naess (1987) developed techniques to compute the bounds of the failure probability. Wen (1987), Der Kiureghian et al. (1987), and others demonstrated that the second – order methods yield an improved estimation of failure probability at the expense of an increased amount of computation. Applications of second-order reliability analysis to hydrosystem engineering problems are relatively few as compared with the first-order methods.

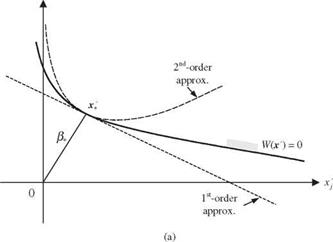
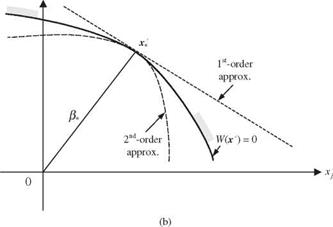
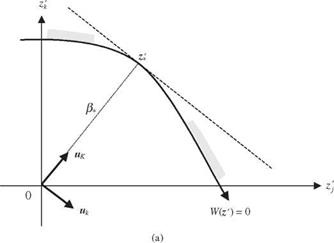
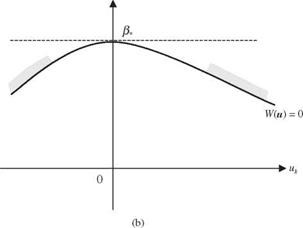
In the following presentations of the second-order reliability methods, it is assumed that the original stochastic variables X in the performance function W (X) have been transformed to the independent standardized normal space by Z’ = T (X), in which Z’ = (Z1, Z’2,…, Z’K) is a column vector of independent standard normal random variables. Realizing that the first-order methods do not account for the curvature of the failure surface, the first-order failure prob­ability could over – or underestimate the true pf depending on the curvilinear nature of W(Z’) at z*. Referring to Fig. 4.15a, in which the failure surface is convex toward the safe region, the first-order method would overestimate the failure probability pf, and, in the case of Fig. 4.156, the opposite effect would result. When the failure region is a convex set, a bound ofthe failure probability is (Lind, 1977)

Ф(-&) < Pf < 1 – Fxf(&) (4.84)

in which в* is the reliability index corresponding to the design point z *, and Fx|(e+) is the value of the xK CDF with K degrees of freedom. Note that the upper bound in Eq. (4.84) is based on the use of a hypersphere to approximate the failure surface at the design point and, consequently, is generally much more conservative than the lower bound. To improve the accuracy of the failure – probability estimation, a better quadratic approximation of the failure surface is needed.

4.6.1 Quadratic approximations of the performance function

At the design point z * in the independent standard normal space, the perfor­mance function can be approximated by a quadratic form as

W (Z’) « 8 z (Z’ – z i) + ± (Z’ – z( / Gz> (Z’ – z:)

Second-Order Reliability Methods

Second-Order Reliability Methods

xk

Second-Order Reliability Methods

xk

Second-Order Reliability Methods

Figure 4.15 Schematic sketch of nonlinear performance functions: (a) convex performance function (positive curvature); (b) concave per­formance function (negative curvature).

in which sz’t = Vz W (z 7+) and GZt = V|, W (z ^) are, respectively, the gradient vector containing the sensitivity coefficients and the Hessian matrix of the performance function W (Z’) evaluated at the design point z The quadratic approximation by Eq. (4.85) involves cross-product of the random variables. To eliminate the cross-product interaction terms in the quadratic approximation, an orthogonal transform is accomplished by utilizing the symmetric square

nature of the Hessian matrix:

Подпись: d 2 W (г Q" 9 zj d z'kGzi = Al W (г 1) =

Byway of spectral decomposition, Gz>t = V tGt KGt VG,, with VG, and AG, being, respectively, the eigenvector matrix and the diagonal eigenvalue matrix of the Hessian matrix Gz,. Consider the orthogonal transformation Z" = VGt Z’ by which the new random vector Z" is also a normal random vector because it is a linear combination of the independent standard normal random variables Z’. Furthermore, it can be shown that

E (Z") = 0

Cov( Z") = Cz« = E (Z "Z"l) = V G, Cz VGt = V G, VGt = I

This indicates that Z" is also an independent standard normal random vector. In terms of Z", Eq. (4.85) can be expressed as

W (Z") « 8 z, (Z" – г.) + 1(Z" – г,) Ag. (Z" – г,0

K 1 K

= ^2 8z’l, k(Zk – г,,k) + ^53 ^k(Zk7 – г,,k)2 = 0 (4.86)

k=i k=i

in which sz"tk is the kth element of sensitivity vector sz« = V tGt sz, in г "-space, and X’k is the kth eigenvalue of the Hessian matrix Gz,.

In addition to Eqs. (4.85) and (4.86), the quadratic approximation of the per­formance function in the second-order reliability analysis can be expressed in a simpler form through other types of orthogonal transformation. Referring to Eq. (4.85), consider a K x K matrix H with its last column defined by the negativity of the unit directional derivatives vector d* = – at = – sz>t /1sz, | eval­uated at the design point г,, namely, H = [A1, h2,…, hK-1, d,], with hk being the kth column vector in H. The matrix H is an orthonormal matrix because all column vectors are orthogonal to each other; that is, ht hk = 0, for j = k, hkd, = 0, and all of them have unit length Ht H = HHt = I. One simple way to find such an orthonormal matrix His the Gram-Schmid orthogonal transfor­mation, as described in Appendix 4D. Using the orthonormal matrix as defined above, a new random vector U can be obtained as U = Ht Z’. As shown in Fig. 4.16, the orthonormal matrix H geometrically rotates the coordinates in the г ‘-space to a new ы-space with its last uK axis pointing in the direction of the design point г,. It can be shown easily that the elements of the new ran­dom vector U = (U1, U2,…, UK)t remain to be independent standard normal random variables as Z’.

Second-Order Reliability Methods

UK

Second-Order Reliability Methods

Figure 4.16 Geometric illustration of orthonormal rotation. (a) Before rotation (b) After rotation.

Knowing z * = в* d *, the orthogonal transformation using H results in

u* = H1 z* = H1 (e*d*) = в*H1 d* = в*(0, 0,… ,1)

indicating that the coordinate of the design point in the transformed u-space is (0, 0, …, 0, в*). In terms of the new u-coordinate system, Eq. (4.2) can be expressed as

W (U) « s U* (U – u*)+hu – uj H1 Gz-* H(U – u*) = 0 (4.87)

2

where su, = H1 szt, which simply is

s U, = (s z, hi, s Z h2> •••>s Z hK-i, s z, d,)

= ( |sZ.,d, hi, |sz,|d, h2,|sz,|d„h^-i, -|sz,|d, d,)

= (0,0, …,0,-|s z,|) (4.88)

After dividing |s z, | on both sides of Eq. (4.4), it can be rewritten as

W(U) « в, U k + 1(U – u,)‘ A,(U – u,) = 0 (4.89)

in which A, = Hг Gz, H/ |s z,|. Equation (4.6) can further be reduced to a parabo­lic form as

W(U) « в, – Uk + 1U1 A, U = 0 (4.90)

2

where U = (U1, U 2, …, UK-1) and A, is the (K – 1)th order leading principal submatrix of A, obtained by deleting the last row and last column of matrix

A.

To further simplify the mathematical expression for Eq. (4.7), an orthogonal transformation is once more applied to U as U = У1А U with being the eigenvector matrix of A, satisfying A, = Уд Лд, Уд,, in which Aa, is the diag­onal eigenvalues matrix of A,. It can easily be shown that the elements of the new random vector U s are independent standard normal random variables. In terms of the new random vector U’, the quadratic term in Eq. (4.7) can be rewritten as

W(U’, Uk) « в, – Uk + iUЛд, U’

1 K-1

= в, – Uk + KkUk2 = 0 (4.91)

2 k=1

Second-Order Reliability Methods
where к’s are the main curvatures, which are equal to the elements of the diagonal eigenvalue matrix Лд, of matrix A,. Note that the eigenvalues of A, are identical to those of Gz, defined in Eq. (4.2). This is so because A, = H1 Gz, H is a similarity transform. Therefore, the main curvatures of the hyperparabolic approximation of W(Z’) = 0 are equal to the eigenvalues of A,.

where фк(z 0 is the joint PDF of K independent standard normal random vari­ables. This type of integration is called the Laplace integral, and its asymptotic characteristics have been investigated recently by Breitung (1993).

Once the design point z* is found and the corresponding reliability index в* = z * is computed, Breitung (1984) shows that the failure probability based on a hyperparabolic approximation of W(Z0, Eq. (4.92), can be estimated asymptotically (that is, в* ^-<x>) as

K-1

Pf « Ф(-в,) Ц(1 + вк)-1/2 (4.93)

k=1

where Kk, k = 1,2,…, K — 1, are the main curvatures of the performance func­tion W(Z’) at z*, which is equal to the eigenvalues of the (K — 1) leading principal submatrix of A * defined in Eq. (4.90). It should be pointed out that owing to the asymptotic nature of Eq. (4.93), the accuracy of estimating pf by it may not be satisfactory when the value of в* is not large.

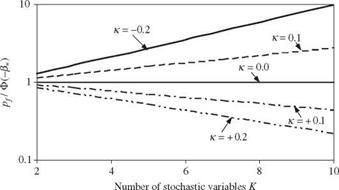
Equation (4.93) reduces to pf = Ф(—в*) if the curvature of the performance function is zero. A near-zero curvature of W (Z’) in all directions at the design point implies that the performance function behaves like a hyperplane around z*. In this case, W(Z’) at z* can be described accurately by the first-order expansion terms, and reliability corresponds to the first-order failure probabil­ity. Figure 4.17 shows the ratio of second-order failure probability by Eq. (4.93) to the first-order failure probability as a function of main curvature and num­ber of stochastic variables in the performance function. It is clearly shown in Fig. 4.17a that when the limit-state surface is convex toward the failure re­gion with a constant positive curvature (see Fig. 4.15a), the failure probability estimated by the first-order method is larger than that by the second-order methods. This magnitude of the overestimation increases with the curvature

Second-Order Reliability Methods

Figure 4.17 Comparison of the second-order and first-order failure probabilities for performance function with different curvatures.

and the number of stochastic basic variables involved. On the other hand, the first-order methods yield a smaller value of failure probability than the second – order methods when the limit-state surface is concaved toward the safe region (see Fig. 4.156), which corresponds to a negative curvature. Hohenbichler and Rackwitz (1988) suggested further improvement on Breitung’s results using the importance sampling technique (see Sec. 6.7.1).

Подпись: Pf Second-Order Reliability Methods Подпись: (4.94)

In case there exists multiple design points yielding the same minimum dis­tance в*, Eq. (4.93) for estimating the failure probability pf can be extended as

in which J is the number of design points with в* = z *1| = |z *2| = ■ ■ = |z * J |, and Kk, j is the main curvature for the kth stochastic variables at the j th design point.

The second-order reliability formulas described earlier are based on fit­ting a paraboloid to the failure surface at the design points on the basis of curvatures. The computation of failure probability requires knowledge of the main curvatures at the design point, which are related to the eigenvalues of the Hessian matrix of the performance function. Der Kiureghian et al. (1987) pointed out several computational disadvantages of the paraboloid-fitting procedure:

1. When the performance function is not continuous and twice differentiable in the neighborhood of the design point, numerical differencing would have to be used to compute the Hessian matrix. In this case, the procedure may be computational intensive, especially when the number of stochastic vari­ables is large and the performance function involves complicated numerical algorithms.

2. When using numerical differencing techniques for computing the Hessian, errors are introduced into the failure surface. This could result in error in computing the curvatures.

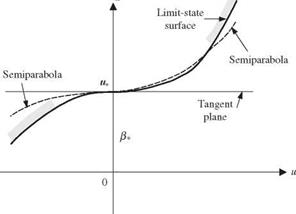
3. In some cases, the curvatures do not provide a realistic representation of the failure surface in the neighborhood of design point, as shown in Fig. 4.18.

To circumvent these disadvantages of curvature-fitting procedure, Der Kiureghian et al. (1987) proposed an approximation using a point-fitted paraboloid (see Fig. 4.18) by which two semiparabolas are used to fit the failure surface in such a manner that both semiparabolas are tangent to the failure surface at the design point. Der Kiureghian et al. (1987) showed that one important advantage of the point-fitted paraboloid is that it requires less computation when the number of stochastic variables is large.

Second-Order Reliability Methods

W(u) = 0


u


k


Figure 4.18 Fitting of paraboloid in rotated standard space. (Der Kiurighian et al., 1987.)


Second-Order Reliability Methods

Overall summary of AFOSM reliability method

Convergence criteria for locating the design point. The previously described Hasofer-Lind and Ang-Tang iterative algorithms to determine the design point indicate that the iterations may end when x(r) and x(r+1> are sufficiently close. The key question then becomes what constitutes sufficiently close. In the ex­amples given previously in this section, the iterations were stopped when the
difference between the current and previous design point was less than 0.001. Whereas such a tight tolerance worked for the pipe-capacity examples in this book, it might not be appropriate for other cases, particularly for practical prob­lems. Thus alternative convergence criteria often have been used.

In some cases, the solution has been considered to have converged when the values of в(г) and віт+1) are sufficiently close. For example, Ang and Tang (1984, pp. 361-383) presented eight example applications of the AFOSM method to civil engineering systems, and the convergence criteria for differences in в ranged from 0.025 to 0.001. The Construction Industry Research and Informa­tion Association (CIRIA, 1977) developed an iterative approach similar to that of Ang and Tang (1984), only their convergence criterion was that the perfor­mance function should equal zero within some tolerance. The CIRIA procedure was applied in the uncertainty analysis of backwater computations using the HEC-2 water surface profiles model done by Singh and Melching (1993).

In order for iterative algorithms to locate the design point to achieve conver­gence, the performance function must be locally differentiable, and the orig­inal density functions of Xk must be continuous and monotonic, at least for Xk < xk* (Yen et al., 1986). If the performance function is discontinuous, it must be treated as a series of continuous functions.

The search for the design point may become numerically more complex if the performance function has several local minima or if the original density functions of the Xk are discontinuous and bounded. It has been found that some of the following problems occasionally may result for the iteration algorithms to locate the design point (Yen et al., 1986):

1. The iteration may diverge or it may give different в values because of local minima in the performance function.

2. The iteration may converge very slowly when the probability of failure is very small, for example, pf < 10-4.

3. In the case of bounded random variables, the iteration may yield some xk* values outside the bounded range of the original density function. However, if the bounds are strictly enforced, the iterations may diverge.

Yen et al. (1986) recommended use of the generalized reduced gradient (GRG) optimization method proposed by Cheng et al. (1982) to determine the design point to reduce these numerical problems. However, the GRG-based method may not work well when complex computer models are needed to determine the system performance function.

Melching (1992) applied the AFOSM method using the Rackwitz iterative algorithm (Rackwitz and Fiessler, 1978), which is similar to the Ang-Tang algorithm, to determine the design point for estimation of the probability of flooding for 16 storms on an example watershed using two rainfall-runoff models. In this application, problems with performance function discontinu­ities, slow convergence for small values of pf, and divergence in the estimated в values were experienced for some of the cases. In the case of discontinuity in the performance function (resulting from the use of a simple initial loss – continuing loss rate abstraction scheme), in some cases the iterations went back and forth between one side of the discontinuity and the other, and conver­gence in the values of the xk s could not be achieved. Generally, in such cases, the value of в had converged to the second decimal place, and thus a good approximation of в* corresponding to the design point was obtained.

For extreme probability cases (в > 2.5), the iterations often diverged. The difference in в values for performance function values near zero typically was on the order of 0.2 to 0.4. The iteration of which the в value was smallest was selected as a reasonable estimate of the true в* corresponding to the design point. In Melching (1992), the pf values so approximated were on the order of 0.006 to 0.00004. Thus, from a practical viewpoint of whether or not a flood is likely, such approximations of в* do not greatly change the estimated flood risk for the event in question. However, ifvarious flood-mitigation alternatives were being compared in this way, one would have to be very careful that consistent results were obtained when comparing the alternatives.

A shortcoming of the afosm reliability index. As shown previously, use of the

AFOSM reliability index removes the problem of lack of invariance associated with the MFOSM reliability index. This allows one to place different designs on the same common ground for comparing their relative reliabilities using в-AF^M. A design with higher value of влгозм would be associated with a higher reliability and lower failure probability. Referring to Fig. 4.14, in which failure surfaces of four different designs are depicted in the uncorrelated standardized parameter space, an erroneous conclusion would be made if one assesses the relative reliability on the basis of the reliability index. Note that in Fig. 4.14 the designs A, B, and C have identical values of the reliability index, but the size of their safe regions SA, SB, and SC are not the same, and in fact, they satisfy SA c SB c SC. The actual reliability relationship among the three de­signs should be ps(A) < ps(B) < ps(C), which is not reflected by the reliability index. One could observe that if the curvatures of different failure surfaces at the design point are similar, such as those with designs A and B, relative relia­bilities between different designs could be indicated accurately by the value of reliability index. On the other hand, when the curvatures offailure surfaces are significantly different, such as those for designs C and D, вAFOsM alone could not be used as the basis for comparison.

For this reason, Ditlevsen (1979) proposed a generalized reliability index во = Ф(у), with y being a reliability measure obtained from integrating a weight function over the safe region S, that is,

Y = Ф (x) d x (4.83)

J x es

in which ф (x) is the weight function, which is rotationally symmetric and pos­itive (Ditlevsen, 1979). One such function that is mathematically tractable is

xk

Overall summary of AFOSM reliability method

Figure 4.14 Nonunique reliability associated with an identical relia­bility index.

the K-dimensional standardized independent normal PDF. Although the gen­eralized reliability index provides a more consistent and selective measure of reliability than ^atosm for a nonlinear failure surface, it is, however, more computationally difficult to obtain. From a practical viewpoint, most engineer­ing applications result in the general reliability index whose value is close to eAFoSM. Only in cases where the curvature of the failure surface at the design point is large and there are several design points on the failure surface would the two reliability indices deviate significantly.

AFOSM reliability analysis for nonnormal correlated stochastic variables

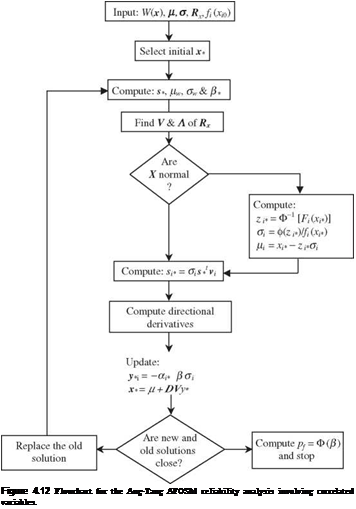
For most practical engineering problems, parameters involved in load and re­sistance functions are correlated nonnormal random variables. Such distribu­tional information has important implications for the results of reliability com­putations, especially on the tail part of the distribution for the performance function. The procedures of the Rackwitz normal transformation and orthogo­nal decomposition described previously can be incorporated into AFOSM reliability analysis. The Ang-Tang algorithm, outlined below, first performs the orthogonal decomposition, followed by the normalization, for problems involv­ing multivariate nonnormal stochastic variables (Fig. 4.12).

The Ang-Tang AFOSM algorithm for problems involving correlated nonnor­mal stochastic variables consists of the following steps:

Step 1: Decompose correlation matrix Rx to find its eigenvector matrix Vx and eigenvalues Лх using appropriate techniques.

Step 2: Select an initial point x(r) in the original parameter space.

Step 3: At the selected point x(r), compute the mean and variance of the performance function W(X) according to Eqs. (4.56) and (4.43), respectively.

Step 4: Compute the corresponding reliability index во-) according to Eq. (4.8).

Step 5: Compute the mean pkN,(r) and standard deviation akN,(r) of the normal equivalent using Eqs. (4.60) and (4.61) for the nonnormal stochastic variables.

Step 6: Compute the sensitivity coefficient vector with respect to the per­formance function sz>,(r) in the independent, standardized normal z’-space, according to Eq. (4.68), with Dx replaced by DxN,(r).

Step 7: Compute the vector of directional derivatives a? (r) according to Eq. (4.67).

Step 8: Using во-) and a^ ,о) obtained from steps 4 and 7 , compute the location of solution point z(r +in the transformed domain according to Eq. (4.70).

Step 9: Convert the obtained expansion point z(r+1) back to the original pa­rameter space as

x (r + 1) = px, N,(r) + D x, N,(r) Vx ЛУ2 z (r +1) (4.73)

in which px, N,(r) is the vector of means of normal equivalent at solution point x(r), and Dx, N,(r) is the diagonal matrix of normal equivalent variances.

Step 10: Check if the revised expansion point x(r+1) differs significantly from the previous trial expansion point x (r). If yes, use the revised expansion point as the trial point by letting x(r) = x(r+1), and go to step 3 for another iteration. Otherwise, the iteration is considered complete, and the latest reliability index во) is used in Eq. (4.10) to compute the reliability ps.

Step 11: Compute the sensitivity of the reliability index and reliability with respect to changes in stochastic variables according to Eqs. (4.48), (4.49), (4.51), (4.69), and (4.58), with Dx replaced by D x, n at the design point x^.

One drawback of the Ang-Tang algorithm is the potential inconsistency be­tween the orthogonally transformed variables U and the normal-transformed space in computing the directional derivatives in steps 6 and 7. This is so be­cause the eigenvalues and eigenvectors associated with Rx will not be identical to those in the normal-transformed variables. To correct this inconsistency, Der Kiureghian and Liu (1985), and Liu and Der Kiureghian(1986) developed a
normal transformation that preserves the marginal probability contents and the correlation structure of the multivariate nonnormal random variables.

Suppose that the marginal PDFs of the two stochastic variables Xj and Xk are known to be f j (Xj) and fk (xk), respectively, and their correlation coefficient is pjk. For each individual random variable, a standard normal random variable that satisfies Eq. (4.59) is

Ф( Zj) = Fj (Xj) Ф( Zk) = Fk (Xk) (4.74)

By definition, the correlation coefficient between the two stochastic variables X j and Xk satisfies

Xj J j f Xk Jk


AFOSM reliability analysis for nonnormal correlated stochastic variables

G


Gk


(4.75)


Xj Xj f Xk ixk

Gk


fj, k (Xj, Xk) dxj dxk


AFOSM reliability analysis for nonnormal correlated stochastic variables

where xk and Gk are, respectively, the mean and standard deviation of Xk. By the transformation of variable technique, the joint PDF f j, k (Xj, Xk) in Eq. (4.75) can be expressed in terms of a bivariate standard normal PDF as dj dn

Подпись: fj ,k (Xj , Xk) = Ф (zj, Zk | Pjk )д X j d Xk d Zk d Zk d Xj d Xk

where ф(Zj, zk | pjk ) is the bivariate standard normal PDF for Zj and Zk having zero means, unit standard deviations, and correlation coefficient pjk, and the elements in Jacobian matriX can be evaluated as

AFOSM reliability analysis for nonnormal correlated stochastic variables Подпись: for j = k

dZk _ дф—^ЫУ] _ fk (Xk) dXk dXk Ф (Zk )

Then the joint PDF of Xj and Xk can be simplified as

fj I Xj, Xk) = HZ,,Zk |pjk) – ф^ Фф* 14.76)

Подпись: P jk = AFOSM reliability analysis for nonnormal correlated stochastic variables Подпись: xj Л Gj Подпись: xk /Xk Gk Подпись: Фjk (zj, Zk |pjk) dzj dzk Подпись: (4.77)

Substituting Eq. (4.76) into Eq. (4.75) results in the Nataf bivariate distribution model (Nataf, 1962):

in which Xk = F— 1 [Ф (Zk)].

Two conditions are inherently considered in the bivariate distribution model of Eq. (4.77):

1. According to Eq. (4.74), the normal transformation satisfies,

Zk — ф-^Fk (Xk)] for k — 1,2,…, K (4.78)

This condition preserves the probability content in both the original and the standard normal spaces.

2. The value of the correlation coefficient in the normal space lies between -1 and +1.

For a pair of nonnormal stochastic variables Xj and Xk with known means ц j and nk, standard deviations oj and ok, and correlation coefficient pjk, Eq. (4.77) can be applied to solve for pjjk. To avoid the required computation for solving pjjk in Eq. (4.74), Der Kiureghian and Liu (1985) developed a set of semiempirical formulas as

pjk — Tjkpjk (4.79)

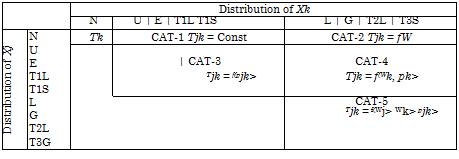
in which Tjk is a transformation factor depending on the marginal distributions and correlation of the two random variables considered. In case both the random variables under consideration are normal, the transformation factor Tjk has a value of 1. Given the marginal distributions and correlation for a pair of random variables, the formulas of Der Kiureghian and Liu (1985) compute the corresponding transformation factor Tjk to obtain the equivalent correlation pjk as if the two random variables were bivariate normal random variables. After all pairs of stochastic variables are treated, the correlation matrix in the correlated normal space Rz is obtained.

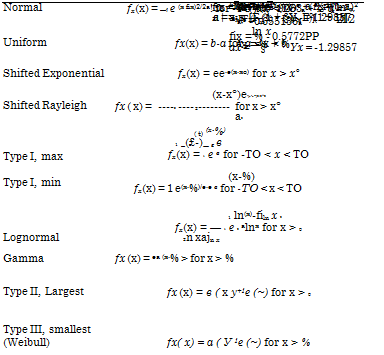
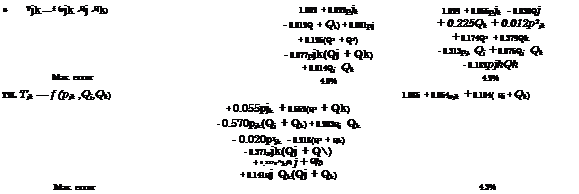
Ten different marginal distributions commonly used in reliability computa­tions were considered by Der Kiureghian and Liu (1985) and are tabulated in Table 4.4. For each combination of two distributions, there is a corresponding formula. Therefore, a total of 54 formulas for 10 different distributions were developed, and they are divided into five categories, as shown in Fig. 4.13. The complete forms of these formulas are given in Table 4.5. Owing to the semiem­pirical nature of the equations in Table 4.5, it is a slight possibility that the resulting pjk may violate its valid range when pjk is close to -1 or +1.

Based on the normal transformation of Der Kiureghian and Liu, the AFOSM reliability analysis for problems involving multivariate nonnormal random variables can be conducted as follows:

Step 1: Apply Eq. (4.77) or Table 4.5 to construct the correlation matrix Rz for the equivalent random variables Z in the standardized normal space.

Step 2: Decompose correlation matrix Rz to find its eigenvector matrix Vz and eigenvalues Xz’s using appropriate orthogonal decomposition techniques. Therefore, Z’ — Л-1/2 VzZ is a vector of independent standard normal ran­dom variables.

TABLE 4.4 Definitions of Distributions Used in Fig. 4.13 and Table 4.5

Подпись: Moments and parameters relationsAFOSM reliability analysis for nonnormal correlated stochastic variables
Distributions PDF

Подпись: Distribution of Xk N U | E | T1L T1S L | G | T2L | T3S Distribution of Xj N U E T1L T1S L G T2L T3G Tk CAT-1 Tjk = Const CAT-2 Tjk = fW | CAT-3 Tjk = f(pjk> CAT-4 Tjk = f(Wk, pk> CAT-5 Tjk = f(Wj> Wk> pjk>

Note:

Подпись: T1S = Type 1 smallest L = Lognormal G = Gamma T2L = Type 2 largest T3S = Type 3 smallestN = Normal

U = Uniform

E = Shifted exponential

T1L = Type 1 largest

pk = Correlation coefficient

Figure 4.13 Categories of the normal transformation factor Tjk – (After Der Kiureghi-n and Liu, 1985).

AFOSM reliability analysis for nonnormal correlated stochastic variables

TABLE 4.5 Semiempirical Normal Transformation Formulas (a) Category 1 of the transformation factor j in Fig. 4.13

U

E

R

T1L

T1S

N

Tjk = constant

1.023

1.107

1.014

1.031

1.031

Max. error

0.0%

0.0%

0.0%

0.0%

0.0%

NOTE: Distribution indices are N = normal; U = uniform; E = shifted exponential; R = shifted Rayleigh; T1L = type 1, largest value; T1S = type 1, smallest value.

(b) Подпись: 195
Category 2 of the transformation factor Tjk in Fig. 4.13

L

G

T2L

T3S

Tjk = f (Qk)

N

Max. error

Qk

1.001 – 1.007Qk + 0.118Q 0.0%

1.030 + 0.238Qk + 0.364Q 0.1%

1.031 – 0.195Qk + 0.328Qk 0.1%

Zln(1+Qk)

Exact

NOTE: Qk is the coefficient of variation of the j th variable; distribution indices are N type 3, smallest value.

SOURCE: After Der Kiureghian and Liu (1985).

= normal; L = lognormal; G = gamma; T2L

= type 2, largest value; T3S =

(Continued)

U

E

R

T1L

T1S

U

Tjk = f(Pjk)

1.047 – 0.047pjk

1.133 + 0.029pjk

1.038 – 0.008p2k

1.055 + 0.015p2k

1.055 + 0.015p2k

Max. error

0.0%

0.0%

0.0%

0.0%

0.0%

E

Tjk = f(Pjk)

1.229 – 0.367pjk

1.123 – 0.100pjk

1 . 142 – 0 . 154 p jk

1.142 + 0.154p jk

+ °.153p! k

+ 0.021p|k

+ 0.031p|k

+ °.°31p2k

Max. error

1.5%

0.1%

0.2%

0.2%

R

Tjk = f(Pjk)

1.028 – 0.029pjk

1 . 046 – 0 . 045 p jk

1.046 + 0.045p jk

+ 0.006p2k

+ 0.006p2jk

Max. error

0.0%

0.0%

0.0%

T1L

Tjk = f(Pjk)

1.064 – 0.069pjk

1.064 + 0.069p jk

+ 0.005pj

+ 0.005pjk

Max. error

0.0%

0.0%

T1S

Tjk = f(Pjk)

1.064 – 0.069pjk

+ 0.005p2k

Max. error

0.0%

TABLE 4.5 Semiempirical Normal Transformation Formulas (Continued) (c) Category 3 of the transformation factor Tjk in Fig. 4.11

Подпись: 196
NOTE: pjk is the correlation coefficient between the j th variable and the kth variable; distribution indices are U = uniform; E = shifted exponential; R = shifted Rayleigh; T1L = type 1, largest value; T1S = type 1, smallest value.

L

G

T2L

T3S

U

Tjk — f(pjk, Qk )

1.019 + 0.014Qk + 0.010p2k + 0.249Q2

1.023 – 0.007Qk + 0.002p2k + 0.127Q?

1.033 + 0.305Qk + 0.074p2k

+ 0.405Qk

1.061 – 0.237Qk – 0.005p2jk + 0.379Q?

Max. error

0.7%

0.1% k

2.1% k

0.5% k

E

Tjk — f (pjk, Qk )

1.098 + 0.003pjk + 0.019Qk + 0.025p2k + 0.303Q2 – 0.437pjkQk

1.104 + 0.003pjk – 0.008Qk + 0.014p2k + 0.173Qk – 0.296pjkQk

1.109 – 0.152pjk + 0.361Qk + 0.130p2k + 0.455 Q2 – 0.728pjkQk

1.147 + 0.145pjk – 0.271Qk + 0.010p2k + 0.459Qk – 0.467pjkQk

Max. error

1.6%

0.9%

0.9%

0.4%

R

Tjk — f (pjk, Qk )

1.011 + 0.001pjk + 0.014Qk + 0.004p2k + 0.231Qk – 0.130pjkQk

1.014 + 0.001pjk – 0.007Qk + 0.002p2k + 0.126Qk

– 0.090pjkQk

1.036 – 0.038pjk + 0.266Qk

+ 0.028p2k + 0.383 Qk – 0.229pjkQk

1.047 + 0.042pjk – 0.212Qk + 0.353Qk – 0.136pjkQk

Max. error

0.4%

0.9%

1.2%

0.2%

T1L

Tjk — f (pjk, Qk )

1.029 + 0.001pjk + 0.014Qk + 0.004p2k + 0.233Qk -0.197pjkQk

1.031 + 0.001pjk – 0.007Qk + 0.003p2k + 0.131Qk -0.132pjkQk

1.056 – 0.060pjk + 0.263Qk + 0.020p2k + 0.383 Qk -0.332p jkQk

1.064 + 0.065pjk – 0.210Qk + 0.003p2k + 0.356Qk -0.211pjkQk

Max. error

0.3%

0.3%

1.0%

0.2%

T1S

Tjk — f (pjk, Qk )

1.029 + 0.001pjk + 0.014Qk + 0.004p2k + 0.233Qk + 0.197p jkQk

1.031 – 0.001pjk – 0.007Qk + 0.003p2k + 0.131Qk

+ 0.132pjk Qk

1.056 + 0.060pjk + 0.263Qk + 0.020p2jk + 0.383 Qk

+ °.332pjk Qk

1.064 – 0.065pjk – 0.210Qk + 0.003p2k + 0.356Qk + 0.211p jkQk

Max. error

0.3%

0.3%

1.0%

0.2%

NOTE: pjk is the correlation coefficient between the j th variable and the kth variable; Qk is the coefficient of variation of the kth variable; distribution indices are U = uniform; E = shifted exponential; R = shifted Rayleigh; T1L = type 1, largest value; T1S = type 1, smallest value; L = lognormal; G = gamma; T2L = type 2, largest value; T3S = type 3 smallest value.

Подпись: 197
(Continued)


Подпись: 198

TABLE 4.5 Semiempirical Normal Transformation Formulas (Continued) (e) Category 5 of the transformation factor Tjk in Fig. 4.13


L G T2L T3S


Tjk — f (pjk, Qk) ——— 1п(1+р-^ ak) 1.001 + 0.033pjk + 0.004Qj

pjky 1n 0+j ln(1+Qk) – 0.016^k + 0.002pjk

+ 0.223Q2 + 0.130^k
– 0.104pjkQj + 0.029Ц; Qk
– 0.119pjk&k

Max. error Exact 4.0%


1.026 + 0.082pjk – 0.019Qj
– 0.222Qk + 0.018pjk + 0.288Q2
+ 0.379Q2 – 0.104pjkQj
+ 0.12601 j Qk – 0.277pjkQk

4.3%


1.31 + 0.052pjk + 0.011Q j

– 0.21Qk + 0.002p2k + 0.22Q2

+ 0.35Qk + 0.005pQj-
+ 0.009Qj Qk – 0.174pQk

2.4%

1.32 + 0.034pjk – 0.007Qj – 0.202Qk + 0.121Q2

+ 0.339Q2 – 0.006pQj
+ 0.003Q7^ Qk – 0.111pQk

4.0%

1.065 + 0.146pjk + 0.241Q j

– 0.259Qk + 0.013p2k + 0.372Q2

+ 0.435Q2 + 0.005pQj-
+ 0.034Qj Qk – 0.481pQk


L


AFOSM reliability analysis for nonnormal correlated stochastic variables

3.8%


1.063 – 0.004pjk – 0.200(Qj + Qk)
– 0.001pj + 0.337(Q2 + Qk)

+ 0.007p(Qj + Qk) – 0.007Qj Qk
2.62%


T3S Tjk — f (pjk ,Qj, Qk)


Max. error


NOTE: pjk is the correlation coefficient between the jth variable and the kth variable; Qj is the coefficient of variation of the j th variable; Qk is the coefficient of variation of the kth variable; distribution indices are L — lognormal; G — gamma; T2L — type 2, largest value; T3S — type 3, smallest value.


Step 3: Select an initial point x(r) in the original parameter space X, and com­pute the sensitivity vector for the performance function sx,(r) = VxW(x(r>).

AFOSM reliability analysis for nonnormal correlated stochastic variables Подпись: (4.80)

Step 4: At the selected point x(r), compute the means (j, N,(r) = (p.1N, p.2N,…, IJ-knY and standard deviations aN,(r) = (o1N, o2N,…, oKN)1 of the normal equivalent using Eqs. (4.59) and (4.60) for the nonnormal stochastic variables. Compute the corresponding point zr) in the independent standardized nor­mal space as

in which Dx, N,(r) = diag(o2N, o^N,…, oKN), a diagonal matrix containing the variance of normal equivalent at the selected point x(r). The correspond­ing reliability index can be computed as fi(r) = sign[W/(0)]|z(r)|.

Step 5: Compute the vector of sensitivity coefficients for the performance function in Z’-space sz>,(r) = Vz> W(zr)), by Eq. (4.68), with Dx replaced by D x, n,(r), and x and &x replaced by V’z and Л^, respectively. Then the vector of directional derivatives in the independent standard normal space az ,(r) can be computed by Eq. (4.67).

Step 6: Apply Eq. (4.51) of the Hasofer-Lind algorithm or Eq. (4.70) of the Ang-Tang algorithm to obtain a new solution z (r +1).

Step 7: Convert the new solution z(r+1) back to the original parameter space by Eq. (4.66a), and check for convergence. If the new solution does not satisfy convergence criteria, go to step 3; otherwise, go to step 8.

Step 8: Compute the reliability, failure probability, and their sensitivity vec­tors with respect to change in stochastic variables.

Note that the previously described normal transformation of Der Kiureghian and Liu (1985) preserves only the marginal distributions and the second-order correlation structure of the correlated random variables, which are partial statistical features of the complete information represented by the joint dis­tribution function. Regardless of its approximate nature, the normal transfor­mation of Der Kiureghian and Liu, in most practical engineering problems, rep­resents the best approach to treat the available statistical information about the correlated random variables. This is so because, in reality, the choices of multivariate distribution functions for correlated random variables are few as compared with univariate distribution functions. Furthermore, the derivation of a reasonable joint probability distribution for a mixture of correlated non­normal random variables is difficult, if not impossible. When the joint PDF for the correlated nonnormal random variables is available, a practical normal transformation proposed by Rosenblatt (1952) can be viewed as the generaliza­tion of the normal transformation described in Sec. 4.5.5 for the case involving independent variables. Notice that the correlations among each pair of ran­dom variables are implicitly embedded in the joint PDF, and determination of correlation coefficients can be made according to Eqs. (2.47) and (2.48).

The Rosenblatt method transforms the correlated nonnormal random vari­ables X to independent standard normal random variables Z’ in a manner similar to Eq. (4.78) as

z[ = Ф ЧFi(xi)] z2 = Ф-1[F2(X2 |xi)]

Подпись: (4.8i)zk = Ф 1[Fk(Xk|xi, X2, Xk-i)]

z’K = Ф 1[Fk(XK|Xi, X2,Xk—1)]

Подпись: f(Xi,X2, •••,Xk—i,Xk) f (Xi, X2, ..., Xk — i)
Подпись: fk (Xk |Xi, X2,..., Xk—i)

in which Fk(Xk |Xi, X2,, Xk—i) = P(Xk < Xk |x1, X2,…, Xk—i) is the conditional CDF for the random variable Xk conditional on X1 = X1, X 2 = X2,…, Xk—1 = Xk—1. Based on Eq. (2.17), the conditional PDF fk (Xk X2,…, Xk—1) for the random variable Xk can be obtained as

Подпись: Fk (Xk |xi, X2,..., Xk—i) Подпись: /—^ f (Xi, X2, ..., Xk — i, t) dt f (Xi, X2, ..., Xk — i) Подпись: (4.82)

with f (x1,X2,…,Xk—1,Xk) being the marginal PDF for X1,X2,…,Xk—1,Xk; the conditional CDF Fk(xk |x1, x2,…, xk—1) then can be computed by

To incorporate the Rosenblatt normal transformation in the AFOSM algo­rithms described in Sec. 4.5.5, the marginal PDFs fk (xk) and the conditional CDFs Fk(xk|x1, x2,…, xk—1), for k = 1, 2,…, K, first must be derived. Then Eq. (4.81) can be implemented in a straightforward manner in each itera­tion, within which the elements of the trial solution point x(r) are selected successively to compute the corresponding point in the equivalent independent standard normal space z(rand the means and variances by Eqs. (4.80) and (4.81), respectively. It should be pointed out that the order of selection of the stochastic basic variables in Eq. (4.81) can be arbitrary. Madsen et al. (1986, pp. 78-80) show that the order of selection may affect the calculated failure probability, and their numerical example does not show a significant difference in resulting failure probabilities.

Treatment of correlated normal stochastic variables

When some of the stochastic basic variables involved in the performance func­tion are correlated, transformation of correlated variables to uncorrelated ones is made. Consider that the stochastic basic variables in the performance func­tion are multivariate normal random variables with the mean matrix p, x and the covariance matrix Cx. Without losing generality, the original stochastic basic variables are standardized according to Eq. (4.30) as X’ = D—1|2(X — p, x).

Therefore, the standardized stochastic basic variables X’ have the mean 0 and covariance matrix equal to the correlation matrix Rx. That is, Cx = Rx = [pjjk], with pjk being the correlation coefficient between stochastic basic variables Xj and Xk.

To break the correlative relation among the stochastic basic variables, or­thogonal transformation techniques can be applied (see Appendix 4C). As an example, through eigenvalue-eigenvector (or spectral) decomposition, a new vector of uncorrelated stochastic basic variables U can be obtained as

U = V1X’ (4.64)

in which Vx is the normalized eigenvector matrix of the correlation matrix Rx of the original random variables. The new random variables U have a mean vector 0 and covariance matrix Lx = diag(Xb X2,…, ), which is a diagonal

matrix containing the eigenvalues of Rx. Hence the standard deviation of each uncorrelated standardized stochastic basic variable Uk is the square root of the corresponding eigenvalue, that is, VX*. Further standardization of U leads to

Y = Л – 1/2U (4.65)

in which Y are uncorrelated random variables having a mean vector 0 and covariance matrix I being an identity matrix.

Consider that the original stochastic basic variables are multivariate nor­mal random variables. The orthogonal transformation by Eq. (4.64) is a linear transformation; the resulting transformed random variables U are individu­ally normal but uncorrelated; that is, U ~ N(0, L) and Y = Z’ ~ N(0, I). Then the relationship between the original stochastic basic variables X and the uncorrelated standardized normal variables Z’ can be written as

Z’ = Л-1/2 VxD-1/2(X – »x) (4.66a)

X = vx + D1/2 V x Л1/2 Z’ (4.66b)

in which Лx and Vx are, respectively, the eigenvalue matrix and eigenvector matrix corresponding to the correlation matrix Rx.

In the transformed domain as defined by Z’, the directional derivatives of the performance function in z ‘-space can be computed, according to Eq. (4.37), as

Подпись: (4.67)Vz – W'(z 0 |V* W'(z 0|

in which the vector of sensitivity coefficients in Z’-space sz> = Vz W'(z’) can be obtained from VxW (x) using the chain rule of calculus, according to Eq. (4.66b), as

д X* 9 Zj


VxW (x)


Sz’ = Vz W (z’)


Подпись: (4.68)D1/2VxЛУ2 ) VxW(x) = ЛУ2DУ2VtSx

in which sx is the vector of sensitivity coefficients of the performance function with respect to the original stochastic basic variables X.

Подпись: Vx в Подпись: d Xk Подпись: V* в Подпись: (A-1/2 VX D -1/2)г V* в Подпись: D-i/2VxA-1/2az, (4.69)

After the design point is found, one also is interested in the sensitivity of the reliability index and failure probability with respect to changes in the involved stochastic basic variables. In the uncorrelated standardized normal Z’-space, the sensitivity of в and ps with respect to Z’ can be computed by Eqs. (4.49) and (4.50) with X’ replaced by Z’. The sensitivity of в with respect to X in the original parameter space then can be obtained as

from which the sensitivity for ps can be computed by Eq. (4.50b). A flowchart using the Ang-Tang algorithm for problems involving correlated stochastic basic variables is shown in Fig. 4.12. Step-by-step procedures for the corre­lated normal case by the Hasofer-Lind and Ang-Tang algorithms are given as follows.

The Hasofer-Lind AFOSM algorithm for problems having correlated normal stochastic variables involves the following steps:

Step 1: Select an initial trial solution x(r).

Step 2: Compute W(x(r>) and the corresponding sensitivity coefficient vector

Sx,(r ) *

Подпись:Подпись: (4.70)

Подпись: fx) sx,(r) W(x(r}) sx,(r) CxSx,(r >
Подпись: x (r +1) — fx + Cx SX,(r )

Step 3: Revise solution point xо+i> according to

Step 4: Check if x(r) and x(r+1) are sufficiently close. If yes, compute the reliability index в(г) according to

в AFOSM — [(x* – fix ) Cx1(xif – fix )]1/2 (4.71)

and the corresponding reliability ps — then, go to step 5. Other­

wise, update the solution point by letting x(r) — x(r+1) and return to step 2.

Step 5: Compute the sensitivity of the reliability index and reliability with respect to changes in stochastic basic variables at the design point x* by Eqs. (4.49), (4.50), (4.69), and (4.58).

On the other hand, the Ang-Tang AFOSM algorithm for problems involving correlated, normal stochastic basic variables consists of following steps:

Step 1: Decompose the correlation matrix Rx to find its eigenvector matrix Vx and eigenvalues Vs, using appropriate techniques.

Step 2: Select an initial point x(r) in the original parameter space.

Step 3: At the selected point x(r) compute the mean and variance of the performance function W(X) according to Eqs. (4.56) and (4.43), respectively.

Подпись: Figure 4.12 Flowchart for the Ang-Tang AFOSM reliability analysis involving correlated variables.
Step 4: Compute the corresponding reliability index ) according to Eq. (4.34).

Step 5: Compute sensitivity coefficients sz> in the uncorrelated standard nor­mal space according to Eq. (4.68) and the vector of directional derivatives a’Xr) according to Eq. (4.67).

Step 6: Using в(г) and ) obtained from steps 4 and 5, compute the location

Подпись: zk,(r +1) = ak,(r)P(r) Подпись: for k = 1, 2,..., K Подпись: (4.72)

of expansion point z r +1> in the uncorrelated standard normal space as

Step 7: Convert the obtained expansion point zT +p back to the original pa­rameter space according to Eq. (4.66b).

Step 8: Check if the revised expansion point x(r+p differs significantly from the previous trial expansion point x (r). If yes, use the revised expansion point as the trial point by letting x(r) = x(r+p, and go to step 3 for another iteration. Otherwise, the iteration procedure is considered complete, and the latest reliability index в(г) is used to compute the reliability ps = Ф(во)).

Step 9: Compute the sensitivity of the reliability index and reliability with respect to changes in stochastic basic variables at the design point x+ by Eqs. (4.49), (4.50), (4.69), and (4.68).

Example 4.11 (Correlated, normal) Refer to the data in Example 4.9 for the storm sewer reliability analysis problem. Assume that Manning’s roughness coefficient n and pipe diameter D are dependent normal random variables having a correlation coefficient of -0.75. Furthermore, the pipe slope S also is a normal random variable but is independent of Manning’s roughness coefficient and pipe size. Compute the re­liability that the sewer can convey an inflow discharge of 35 ft3/s by the Hasofer-Lind algorithm.

Solution The initial solution is taken to be the means of the three stochastic basic vari­ables, namely, xq) = p, x = (ц, п, xd, xs/ = (0.015,3.0,0.005/. Since the stochastic basic variables are correlated normal random variables with a correlation matrix as follows:

1.0

Pn, D

Pn, S

1.00

-0.75

0.00

Rx =

pn, D

1.0

PD, S

=

-0.75

1.00

0.00

.Pn, S

PD, S

1.0

0.00

0.00

1.00

by the spectral decomposition, the eigenvalues matrix associated with the correlation matrix Rx is Лх = diag(1.75, 0.25, 1.00), and the corresponding eigenvector matrix Vx is

0.7071 0.7071 0.0000 -0.7071 0.7071 0.0000 0.0000 0.0000 1.0000

At x(i) = (0.015, 3.0, 0.005/, the sensitivity vector for the performance function

W(n, D, S) = (QC – Ql) = 0.463П1 D8/3S1/2 – 35

is sx (1) = (9W/дn, dW/дD, dW/дS) = (-2734, 36.50, 4101/

and the value of the performance function W(x(1)) = 6.010, is not equal to zero. This indicates that the solution point x(1) does not lie on the limit-state surface. Applying Eq. (4.70), the new solution x(2) can be obtained as x(2) = (0.01569, 2.900, 0.004885). The difference between the two consecutive solutions is computed as

9 = |x(1) – x(2)| = [(0.01569 – 0.015)2 + (2.9 – 3.0)2 + (0.004885 – 0.005)2]0 5

= 0.1002

which is considered large, and therefore, the iteration continues. The following table lists the solution point x(r), its corresponding sensitivity vector sx,(r), and the vector of directional derivatives azi,(r), in each iteration. The iteration stops when the Eu­clidean distance between the two consecutive solution points is less than 0.001 and the value of the performance function is less than 0.001.

Iteation

Var.

x (r )

s (r )

a(r)

x(r+1)

r = 1

n

0.1500 x 10—01

—0.2734 x 10+04

—0.9681 x 10+00

0.1599 x 10—01

D

0.3000 x 10+01

0.3650 x 10+02

0.2502 x 10+00

0.2920 x 10+01

S

0.5000 x 10—02

0.4101 x 10+04

0.1203 x 10—01

0.4908 x 10—02

s

= 0.8008 x 10—01

W = 0.6010 x 10+01

в = 0.000 x 10+00

r = 2

n

0.1599 x 10—01

—0.2217 x 10+04

—0.9656 x 10+00

0.1607 x 10—01

D

0.2920 x 10+01

0.3242 x 10+02

0.2583 x 10+00

0.2912 x 10+01

S

0.4908 x 10—02

0.3612 x 10+04

0.2857 x 10—01

0.4897 x 10—02

s =

0.7453 x 10 — 02

W = 0.4565 x 10+00

в = 0.1597 x 10+01

r = 3

n

0.1607 x 10—01

—0.2178 x 10+04

—0.9654 x 10+00

0.1607 x 10—01

D

0.2912 x 10+01

0.3209 x 10+02

0.2591 x 10+00

0.2912 x 10+01

S

0.4897 x 10—02

0.3574 x 10+04

0.2991 x 10—01

0.4896 x 10—02

s

= 0.7101 x 10—04

W = 0.2992 x 10—02

в = 0.1598 x 10+01

After four iterations, the solution converges to the design point x* = (n*, D*, S*)f = (0.01607, 2.912, 0.004896)г. At the design point x*, W = 0.5 7 5 8 x 10—07, and the mean and standard deviation of the performance function W can be estimated, by Eqs. (4.42) and (4.43), respectively, as

jlw* — 5.510 and &w* — 3.448

The reliability index then can be computed as в* = pw* /aw* = 1.598, and the corre­sponding reliability and failure probability can be computed, respectively, as

ps = Ф(в*) = 0.9450 pf = 1 — ps = 0.055

Finally, at the design point x*, the sensitivity of the reliability index and reliabil­ity with respect to each of the three stochastic basic variables can be computed by Eqs. (4.49), (4.50), (4.56), and (4.57). The results are shown in the following table:

Variable

(1)

x

(2)

a*

(3)

дв/д z (4)

д Ps/д z

(5)

дв/д x (6)

д ps/д x (7)

хдв/вдx (8)

xд ps / Psд x (9)

n

0.01607

—0.9654

0.9654

0.1074

690.3

76.81

11.09

1.234

D

2.912

0.2591

—0.2591

—0.02883

—119.6

—13.31

—348.28

—38.76

S

0.004896

0.02991

—0.02991

—0.003328

—1814.

—201.9

—8.881

—0.9885