Category Hydrosystems Engineering Reliability Assessment and Risk Analysis

Relationships among failure density function, failure rate, and reliability

According to Eq. (5.3), given the failure density function ft(t) it is a straight­forward task to derive the failure rate h(t). Furthermore, based on Eq. (5.3), the reliability can be computed directly from the failure rate as

Ps(t) = exp


I h(x) dr

0


(5.10)


Подпись: ft (t) = h(t) exp Подпись: I h(x)dr 0 Подпись: (5.11)

Substituting Eq. (5.10) into Eq. (5.3), the failure density function ft(t) can be expressed in terms of the failure rate as

Example 5.3 (after Mays and Tung, 1992) Empirical equations have been developed for the break rates of water mains using data from a specific water distribution system. As an example, Walski and Pelliccia (1982) developed break-rate equations for the water distribution system in Binghamton, New York. These equations are

Pit cast iron: N(t) = 0.02577e00207t

Sandspun cast iron: N(t) = 0.0627e00137t

where N (t) is the break rate (in number of breaks per mile per year), and t is the age of the pipe (in years). The break rates versus the ages of pipes for the preceding two types of cast iron pipes are shown in Fig. 5.9. Derive the expressions for the failure rate, reliability, and failure density function for a 5-mile water main of sandspun cast iron pipe.

Solution The break rate per year (i. e., failure rate or hazard function for the 5-mile water main) for sandspun cast iron pipe can be calculated as

h(t) = 5 miles x N(t) = 0.3185e00137t

The reliability of this 5-mile water main then can be computed using Eq. (5.10) as ps(t) = exp^- J 0.3185e0 0137T d^j = exp[23.25(1 – e00137t)]

Подпись: Pipe Break Rate (Breaks/Mile/Year)

Figure 5.9 Break-rate curves for sandspun cast iron and pit cast iron pipes.


Relationships among failure density function, failure rate, and reliability

ft(t) = 0.3185e00137t x exp[23.25(1 – e00137t)]

The curves for the failure rate, reliability, and failure density function of the 5-mile sandspun cast iron water main are shown in Fig. 5.10.

Typical hazard functions

The failure rate for many systems or components has a bathtub shape, as shown in Fig. 5.8, in that three distinct life periods can be identified (Harr, 1987). They are the early-life (or infant mortality) period, useful-life period, and wear-out – life period. Kapur (1989b) differentiates three types of failure that result in the bathtub type of total failure rate, as indicated in Fig. 5.8. It is interesting to note that the failure rate in the early-life period is higher than during the useful-life period and has a decreasing trend with age. In this early-life period, quality failures and stress-related failures dominate, with little contribution from wear-out failures. During the useful-life period, all three types of failures contribute to the potential failure of the system or component, and the overall failure rate remains more or less constant over time. From Example 5.1, the exponential distribution could be used as the failure density function for the useful-life period. In the later part of life, the overall failure rate increases with age. In this life stage, wear-out failures and stress-related failures are the main contributors, and wear-out becomes an increasingly dominating factor for the failure of the system with age.

Quality failures, also called break-in failures (Wunderlich, 1993, 2004), are mainly related to the construction and production of the system, which could be caused by poor construction and manufacturing, poor quality control and workmanship, use of substandard materials and parts, improper installation, and human error. Failure rate of this type generally decreases with age. Stress – related failures generally are referred to as chance failures, which occur when loads on the system exceed its resistance, as described in Chap. 4. Possible causes of stress-related failures include insufficient safety factors, occurrence

Подпись: Figure 5.8 Bathtub failure rate with its three components.

of higher than expected loads or lower than expected random strength, misuse, abuse, and/or an act of God. Wear-out failures are caused primarily by aging; wear; deterioration and degradation in strength; fatigue, creep, and corrosion; or poor maintenance, repair, and replacement.

The failure of the 93-m-high Teton Dam in Idaho in 1976 was a typical exam­ple of break-in failure during the early-life period (Arthur, 1977; Jansen, 1988). The dam failed while the reservoir was being filled for the first time. Four hours after the first leakage was detected, the dam was fully breached. There are other examples of hydraulic structure failures during different stages of their service lives resulting from a variety of causes. For examples, in 1987 the foundation of a power plant on the Mississippi River failed after a 90-year service life (Barr and Heuer, 1989), and in the summer of 1993 an extraordinary sequence of storms caused the breach of levees in many parts along the Mississippi River. The failures and their impacts can be greatly reduced if proper maintenance and monitoring are actively implemented.

Cumulative hazard function and average failure rate

Similar to the cumulative distribution function (CDF), the cumulative hazard function can be obtained from integrating the instantaneous hazard function h(t) over time as

Подпись: (5.5)Подпись: (5.6)H(t) = f h(t) dt

J0

Referring to Eq. (5.3), the hazard function can be written as

1 d [pf (t)] 1 d [ps(t)]

Ps (t) dt ps(t) dt

Подпись: H(t)
Cumulative hazard function and average failure rate Подпись: Ґ -d [ps(t)] 0 ps(t) Подпись: ln[ ps (t )]0 = ln[ ps (t)] Подпись: (5.7)

Multiplying dt on both sides of Eq. (5.6) and integrating them over time yields

under the initial condition of ps(0) = 1.

Unlike the CDF, interpretation of the cumulative hazard function is not sim­ple and intuitive. However, Eq. (5.7) shows that the cumulative hazard function is equal to ln[1/ps(t)]. This identity relationship is especially useful in the sta­tistical analysis of reliability data because the plot of the sample estimation
of 1/ps(t) versus time on semi-log paper reveals the behavior of the cumula­tive hazard function. Then the slope of ln[1/ps(t)] yields directly the hazard function hit). Numerical examples showing the analysis of reliability data can be found elsewhere (O’Connor, 1981, pp. 58-87; Tobias and Trindade, 1995, pp. 135-160).

Since the hazard function h(t) varies over time, it is sometimes practical to use a single average value that is representative of the failure rate over a time interval of interest. The averaged failure rate (AFR) in the time interval [t1, t2] can be defined as

Cumulative hazard function and average failure rate

/t? h(t)dt

t2 — t1


ln[ps(t1)] – ln[ps(t2)]
t2 — t1


h (t2) – h (tp

t2 — t1


AFR(t1, t2)


(5.8)


Cumulative hazard function and average failure rate

Therefore, the averaged failure rate of a component or system from the begin­ning over a time period (0, t] can be computed as

AFR(0, t) = —lj[p-lt)] (5.9)

The failure rate, in general, has the conventional unit of number of failures per unit time. For a component with a high reliability, the failure rate will be too small for the conventional unit to be appropriate. Therefore, the scale frequently used for the failure rate is the percent per thousand hours (%K) (Ramakumar, 1993; Tobias and Trindade, 1995). One percent per thousand hours means an expected rate of one failure for each 100 units operating 1000 hours. Another scale for even higher-reliability components is parts per million per thousand hours (PPM/K), which means the expected number of failures out of one million components operating for 1000 hours. The PPM/K is also called the failures in time (FIT). If the failure rate h(t) has the scale of number of failures per hour, it is related to the %K and PPM/K as follows:

1%K = 105 x h(t) 1 PPM/K = 1 FIT = 108 x h(t)

Example 5.1 Consider a pump unit that has an exponential failure density as

ft(t) = ke~lt for t > 0, к > 0

in which к is the number of failures per unit time. The reliability of the pump in time period (0, t], according to Eq. (5.1), is

/

TO

ke-kt dt = e-kt

as shown in Table 5.1. The failure rate for the pump, according to Eq. (5.3), is

Подпись: h(t) =ft (t)

ps(t)

which is a constant. Since the instantaneous failure rate is a constant, the averaged failure rate for any time interval of interest also is a constant.

Example 5.2 Assume that the TTF has a normal distribution with the mean /xt and standard deviation at. Develop curves for the failure density function, reliability, and failure rate.

Solution For generality, it is easier to work on the standardized scale by which the random time to failure T is transformed according to Z = (T — /xt)/at. In the stan­dardized normal scale, the following table can be constructed easily:

(1)

z

(2) Ф (z)

(3)

Pf (z) = Ф (z)

(4)

Ps(z)

(5)

h(z)

-t?

S’ ^ II

<

—3.5

0.0009

0.0002

0.9998

0.0009

0.0000018

—3.0

0.0044

0.0014

0.9986

0.0044

0.0000088

—2.5

0.0175

0.0062

0.9938

0.0176

0.0000352

—2.0

0.0540

0.0228

0.9772

0.0553

0.0001106

—1.5

0.1295

0.0668

0.9332

0.1388

0.0002776

—1.0

0.2420

0.1587

0.8413

0.2877

0.0005754

—0.5

0.3521

0.3085

0.6915

0.5092

0.0010184

0.0

0.3989

0.5000

0.5000

0.7978

0.0015956

0.5

0.3521

0.6915

0.3085

1.1413

0.0022826

1.0

0.2420

0.8413

0.1587

1.5249

0.0030498

1.5

0.1295

0.9332

0.0668

1.9386

0.0038772

2.0

0.0540

0.9772

0.0228

2.3684

0.0047368

2.5

0.0175

0.9938

0.0062

2.8226

0.0056452

3.0

0.0044

0.9986

0.0014

3.1429

0.0062858

3.5

0.0009

0.9998

0.0002

4.5000

0.0090000

NOTE : at = 500 hours; h(t) has a unit of failures/h, t = t + atz.

Column (2) is simply the ordinate of the standard normal PDF computed by Eq. (2.59). Column (3) for the unreliability is the standard normal CDF, which can be obtained from Table 2.2 or computed by Eq. (2.63). Subtracting the unreliability in column (3) from one yields the reliability in column (4). Then failure rate h(z) in column (5) is obtained by dividing column (2) by column (4) according to Eq. (5.3).

Note that the failure rate of the normal time to failure h(t) = ft(t)/ps(t) is what the problem is after rather than h(z). According to the transformation of variables, the following relationship holds:

ft (t) = Ф (z)dz/dt = ф (z)/at

Since ps(t) = 1 — Ф^), the functional relationship between h(t) and h(z) canbederived as

h(t) = h( z)/fft

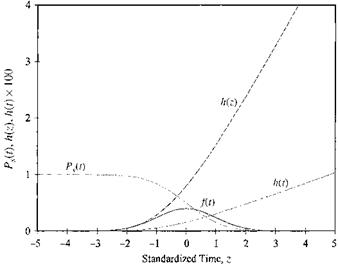
Column (5) of the table for h(t) is obtained by assuming that at = 500 hours. The relationships between the failure density function, reliability, and failure rate for the standardized and the original normal TTF are shown in Fig. 5.7. As can be seen, the failure rate for a normally distributed TTF increases monotonically as the system ages. Kapur and Lamberson (1977) showed that the failure-rate function associated with a normal TTF is a convex function of time. Owing to the monotonically increasing characteristics of the failure rate with time for a normally distributed TTF, it can be used to describe the system behavior during the wear-out period.

Cumulative hazard function and average failure rate

Figure 5.7 Reliability [ps(t)], failure rate [h(t)], failure density func­tion [ ft (t)] for a process/component the TTF of which follows a normal distribution as in Example 5.2.

Failure rate and hazard function

The failure rate is defined as the number of failures occurring per unit time in a time interval (t, t + At ] per unit of the remaining population in operation at

Failure rate and hazard function
TABLE 5.1 Selected Time-to-Failure Probability Distributions and Their Properties

time t. Consider that a system consists of N identical components. The number of failed components in (t, t + At ], NF (At), is

NF ( At) = N x pf (t + At) — N x pf (t) = N [pf (t + At) — pf (t)]

and the remaining number of operational components at time t is

N(t) = N x ps(t)

Then, according to the preceding definition of the failure rate, the instantaneous failure rate h(t) can be obtained as

h(t) = limA<^0

‘Nf (At )/A t

= limA<^0

N x pf (t + At) — N x pf (t)"

[ N (t) J

N(t) x At

= —^lim

ps(t)

"pf (t + At) — pf (t)

At^0 A.

At

1 d [pf (t)]

ps(t) dt

ft (t)

ps(t)

(5.3)

This instantaneous failure rate is also called the hazard function or force-of – mortality function (Pieruschka, 1963). Therefore, the hazard function indicates the change in the failure rate over the operating life of a component. The

Failure rate and hazard function

hazard functions for some commonly used failure density functions are given in Table 5.1. Figures 5.2 through 5.6 show the failure rates with respect to time for various failure density functions.

Подпись: h(t) = limA< Подпись: 0 Failure rate and hazard function Подпись: Pf (t + At) - Pf (t) Ps(t) Подпись: (5.4)

Alternatively, the meaning of the hazard function can be seen from

Подпись: Figure 5.3 Failure rate for Weibull failure density function with to = 0.

in which the term [pf (t + At) – pf (t)]/ps(t) is the conditional failure proba­bility in (t, t + At], given that the system has survived up to time t. Hence the

Failure rate and hazard function

Figure 5.4 Failure rate for Gumbel failure density function.

hazard function can be interpreted as the time rate of change of the condi­tional failure probability for a system given that has survived up to time t. It is important to differentiate the meanings of the two quantities ft (t) dt and h(t) dt, with the former representing the probability that a component would experience failure during the time interval (t, t + dt]—it is unconditional— whereas the latter, h(t) dt, is the probability that a component would fail dur­ing the time interval (t, t + At]—conditional on the fact that the component has been in an operational state up to time instant t.

Failure rate and hazard function

Figure 5.5 Failure rate for two-parameter gamma failure density function.

Failure rate and hazard function

Figure 5.6 Failure rate for uniform failure density function.


Failure Characteristics

Any system will fail eventually; it is just a matter of time. Owing to the presence of many uncertainties that affect the operation of a physical system, the time the system fails to perform its intended function satisfactorily is random.

5.1.1 Failure density function

The probability distribution governing the time occurrence of failure is called the failure density function. This failure density function serves as the common thread in the reliability assessments by TTF analysis. Referring to Fig. 5.1, the reliability of a system or a component within a specified time interval (0, t], can be expressed, assuming that the system is operational initially at t = 0, as

/

TO

ft (t ) dr (5.1a)

in which the TTF is a random variable having ft(t) as the failure density func­tion. The reliability ps (t) represents the probability that the system experiences

Подпись: Figure 5.1 Schematic diagram of reliability and unreliability in the time-to-failure analysis.

no failure within (0, t]. The failure probability, or unreliability, can be ex­pressed as

Pf (t) = P(TTF < t) = 1 – pa(t) = ft(t) dr (5.1b)

0

Подпись: ft (t) Подпись: d [ps (t)] d [pf (t)] dt dt Подпись: (5.2)

Note that unreliability pf (t) is the probability that a component or a system would experience its first failure within the time interval (0, t]. As can be seen from Fig. 5.1, as the age of system t increases, the reliability ps(t) decreases, whereas the unreliability pf (t) increases. Conversely, the failure density func­tion can be obtained from the reliability or unreliability as

The TTF is a continuous, nonnegative random variable by nature. Many contin­uous univariate distribution functions described in Sec. 2.6 are appropriate for modeling the stochastic nature of the TTF. Among them, the exponential distri­bution, Eq. (2.79), perhaps is the most widely used. Besides its mathematical simplicity, the exponential distribution has been found, both phenomenolog­ically and empirically, to describe the TTF distribution adequately for com­ponents, equipment, and systems involving components with a mixture of life distributions. Table 5.1 lists some frequently used failure density functions and their distributional properties.

Time-to-Failure Analysis

5.1 Basic Concept

In preceding chapters, evaluations of reliability were based on analysis of the interaction between loads on the system and the resistance of the system. A system would perform its intended function satisfactorily within a specified time period if its capacity exceeds the load. Instead of considering detailed in­teractions of resistance and load over time, in a time-to-failure (TTF) analysis, a system or its components can be treated as a black box or a lumped-parameter system, and their performances are observed over time. This reduces the relia­bility analysis to a one-dimensional problem involving time as the only variable describable by the TTF of a system or a component of the system. The time – to-failure is an important parameter in reliability analysis, representing the length of time during which a component or system under consideration re­mains operational. The TTF generally is affected by inherent, environmental, and operational factors. The inherent factors involve the strength of the materi­als, manufacturing process, and the quality control. The environmental factors include such things as temperature, humidity, air quality, and others. The operational factors include external load conditions, intensity and frequency of use, and technical capability of users. In a real-life setting, the elements of the factors affecting the TTF of a component are often subject to uncertainty. Therefore, the TTF is a random variable.

In some situations, other physical scale measures, such as distance or length, may be appropriate for system performance evaluation. For example, the reli­ability of an automobile could be evaluated over its traveling distance, or the pipe break probability owing to the internal pressure or external loads from gravity or soil could be evaluated based on the length of the pipe. Therefore, the notion of “time” should be regarded in a more general sense.

TTF analysis is particularly suitable for assessing the reliability of systems and/or components that are repairable. The primary objectives of the reliability analysis techniques described in the preceding chapters were the probability of

Copyright © 2006 by The McGraw-Hill Companies, Inc. Click here for terms of use.

the first failure of a system subject to external loads. In case the system fails, how and when the system is repaired or restored are of little importance. Hence such techniques are often used to evaluate the reliability of nonrepairable systems or the failure probability when systems are subject to extraordinary events. For a system that is repairable after its failure, the time period it would take to have it repaired back to the operational state, called the time-to-repair or restore (TTR), is uncertain.

Several factors affect the value of the TTR and include personal, conditional, and environmental factors (Knezevic, 1993). Personal factors are those repre­sented by the skill, experience, training, physical ability, responsibility, and other similar characteristics of the personnel involved in the repair. The con­ditional factors include the operating environment and the extent of the fail­ure. The environmental factors are humidity, temperature, lighting, noise, time of day, and similar factors affecting the maintenance crew during the repair. Again, owing to the inherently uncertain nature of the many elements, the TTR is a random variable.

For a repairable system or component, its service life can be extended indefi­nitely if repair work can restore the system like new. Intuitively, the probability of a repairable system available for service is greater than that of a nonre­pairable system. Consider two identical systems: One is to be repaired after its failure, and the other is not to be repaired. The difference in probability that a system would be found in operating condition at a given instance would become wider as the age of the two systems increased. This chapter focuses on the characteristics of failure, repair, and availability of repairable systems by TTF analysis.

Gram-Schmid Ortho-normalization

Consider a vector x 1 in an K-dimensional space to be used as one of the basis vectors. It is desirable to find the additional vectors, along with x 1, so that they would form K orthonormal basis vectors for the K-dimensional space. To do that, one can arbitrarily select K – 1 vectors in the K-dimensional space as x 2, x3, …, xK.

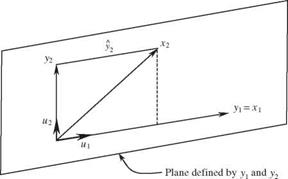
The first basis vector can be obtained as u1 = x 1/|x1|. Referring to Fig. 4D.1, a second basis vector (not necessarily normalized) that will be orthogonal to the first basis vector u1 can be derived as

У 2 = x2 – У2 = x2 – (x2«0«1

Therefore, the second normalized basis vector u2, that is perpendicular to u2 can be determined as u2 = y2/|y2|.

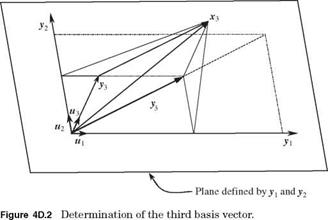
Note that the third basis vector must be orthogonal to the previously deter­mined basis vectors (u1, u2) or (y 1, y 2). Referring to Fig. 4D.2, the projection of x 3 onto the plane defined by y1 and y 2 is

Уз = (x 3u1) u1 + (x 3u2) u2

Gram-Schmid Ortho-normalization

Figure 4D.1 Determination of the second basis vector.

Gram-Schmid Ortho-normalization

Therefore, the third basis vector У3 that is orthogonal to both y1 and y2 can be determined as

Уз = xз – Уз = xз – [(x“1 + (x3^)“2]

and the corresponding normalized basis vector u3 can be determined as u3 = У3/ІУ3І-

Подпись: Ук = xk -
Подпись: ~ k xk №i) i=1 Подпись: for k = 2,3,..., k Подпись: (4D.1)

From the preceding derivation, the kth basis vector yk can be computed as

In the case that x2, x3,…, xK are unit vectors, the basis vectors У2, У3,…, УК obtained by Eq. (4D.1) are orthonormal vectors. It should be noted that the results Gram-Schmid orthogonalization is dependent on the order of vectors x2,x3,…,xK selected in the computation. Therefore, the orthonormal basis from the Gram-Schmid method is not unique.

The preceding Gram-Schmid method has poor numerical properties in that there is a severe loss of orthogonality among the generated yk (Golub and Van Loan, 1989). The modified Gram-Schmid algorithm has the following steps:

1. k = 0.

2. Let k = k + 1 and yk = xk, for k = 1. Normalize vector yk as uk = yk/|yk |.

3. For k + 1 < j < К, compute the vector of xj projected on uk:

У] = (x j uk)uk and the component of xj orthogonal to ui as

У j = xj – yj = xj – (xj – uk) uk

4. Go to step 2 until k = К.

4.1 Refer to Sec. 1.6 for the central safety factor. Assuming that both R and L are independent normal random variables, show that the reliability index в is related to the central safety factor as

MSF – 1

mSf QR + QL

in which Qx represents the coefficient of variation of random variable X.

4.2 Referring to Problem 4.1, the central safety factor can be expressed in terms of reliability index в as

Подпись: MSF1 + в Qr + Q – в2qR QL 1 – e2oR

4.3 Referring to Problem 4.1, how should the equation be modified if the resistance and load are correlated?

4.4

Подпись: SFc Подпись: 1 + zp QR 1 - Zq QL Подпись: MSF

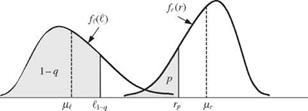
Refer to Sec. 1.6 for the characteristic safety factor. Let Ro be defined on the lower side of resistance distribution as Ro = rp with P(R < rp) = p (see Fig. 4P.1). Similarly, let Lo be defined on the upper side of load distribution with Lo = t1-q. Consider that R and L are independent normal random variables. Show that characteristic safety factor SFc is related to the central safety factor as

in which Zp = Ф 1(p).

4.5 Define the characteristic safety factor as the ratio of the median resistance to the median load as

SF = Г05 = Г

^0.5 t
Gram-Schmid Ortho-normalization
where Г = r0.5 = F_-1(0.5)and t = to.5 = F_-1(0.5), with Fr(■) and Fl(-) being the CDFs of the resistance and load, respectively. Suppose that the resistance R

and load L are independent lognormal random variables. Show that the central safety factor hsf = HR/HL is related to SF as

Подпись: HSF = SF x1 + QR 1 + Q

4.6

Подпись: SFc = HSF x , (Note: For small Qx, ojnx & Qx.) Gram-Schmid Ortho-normalization

Referring to Problem 4.4, show that for independent lognormal resistance and load, the following relation holds:

Подпись: 4.7Let W(X) = X1 + X2 — c, in which X1 and X2 are independent stochastic vari­ables with PDFs, f 1(x1) and f 2(X2), respectively. Show that the reliability can be computed as

/* TO

Подпись: Ps =Подпись: orf 1(X1)[1 — F2(c — X1)]dx1

f 2(X2)[1 — F1(c — X2)]dX2

4.7 Suppose that the load and resistance are independent random variables and that each has an exponential PDF as

fX(x) = XX exp(— Xxx) for X > 0

in which x can be the resistance R and load L. Show that the reliability is

bL HR

Ps = 1—T1— = —г—

Xl + Xr hr + HL

Подпись: 4.9

Подпись: Ps = 1 — Ф ( — — ) — exp OR Подпись: -^(2HRXL —XLOR) Gram-Schmid Ortho-normalization

Show that the reliability for independently normally distributed resistance (with mean hr and standard deviation or ) and exponentially distributed load (with the mean 1/Xl) is

4.10 Suppose that the annual maximum flood in a given river reach has Gumbel dis­tribution [Eq. (2.85a)] with mean hl and coefficient of variation Ql. Let the levee system be designed to have the mean capacity of hR = SFc x It, with SFc being the characteristic safety factor and T-year flow, respectively. For simplic­ity, assume that the levee conveyance capacity has a symmetric PDF, as shown in Fig. 4P.2. Derive the expression for the levee reliability assuming that flood magnitude and levee capacity are independent random variables.

4.11 Numerically solve Problem 4.10 using the following data:

HL = 6000 ft3/s Ql = 0.5 T = 100 years a = 0.15

for SFc = 1.0 and 1.5.

fr (r)

О

ON

0.2

0.2

————- ►

(l – a)Vr Vr (i + a)m

Figure 4P.2

4.12 Consider that load and resistance are independent uniform random variables with PDFs as

Load: fb(0 = 1/(^ – Р ^ < I < ^

Resistance: fR (r) = 1/(r2 — r 1) r 1 < r < Г2

Furthermore, I1 < r 1 < I2 < r2, as shown in Fig. 4P.3. Derive the expression for the failure probability.

4.13 Consider that load and resistance are independent random variables. The load has an extreme type I (max) distribution [Eq. (2.85a)], with the mean 1.0 and standard deviation of 0.3, whereas the resistance has a Weibull distribution [Eq. (2.89)], with mean 1.5 and standard deviation 0.5. Compute the failure prob­ability using appropriate numerical integration technique.

4.14 Consider that the annual maximum flood has an extreme type I (max) distribu­tion with the mean 1000 m3/s and coefficient of 0.3. On the other hand, the levee capacity has a lognormal distribution with a mean of 1500 m3/s and coefficient of variation of 0.2. Assume that flood and levee capacity are two independent random variables. Compute the failure probability that the levee will be over­topped using appropriate numerical integration technique.

4.15 Resolve Example 4.6 taking into account the fact that stochastic variables n and D are correlated with a correlation coefficient —0.75.

fR(r)7

1

1

1

1

1

_______________ 1_____

1

1

1

1

1

fd-O

z

ri Є

€1

4.16 The annual benefit and cost of a small hydropower project are random variables, and each has a Weibull distribution [see Eq. (2.89)] with the following distribu­tional parameter values:

a

$

в

Benefit

4.5422

60,000

266,000

Cost

3.7138

100,000

110,000

(a) Compute the mean and standard deviation of the annual benefit and cost.

(b) Assume that the annual benefit and cost are statistically independent. Find out the probability that the project is economically feasible, i. e., the annual benefit exceeds the annual cost.

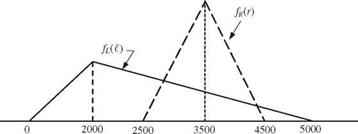
4.17 Suppose that at a given dam site the flood flows and the spillway capacity follow triangular distributions, as shown in Fig. 4P.4. Use the direct integration method to calculate the reliability of the spillway to convey the flood flow (Mays and Tung, 1992).

Подпись: 4.18The Hazen-Williams equation is used commonly to compute the head losses in a water distribution system, and it is written as
Gram-Schmid Ortho-normalization

€ , r


Gram-Schmid Ortho-normalization

Gram-Schmid Ortho-normalization

Figure 4P.5 (After Mays and Tung, 1992).

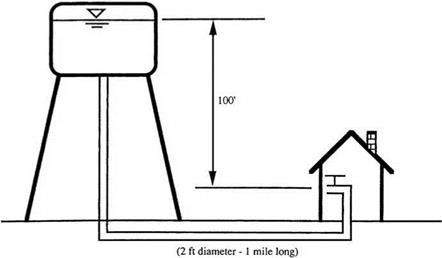
the uncertainty in pipe roughness and pipe diameter, the supply to the user is not certain. We know that the pipe has been installed for about 3 years. Therefore, our estimation of the pipe roughness in the Hazen-Williams equation is about 130 with some error of ±20. Furthermore, knowing the manufacturing tolerance, the 1-ft pipe has an error of ±0.05 ft. Assume that both the pipe diameter and Hazen – Williams’ Chw coefficient have lognormal distributions with means of 1 ft and 130 and standard deviations of 0.05 ft and 20, respectively. Using the MFOSM method, determine the reliability that the demand of the user can be satisfied (Mays and Tung, 1992).

4.19 In the design of storm sewer systems, the rational formula

Ql = CiA

is used frequently, in which Ql is the surface inflow resulting from a rainfall event of intensity i falling on the contributing drainage area of A, and C is the runoff coefficient. On the other hand, Manning’s formula for full pipe flow, that is,

Qc = 0.463n-1 S1/2 D8/3

is used commonly to compute the flow-carrying capacity of storm sewers, in which D is the pipe diameter, n is the Manning’s roughness, and S is pipe slope.

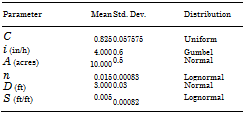
Consider that all the parameters in the rational formula and Manning’s equa­tion are independent random variables with their mean and standard deviation given below. Compute the reliability of a 36-in pipe using the MFOSM method (Mays and Tung, 1992).

In most locations, the point rainfall intensity can be expressed by the following empirical rainfall intensity-duration-frequency (IDF) formula:

Подпись: 4.20Подпись: 4.21

Подпись: Parameter Mean Std. Dev. Distribution C 0.825 0.057575 Uniform i (in/h) 4.000 0.6 Gumbel A (acres) 10.000 0.5 Normal n 0.015 0.00083 Lognormal D (ft) 3.000 0.03 Normal S (ft/ft) 0.005 0.00082 Lognormal

. aTm

i = 1———

b + tc

where i is the rainfall intensity (in in/h or mm/h), t is the storm duration (in minutes), T is the return period (in years), and a, m, b, and c are constants.

At Urbana, Illinois, the data analysis results in the following information about the coefficients in the preceding rainfall IDF equation:

Variable

Mean, і

Coef. ofVar. ^

Distribution

a

120

0.10

Normal

b

27

0.10

Normal

c

1.00

0.05

Normal

m

0.175

0.08

Normal

Assuming independence among the IDF coefficients, analyze the uncertainty of the rainfall intensity for a 10-year, 24-minute storm. Furthermore, incorporate the derived information herein to Problem 4.19 to evaluate the sewer reliability.

The storm duration used in the IDF equation (see Problem 4.20) in general is equal to the time of concentration. One of the most commonly used in the Kirpich (Chow, 1964):

tc = C (^ У

where tc is the time of concentration (in minutes), L is the length of travel (in feet) from the most remote point on the drainage basin along the drainage channel to the basin outlet, S is the slope (in ft/ft) determined by the difference in elevation of the most remote point and that of the outlet divided by L, and c1 and c2 are coefficients.

Assume that c1 and c2 are the only random variables in the Kirpich formula with the following statistical features:

Parameter

Mean

Coeff. ofVar.

Distribution

c1

0.0078

0.3

Normal

c1

0.77

0.2

Normal

(a) Determine the mean and standard deviation of tc for the basin with L = 1080 ft and S = 0.001.

(b) Подпись: 4.22

Gram-Schmid Ortho-normalization

Incorporate the uncertainty feature of tc obtained in (a), and resolve the sewer reliability as Problem 4.20.

(c) Compare the computed reliability with those from Problems 4.19 and 4.20.

Gram-Schmid Ortho-normalization Gram-Schmid Ortho-normalization

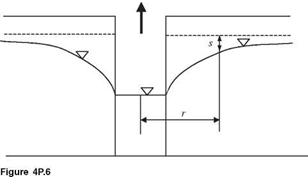
Referring to Fig. 4P.6, the drawdown of a confined aquifer table owing to pumping can be estimated by the well-known Copper-Jacob equation:

in which § is the model correction factor accounting for the error of approximation, s is the drawdown (in meters), S is the storage coefficient, T is the transmissiv­ity (in m2/day), Qp is the pumping rate (in m3/day), and t is the elapse time (in days). Owing to the nonhomogeneity of geologic formation, the storage coef­ficient and transmissivity are in fact random variables. Furthermore, the model correction factor can be treated as a random variable. Given the following in­formation about the stochastic variables in the Copper-Jacob equation, estimate the probability that the total drawdown will exceed 1.5 m under the condition of Qp = 1000 m3/day, r = 200 m, and t = 7 days by the MFOSM method.

Variable

Mean n

Coeff. ofVar.

Distribution

§

1.000

0.10

Normal

T (m2/day)

1000.0

0.15

Lognormal

S

0.0001

0.10

Lognormal

NOTE: p(T, S) = -0.70; p(§, T) = 0.0; p(§, S) = 0.0.

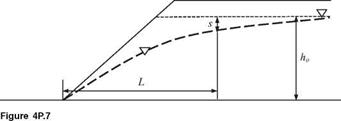
4.23 Referring to Fig. 4P.7, the time required for the original phreatic surface at ho to have a drawdown s at a distance L from the toe of a cut slope can be approximated by (Nguyen and Chowdhury, 1985)

s = 1 – erf =

ho 2 у/Khot /S

where erf(x) is the error function, which is related to the standard normal CDF as erf(x) = 2^/2[Ф(x) — 0.5], K is the conductivity of the aquifer, S is the storage coefficient, and t is the drawdown time. From the slope stability viewpoint, it is

Gram-Schmid Ortho-normalization

required that further excavation can be made safely only when the drawdowns reach at least half the original phreatic head. Therefore, the drawdown time to reach sfho = 0.5 can be determined from the preceding equation as

*=(I)2 Kb

where § = erf 1(0.5) = 0.477.

Consider that K and S are random variables having the following statistical properties:

Variable

Mean і

Std. Dev. a

Distribution

K (m/day)

0.1

0.01

Lognormal

S

0.05

0.005

Lognormal

NOTE: p(K, S) = 0.5.

Estimate the probability by the MFOSM method that the drawdown time td will be less than 40 days under the condition L = 50 m and ho = 30 m.

4.24 The one-dimensional convective contaminant transport in steady flow through porous media can be expressed as (Ogata, 1970):

C(x, t) 1 x — (q/n)t

erfc

Co 2 2 V ai(q/n)t

in which C(x, t) is the concentration at point x and time t, Co is the concentration of the incoming solute, x is the location along a one-dimensional line, q is the specific discharge, n is the porosity, ai is the longitudinal dispersivity, erfc is the complimentary error function, erfc(x) = 1 — erf(x), and t is the time.

Assume that the specific discharge q, longitudinal dispersivity ai, and porosity n are random variables with the following statistical properties:

Variable

Mean і

Std. Dev. a

Distribution

q (m/day)

1.0

0.10

Lognormal

n

0.2

0.02

Normal

ai(m)

10.0

1.00

Lognormal

NOTE: p(n, ai) = 0.75; zero for other pairs.

Estimate P [C(x, t)/Co > 0.5] for x = 525 m and t = 100 days by the MFOSM method.

4.25

Gram-Schmid Ortho-normalization Подпись: Kd L0 , ка—Kd{e Gram-Schmid Ortho-normalization Подпись: + D0e_KaX/U

Referring to the following Streeter-Phelps equation:

consider that the deoxygenation coefficient Kd, the reaeration coefficient Ka, the average stream velocity U, the initial dissolved oxygen DO, deficit concentrations D0, and the initial in-stream BOD concentration L0 are random variables. As­suming a saturated DO concentration of 8.48 mg/L, use the MFOSM method to estimate the probability that the in-stream DO concentration will be less than 4.0 mg/L at x = 10 miles downstream of the waste discharge point by adopting a lognormal distribution for the DO concentration with the following statistical properties for the involved random variables:

Variable

Mean u

Std. Dev. a

Distribution

Kd

0.60 L/day

0.060 L/day

Lognormal

Ka

0.76 L/day

0.076 L/day

Lognormal

U

1.2 ft/sec

0.012 ft/sec

Normal

D0

1.60 mg/L

0.160 mg/L

Normal

L0

6.75 mg/L

0.0675 mg/L

Normal

NOTE: p(Ka, U) = 0.8 and zero for all other pairs.

4.26 Referring to the Steeter-Phelps equation in Problem 4.25, determine the criti­cal location associated with the maximum probability that the DO concentration is less than 4.0 mg/L using the statistical properties of involved random vari­ables given in Problem 4.25. At any trial location, use the MFOSM method, along with the lognormal distribution for the random DO concentration, to compute the probability.

4.27 Develop a computer program for the Hasofer-Lind algorithm that can be used for problems involving correlated nonnormal random variables.

4.28 Develop a computer program for the Ang-Tang algorithm that can be used for problems involving correlated nonnormal random variables.

4.29 Solve Problem 4.18 by the AFOSM method. Also compute the sensitivity of the failure probability with respect to the stochastic variables. Compare the results with those obtained in Problem 4.18.

4.30 Solve Problem 4.21 by the AFOSM method considering all stochastic basic vari­ables involved, and compare the results with those obtained in Problem 4.21.

4.31 Solve Problem 4.22 by the AFOSM method considering all stochastic basic vari­ables involved, and compare the results with those obtained in Problem 4.22.

4.32 Solve Problem 4.23 by the AFOSM method considering all stochastic basic vari­ables involved, and compare the results with those obtained in Problem 4.23.

4.33 Solve Problem 4.24 by the AFOSM method considering all stochastic basic vari­ables involved, and compare the results with those obtained in Problem 4.24.

4.34 Solve Problem 4.25 by the AFOSM method considering all stochastic basic vari­ables involved, and compare the results with those obtained in Problem 4.25.

4.35 Solve Problem 4.26 by the AFOSM method considering all stochastic basic vari­ables involved, and compare the results with those obtained in Problem 4.26.

4.36 Prove that Eq. (4.107) is true.

Подпись: 4.37

Gram-Schmid Ortho-normalization Gram-Schmid Ortho-normalization Подпись: [1 - FR(IT )]

Show that under the condition of independent resistance and load, P1 in Eq. (4.113) can be written as

Подпись: 4.38

Подпись: P2 = Подпись: 0 Подпись: Fb(r) fR (r )dr + Подпись: [1 - FR (IT )]

Show that under the condition of independent resistance and load, P2 in Eq. (4.114) can be written as

4.39 Assume that the annual maximum load and resistance are statistically indepen­dent normal random variables with the following properties:

Variable

Mean

Coefficient of variation

Load

1.0

0.25

Resistance

sF x It =10-yr

0.15

Derive the reliability-safety factor-service life curves based on Eqs. (4.115) and (4.116).

4.40 Repeat Problem 4.39 by assuming that the annual maximum load and resistance are independent lognormal random variables.

4.41 Подпись: References
Resolve Problem 4.39 by assuming that the resistance is a constant, that is, r* = SF x It =10-yr. Compare the reliability-safety factor-service life curves with those obtained in Problem 4.39.

Abramowitz, M., and Stegun, I. A. (eds.) (1972). Handbook of Mathematical Functions with Formulas, Graphs, and Mathematical Tables, 9th ed., Dover Publications, New York.

Orthogonal Transformation Techniques

The orthogonal transformation is an important tool for treating problems with correlated stochastic basic variables. The main objective of the transformation is to map correlated stochastic basic variables from their original space to a new domain in which they become uncorrelated. Hence the analysis is greatly simplified.

Orthogonal Transformation Techniques

Consider K multivariate stochastic basic variables X = (Xі, X2,, XK)t having a mean vector fj, x = (jx1, /г2 …, /гкУ and covariance matrix Cx as


011 012 013 021 °22 023


01K

02K


Cr =


0K1 Ok2 0K3


okk


in which oij = Cov(Xi, Xj), the covariance between stochastic basic variables Xi and Xj. The vector of correlated standardized stochastic basic variables X’ = D-1/2(X – fxx), that is, X’ = (X1, X2,…, XKУ with Xk = (Xk – /xk)/ok, for k = 1,2,…, K, and Dx being an K x K diagonal matrix of variances of stochastic basic variables, that is, D x = diag(o12, o|, …, o^), would have a mean vector of 0 and the covariance matrix equal to the correlation matrix Rx:


Orthogonal Transformation Techniques

Y = T-1X ’ (4C.1)

where Y is a vector with the mean vector 0 and covariance matrix I, a K x K identity matrix. Stochastic variables Y are uncorrelated because the off- diagonal elements of the covariance matrix are all zeros. If the original stochas­tic basic variables X are multivariate normal variables, then Y is a vector of uncorrelated standardized normal variables specifically designated as Z’ be­cause the right-hand side of Eq. (4C.1) is a linear transformation of the normal random vector.

It can be shown that from Eq. (4C.1), the transformation matrix T must satisfy


Rx = TTt


(4C.2)


There are several methods that allow one to determine the transformation matrix in Eq. (4C.2). Owing to the fact that Rx is a symmetric and positive – definite matrix, it can be decomposed into

Rx = LLt (4C.3)

in which L is a K x K lower triangular matrix (Young and Gregory, 1973; Golub and Van Loan, 1989):

l11 0

0

. . . 0 ‘

l21 l22

0

. . . 0

Ik 1 Ik2 Ik3

. . . Ikk _

L

which is unique. Comparing Eqs.(4C.2) and (4C.3), the transformation matrix T is the lower triangular matrix L. An efficient algorithm to obtain such a lower triangular matrix for a symmetric and positive-definite matrix is the Cholesky decomposition (or Cholesky factorization) method (see Appendix 4B).

The orthogonal transformation alternatively can be made using the eigenvalue-eigenvector decomposition or spectral decomposition by which Rx is decomposed as

Rx = Cx = VAVt (4C.4)

where V is a K x K eigenvector matrix consisting of K eigenvectors as V = (v i, v 2,…, vK), with vk being the kth eigenvector of the correlation matrix Rx, and Л = diag(X1, Л2,…, XK) being a diagonal eigenvalues matrix. Frequently, the eigenvectors v’s are normalized such that the norm is equal to unity, that is, vt v = 1. Furthermore, it also should be noted that the eigenvectors are or­thogonal, that is, v t v j = 0, for i = j, and therefore, the eigenvector matrix V obtained from Eq. (4C.4) is an orthogonal matrix satisfying VVt = Vt V = I where I is an identity matrix (Graybill, 1983). The preceding orthogonal trans­form satisfies

Vt Rx V = Л (4C.5)

To achieve the objective of breaking the correlation among the standardized stochastic basic variables X’, the following transformation based on the eigen­vector matrix can be made:

U = VtX’ (4C.6)

The resulting transformed stochastic variables U has the mean and covariance matrix as

E(U) = V tE(X’) = 0 C (U) = VtCx V = Vt RxV = Л


(4C.7a)

(4C.7b)


and


As can be seen, the new vector of stochastic basic variables U obtained by Eq. (4C.6) is uncorrelated because its covariance matrix Cu is a diagonal ma­trix Л. Hence, each new stochastic basic variable Uk has the standard deviation equal to V^k, for all k = 1, 2,…, K.

The vector U can be standardized further as

Y = Л-1/2и (4C.8)

Based on the definitions of the stochastic basic variable vectors X – (vx, Cx), X’ – (0, Rx), U – (0, Л), and Y – (0,1) given earlier, relationships between them can be summarized as the following:

Y = Л-1/2и = Л-1/2 V1X’ (4C.9)

Comparing Eqs.(4C.1) and (4C.9), it is clear that

T-1 = Л-1/2 V1

Applying an inverse operator on both sides of the equality sign, the transfor­mation matrix T alternatively, as opposed to Eq. (4C.3), can be obtained as

T = VЛ1/2 (4C.10)

Using the transformation matrix T as given above, Eq. (4C.1) can be expressed as

X ‘ = TY = VЛ1/2Y (4C.11a)

and the random vector in the original parameter space is

X = vx + D1/2 VЛ1/2Y = vx + D1/2 LY (4C.11b)

Geometrically, the stages involved in orthogonal transformation from the orig­inally correlated parameter space to the standardized uncorrelated parameter space are shown in Fig. 4C.1 for a two-dimensional case.

From Eq. (4C.1), the transformed variables are linear combinations of the standardized original stochastic basic variables. Therefore, if all the original stochastic basic variables X are normally distributed, then the transformed stochastic basic variables, by the reproductive property of the normal random variable described in Sec. 2.6.1, are also independent normal variables. More specifically,

X – N(vx, Cx) X’ – N(0, Rx) U – N(0, Л) and Y = Z – N(0,1)

The advantage of the orthogonal transformation is to transform the correlated stochastic basic variables into uncorrelated ones so that the analysis can be made easier.

Orthogonal Transformation Techniques
The orthogonal transformations described earlier are applied to the stan­dardized parameter space in which the lower triangular matrix and eigenvector matrix of the correlation matrix are computed. In fact, the orthogonal transfor­mation can be applied directly to the variance-covariance matrix Cx. The lower triangular matrix of Cx, L, can be obtained from that of the correlation matrix L by

L = D1/2 L (4C.12)

Following a similar procedure to that described for spectral decomposition, the uncorrelated standardized random vector Y can be obtained as

Y = Л-1/2 Vг (X – цх) = Л-1/2£7 (4C.13)

where V and Л are the eigenvector matrix and diagonal eigenvalue matrix of the covariance matrix Cx satisfying

Cx = УЛ V/1

and U is an uncorrelated vector of the random variables in the eigenspace having a zero mean 0 and covariance matrix Л. Then the original random vector X can be expressed in terms of Y and L:

X = fix + VA1/2Y = fix + L Y (4C.14)

One should be aware that the eigenvectors and eigenvalues associated with the covariance matrix Cx will not be identical to those of the correlation matrix Rx.

Some One-Dimensional Numerical Integration Formulas

Подпись: I = Подпись: b f (x) dx a Подпись: (4A.1)

This appendix summarizes some commonly used numerical formulas for eval­uating the following integral:

Detailed descriptions of these and other numerical integration procedures can be found in any numerical analysis textbook.

4A.1 Trapezoidal rule

For a closed integral, Eq. (4A.1) can be approximated as

1 = hif 1 + 2 Щ fi + (4A.2a)

where h is a constant space increment for discretization, n is the number of discretization points over the interval (a, b), including the two end points, and fi is the function values at discretized point, xi.

For open and semiopen integrals, Eq. (4A.1) can be computed numerically as

1 = h (эf2 + 2£ fi + 3fn-1^ (4A.2b)

4A.2 Simpson’s rule

For closed integrals, one has

h

1 = 3 [ f 1 + 4( f 2 + f 4 + f 6 + ■ ■ •) + 2( f 3 + f 5 + f 7 + •• •) + fn] (4A.3a)

For open and semiopen integrals, one has

Подпись: 1 = 12[27f2 + 13( f 4 + f 6 +•) + 16( f 5 + f 7 + ■ ■ •) + 27f n-1] (4A.3b)

4A.3 Gaussian quadratures

Equation (4A.1) can be expressed as

n

1 = wif (Xi) (4A.4)

i=1

where wi is the weight associated with the ith abscissa xi in the discretiza­tion. The weight wi is related to orthogonal polynomials. Table 4A.1 lists some commonly used orthogonal polynomials and their applied integral range, ab­scissas, and weights. Definitions of those polynomials and tables of abscissas and weights for different Gaussian quadratures are given by Abramowitz and Stegun (1972).

TABLE 4A.1 Some Commonly Used Gaussian Quadratures

Some One-Dimensional Numerical Integration Formulas

Gauss Range (a, b) Abscissas Xf Weight wi

in which lkj and akj are elements in matrices L and A, respectively, and K is the size of the matrices. In terms of akj’s, lkj’s can be expressed as

k-1

Подпись: (4B.4)lkk — I akk ^ ^ lkj

Some One-Dimensional Numerical Integration Formulas Подпись: for k — j + 1,..., K (4B.5)

j—1

Computationally, the values of lkj’s can be obtained by solving Eqs. (4B.4) and (4B.5) sequentially following the order k — 1,2,…, K. Numerical examples can be found in Wilkinson (1965, p. 71). A simple computer program for the Cholesky decomposition is available from Press et al. (1992, p. 90). Note that the requirement of positive definite for matrix A is to ensure that the quantity in the square root of Eq. (4B.4) always will be positive throughout the computation. If A is not a positive-definite matrix, the algorithm will fail.

For a real, symmetric, positive-definite matrix A, the Cholesky decomposition is sometimes expressed as

A — L Л Lt (4B.6)

in which L is a unit lower triangular matrix with all its diagonal elements having values of ones, and Л is a diagonal eigenvalue matrix. Therefore, the eigenvalues associated with matrix A are the square roots of the diagonal el­ements in matrix L. If a matrix is positive-definite, all its eigenvalues will be positive, and vice versa.

In theory, the covariance and correlation matrices in any multivariate prob­lems should be positive-definite. In practice, sample correlation and sample covariance often are used in the analysis. Owing to the sampling errors, the resulting sample correlation matrix may not be positive-definite, and in such cases, the Cholesky decomposition may fail, whereas the spectral decomposition described in Appendix 4C can be applicable.

Time-dependent reliability models for hydrosystems

Considering only inherent hydrologic uncertainty. Traditionally, the risk associ­ated with the natural hydrologic randomness of flow or rainfall is explicitly considered in terms of a return period. By setting the resistance equal to the load with a return period of T years (that is, r* = lT), the annual reliability, without considering the uncertainty associated with lT, is 1 – 1/T, that is,

P (L < r *|r * = tT) = 1 – 1/T. Correspondingly, the reliability that the random loads would not exceed r * = lT in a period of t years can be calculated as (Yen, 1970)

Ps(t, T) = (4.108)

For large T, Eq. (4.108) reduces to

Ps(t, T) = exp( t/T) (4.109)

If T > t, Eq. (4.108) can further be approximated simply as ps(t, T) = 1 -1/T.

Considering both inherent hydrologic uncertainty and hydraulic uncertainty. In the

case where the uncertainty of the resistance is not negligible and is to be con­sidered, the annual reliability of a hydrosystem infrastructure then has to be evaluated through load-resistance interference on an annual basis. That is, the annual reliability will be calculated by evaluating P(L < R) as Eq. (4.1), with f L(t) being the probability distribution function of annual maximum load. Hence the reliability of a hydrosystem over a service period of t years can be cal­culated by replacing the term 1/T in Eqs. (4.108) and (4.109) by 1 – P(L < R). Then the results are

Ps(t, L, R) = [P(L < R)]t (4.110)

Ps(t, L, R) = exp{—t x [1 – P(L < R)]} (4.111)

in which the evaluation of annual reliability P (L < R) can be made through the reliability methods described in preceding sections.

Incorporation of a design event. In the design of hydraulic structures, the com­mon practice is to determine the design capacity based on a preselected design return period tT and safety factor SF. Under such a condition, the magnitude of the future annual maximum hydrologic load can be partitioned into two com­plementary subsets, that is, t < tT and t > tT, with each representing different recurrence intervals of the hydrologic process. The reliability of the hydrosys­tem subject to the ith hydrologic load occurring in the future can be expressed by using the total probability theorem (Sec. 2.2.4) as

Ps, i = P (Li < r)

= P(Li < r |Li > tT) P(Li > tT) + P(Li < r |Li < tT) P (Li < tT)

= P (tT < Li < r) + P (Li < r, Li < tT)

= P1 + P 2 (4.112)

where Pi and P2 can be written explicitly as

Time-dependent reliability models for hydrosystems

Подпись: (4.117)

Time-dependent reliability models for hydrosystems
Подпись: Equation (4.115) is based on the binomial distribution for random occurrence of the loads, whereas Eq. (4.116) is based on the Poisson distribution. When hydraulic uncertainty is negligible, Eqs. (4.115) and (4.116) reduce, respectively, to

r

Подпись: Figure 4.20 Comparison of two generalized time-dependent reliability models under T = 50 years, SF = 1.0, and = 0.1. (After Tung, 1985.)

probability computed by the two models converge as the service life increases. Without considering hydraulic uncertainty [i. e., Cov(Qc) = 0], the failure prob­ability is significantly underestimated. Computationally, the time-dependent model based on the binomial distribution, i. e., Eq. (4.39a), is much simpler than that based on the Poisson distribution.