Humidity/Temperature Testing

Newly constructed buildings generally have higher humidity levels caused by the moisture inherent in building materials and processes. It is important to dry enclosed buildings out quickly to levels that will not support mold growth and to verify that acceptable levels have been reached and are maintained. Hu­midity should be monitored and controlled from the time the building is enclosed un­til all wet-finish materials have been applied and dried. Humidity controls are especially important in humid climates or when mas­sive wet materials such as concrete or plaster are used. Inexpensive meters for determin­ing temperature and relative humidity called thermohygrometers can be purchased at most electronics and hardware stores.

Relative humidity (RH) varies depending on temperature. Warmer air will have a lower RH than colder air with the same amount of water vapor. With a special chart called a psy – chrometric table, a trained consultant can convert readings from the thermohygrome­ter to determine the actual amount of water in the air or at surfaces at various temperatures. These figures are used to determine if a struc­ture is dry enough. At 70 degrees Fahrenheit, mold will not grow at an RH level of under 60 percent measured at the surface. One way to measure the surface humidity is to affix the thermo hydrometer to the surface with a sheet of plastic sealed over it. After a few minutes the meter will stabilize and the RH can be read. If it is determined that humidity levels are too high, we recommend electric dehumidifica­tion. Note that if you can see condensation continuously on the windows for two days in a row, the building probably has areas that are wet enough to support microbial growth.

Certified water-loss technicians are trained and equipped to measure and dry buildings that have excessive levels of moisture. There are two associations that certify technicians and can help you locate qualified people in your vicinity. These are the Restoration In­dustry Association (RIA) and the Institute of Inspection, Cleaning and Restoration Certification (IICRC).

Calcium Chloride Moisture Testing

Large quantities of water are present in ce­ment, gypsum concrete, aircrete, and other poured masonry materials. These materials must be adequately dried before finishes are applied. It is common in new construction for a carpet or other floor finish to be laid on a slab before the slab is thoroughly dry. Further drying is inhibited, allowing microbial spore levels to climb as mold growth invades these damp areas.

Kits for testing moisture in masonry are available (see Chart 13.1). They contain cal­cium chloride salts, which absorb moisture from the air at a known rate. A kit contains a plate that holds the calcium chloride salt, a plastic dome, and an adhesive material. Weigh the calcium chloride to the nearest hundredth of a gram. (You can find scales for weighing the salts at your local pharmacy.) Then place the calcium chloride test plate on the floor area to be tested and cover it with the plas­tic dome, which is sealed to the slab with the adhesive material. After 60 to 72 hours, re­move the plastic dome and reweigh the cal­cium chloride. Based on the weight gain and the number of hours that have passed, you can determine the materials water vapor emis­sions rate. The kit instructions also contain a chart that will help you determine when the slab is dry enough for the application of var­ious finishing materials. If a scale is unavail­able, the sealed exposed kit can be shipped back to the manufacturer for weighing and calculations.

Attaching stringers

Because a stairway is often asked to bear considerable weight, stringers need to be securely attached at top and bot­tom. There are several ways to attach a stringer to an upper landing, deck, or floor system (see the drawing at right). Whichever method you choose, the first step is to measure down on the face of the landing header one riser height (7[9]A in. in this example) and carefully mark a level line across the header where the stringers will land. Think again about finish floors at this point. Remember what will cover the stair treads and the landing, and make adjustments to ensure that every step will be the same once all finish treads and floor coverings are installed.

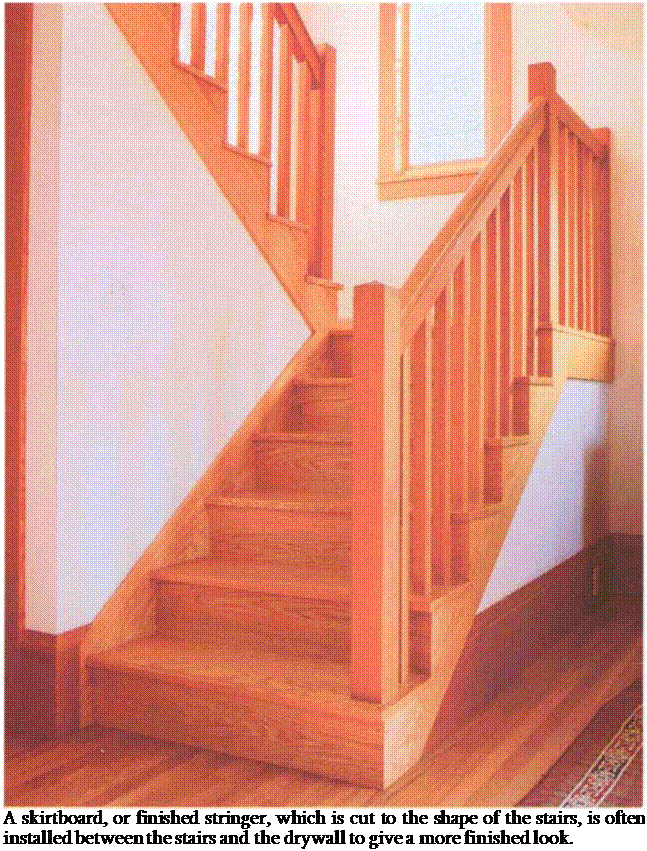
Подпись: A skirtboard, or finished stringer, which is cut to the shape of the stairs, is often installed between the stairs and the drywall to give a more finished look.

nailing in the second and third stringer in the same way. This set of stairs should be strong enough to hold people mov­ing a refrigerator.

Another easy method for securing stringers at the top is with 2×6 or 2×8 metal joist hangers. Just make a horizon­tal cut about 1 Vi in. deep on the back of the stringer to house the bottom of
the hanger. Nail the hanger to the stringer, place the stringer on the line below the landing and nail the hanger into the header.

A third method, using a hangerboard, also works well on exterior stairs because it can be left exposed. Take a piece of 5/s-in. or 3/4-in. plywood (use exterior-grade, pressure-treated plywood
for exterior stairs) and cut it about 1 5 in. wide and as long as the width of the stairs (36 in. normally). Nail the hanger – board to the face of the header joists, flush with the top of the landing. It should hang down no lower than the bottom of the stringer. Then strike a line on the board, down one riser height (71/4 in. for this stair). Hold the stringer to the line and secure it with nails or screws driven in through the back of the hangerboard.

With the stringers secure at the top, cut a 2×4 kicker as wide as the total width of the rough stairway (36 in. in this case) for the bottom of the stairs. Slip it into the notches on the front end of the stringers and fasten it to the floor. Then toenail the stringers to the kicker.

When setting stringers, remember to leave a bit more than Vi in. between the stringer and the wall framing so that drywall can easily slip between the stringers and the wall. Otherwise, some­body has to cut the shape of the stairs in the drywall to fit the stringer.

Skirtboards

Before nailing in the stair parts, a 1x skirtboard is often installed between walls and stringers (see the photo on the facing page). This piece of trim (often a 1×12) protects drywall from being dented by shoe kicks or vacuum cleaners. To cut the skirtboard, first snap a chalkline above the nose of the treads 3 in. or 4 in. and measure its length. Mark a plumb cut on the top of the skirtboard and a level cut at the bottom by using the 774-in. and 10-in. layout on the framing square (just as the top and bot­tom cuts on the stringers were laid out). Of course, be sure to leave enough room between the rough stringers and wall framing to accommodate the thickness of both the drywall and the skirtboard.

Sebastorosa

The layout of the Sebastorosa is basically the same as the Enesti tuned sideways.

Square feet: 743

With add-on: 837 House width: 16’ House length: 30’ Porch: 6’ x 15%

Great Room: 9%’ x 15: Kitchen: ІУ2 x 9’A

Bathroom: 5%’хб’

Half Bath: 41/2’ x 5’

Addition: 7’x12’

Ceiling height: 7’ 6” – sizes are approximate

Bridge in Ptock, Poland

The bridge in Plock, Poland, is a steel, highway and railway, multispan bridge with a significant longitudinal slope. During reconstruction in 1998, a new sprayed pro­tection layer was applied and one layer of 0/16 mm SMA surfacing was laid down. An SBS modified binder—with 50/80 Pen@25°C, SP > 63°C, and ER > 80%—was used. It was an experimental SMA application of 0/16 mm grading on a steel bridge. Its surface integrity, after 2 years in operation, was at least a warning. Large areas of cracks and slight rutting could be seen here and there (Figure 13.2.a). The pavement will have to be reconstructed soon. This rapid pavement failure was probably caused by poor adhesion of the course to the protection layer and high permeability resulting from the use of the coarse 0/16 mm grading.

Combined Drains

Sometimes it is desirable to combine surface water runoff collection and sub-surface seepage water into one, combined, drainage system. Typically, such systems are in the form of lateral trench drains (see Section 13.4.1) that are open to the surface. These are the traditional means of draining roads and continue to be used on lower – trafficked roads where run-off contamination is lower and runoff volumes smaller (because the road is narrower).

Their principal drawbacks are: •

The Highways Agency (2006) publishes a table that indicates when it is sensible to consider a combined system and when not to do so.

Do the prep work for exterior finishes

Exterior siding and trim must be painted on all sides, not just on the surfaces that will be
exposed to the weather. Back-prime the trim before installation. On doors and windows with wood casings, make sure you back-prime all casings before installing the unit.

Take the time to fill all nail holes with exterior-grade wood putty. Don’t caulk under the lap between siding boards. Always use a good-quality, long-lasting, paintable, exterior – grade caulk. Mask and cover any decks or railings to protect them from drips and spills. Cover the foundation or walkways to keep paint from staining the concrete. Take the time to do it right. There is no excuse for being sloppy with paint. Drops of paint on a wood deck or concrete foundation will look bad for years to come.

Подпись:Do the prep work for exterior finishes

Apply exterior paint

Much can be done with exterior paint to give a house a classy style. There is an old house in our neighborhood that has just been repainted lav­ender with light-violet trim. Now, this may not be your choice of colors, but it brightens up our neighborhood in a nice way. I like it better than the Coos Bay gray that makes so many buildings look like army barracks. A good choice of colors can make a home warm and inviting. Some paint dealers have a computer program that shows you what different color combinations will look like on your house. Give your house a virtual paint job to test out various color schemes.

Once you have selected the color, try rolling paint on lap siding with a roller that matches the width of the laps. Once the paint has been rolled on, it must be brushed in to make sure ev­ery crack and crevice is covered properly. Take special care when painting the bottom edges of siding. These edges must be well coated because it is where moisture and ice gather.

Latex paint dries rapidly in hot weather, so don’t roll on too much paint before you go back over it with a brush. Remember, too, that most paints require a wall temperature of at least 50°F or so for good adhesion, so don’t paint if the weather is cooler than that.

Completely paint or stain the siding before you tackle the exterior trim, just as you did on the

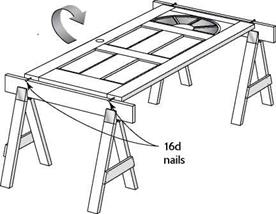
PAINTING DOORS

Drive 16d nails temporarily into the top and bottom of the door. Rest the nails on sawhorses and paint one side of the door, then the other.

interior. Use a good brush and a steady hand to leave a neat-looking job. Doors get a lot of use, so it’s best to give them at least a couple of coats on top of the primer. The metal-clad exterior doors that are often used on affordable houses come with a prime coat. You may want to use a higher – gloss paint on doors because it is easy to clean.

Instead of trying to paint doors in place, take them down and remove all the hardware. Put the hardware for each door in a small plastic bag, label the bag, and store it in a kitchen drawer. Label the door, too. The top edge is a good place to write the door’s location. Drive nails or screws into the top and bottom edges, then set the door across a pair of sawhorses (see the illustration below). After painting one side, flip over the door and paint the other side. Set the door aside, resting it on the nails, while you paint another door. Wait until the first coat is dry, then apply a second coat, brushing out any streaks or drips. When you’re done, remember to put a bit of caulk in the top nail holes so water can’t enter.

Door jambs are also easier to paint when there’s no door in the way. On some exterior en­tries, weatherstripping is installed on the door; on others, it’s installed on the jamb. Either way, it’s usually best to remove weatherstripping be­fore painting instead of trying to paint around it. Getting paint on weatherstripping can pre­vent it from sealing properly. If the weather­stripping is damaged or difficult to reinstall, just buy new material. It is generally inexpensive and is important for sealing the interior of the house from the elements.

Once you are finished painting, use a small piece of cardboard to scrape all unused paint into one can. Save some paint for later touch-up work. A contractor I know takes leftover cans of latex paint, stirs them together, and uses the mixture as back-primer for the next job. Some cities have a site where you can drop off paint for recycling. Otherwise, take unused paints, stains, and solvents to a hazardous-waste facility. Give the earth a break. Don’t dump toxic mate­rials on the ground or down the sink.

Do the prep work for exterior finishes

LEARNING FROM YOUR FELLOW VOLUNTEERS

When volunteers show up to build a Habitat house, they often find themselves assigned to jobs they’ve never done before. Still, with the proper training and supervision, they’re almost always capable of rising to the challenge and making a significant and meaningful contribution to providing another family a decent home. And sometimes in the pro­cess stereotypes are broken and we learn from one another.

On the second day of a six-day blitz in 1993, during which we built 20 houses, I was roofing with Bunny Church and her friend, Stuart Phillips.

It was a hot, steamy day, and we had just half a day to start and finish shingling a roof, so we set to the task energetically and with great focus.

After a couple of hours of hard labor up on that roof, the temperature rising all the while we were working, we were tired, dirty, and thirsty. Suddenly, Stuart stopped our roofing production line, sighing, “I’m sorry, but I just have to put on some lipstick. Lipstick always makes me feel better."

She excused herself, climbed down the ladder to the ground, pulled her lipstick out of her pocket, then went to the Porta Potti. A moment later, Stuart emerged, still dirty and dusty, but also smiling and

radiant, her lips perfectly covered with pink lip­stick. It did help!

Despite being something of a tomboy, I appreci­ated the lesson Stuart had unintentionally taught me—that it’s okay to assert your femininity on the job. And that’s one of the wonderful things about Habitat—everyone is welcome. How many roofers wear lipstick? If your heart is open, the diversity you encounter while working on a Habitat house just might enrich your life. And remember: Lipstick can make you feel better! —Anna G. Carter

llllllllllllllllllllllllllllllllllllllllllllllllllllllllllllllllllllllllllllllllllllllllllllllllllllllllllllllllllllllllllllllllllllllllllllllllllllllllllllllllllllllllllllllllllllllllllllllllllllllllllllllllllllllllllllllllllllllllllllllllllllllllllllllllllllllllllllllll

Do the prep work for exterior finishes

ROOF JACKS AND VENTS

Most skylights are manufactured with a complete flashing package and instructions for installation in a rough opening in the roof framing. Some are available with a kit to adapt the flashing to unusual roofing materials or pitches. Skylights are available in fixed or operable types with screens and/or sun-shade devices. Rough-opening sizes are specified and usually correspond with standard rafter spacing.

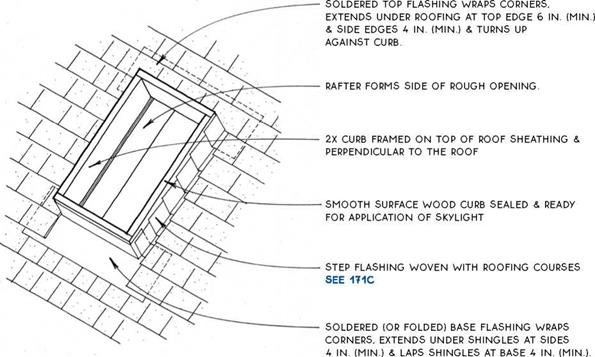
Many fixed skylights require a flashed curb to which the manufactured skylight is attached. With these sky­lights, the curb must be flashed like any other large penetration of the roofing surface, such as a dormer or a chimney (see 174 and 175C). Site-built curbless sky­lights are fixed and appear flush with the roof (see 176). Some codes prohibit these skylights because of the requirement for a curb.

For skylight framing, see 136A & B.

SKYLIGHT FLASHING

Notes

ROOF JACKS AND VENTS

SKYLIGHT CURB FLASHING

For Use with Manufactured Skylight

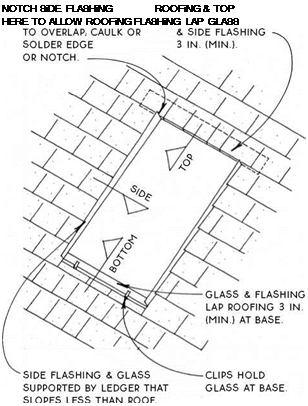
Подпись: NOTCH SiDE FLASHiNG ROOFiNG & TOP HERE TO ALLOW ROOFiNG FLASHiNG LAP GLASS
ROOF JACKS AND VENTS

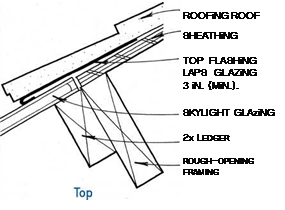
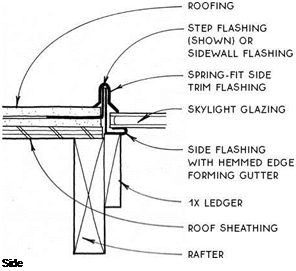
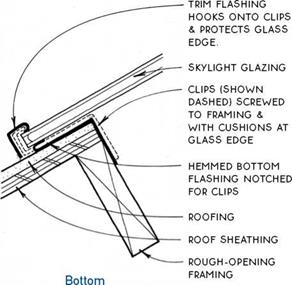
A site-built curbless skylight is woven in with the roofing. Its bottom edge laps the roofing, and its top edge is lapped by roofing. This means that the skylight itself must be at a slightly lower pitch than the roof. Ledgers at the sides of the rough opening provide the support at this lower pitch. If built properly, there is no need for any caulking of these skylights except at the notch at the top of the side flashing. Insulated glass should limit condensation on the glazing, but any con­densation that does form can weep out through the clip notches in the bottom flashing. In extremely cold climates, the side flashing should be thermally isolated from the other flashing to prevent condensation on the flashing itself.

Подпись: Side ROOF JACKS AND VENTSCurbless skylights are especially practical at the eave edge of a roof, where the lower edge of the skylight does not have to lap the roofing. This condition, often found in attached greenhouses, will simplify the details on this page because the slope of the skylight can be the same as the roof. The top and side details above right are suitable in such a case. Codes that require curbs preclude the use of these skylights.
@ CURBLESS SKYLIGHT

With the exception of wood roofs, which are now made with lower-grade material than in the past, today’s roofing materials will last longer than ever before, and can be installed with less labor. Composite materials now take the place of most natural roofing materials, including wood shingle and slate.

The selection of a roofing material must be care­fully coordinated with the design and construction of the roof itself. Some factors to consider are the type of roof sheathing (see 162-166), insulation (see 197-205), and flashing (see 167-176). For example, some roofing materials perform best on open sheathing, but others require solid sheathing. Some roofing materials may be applied over rigid insulation; others may not.

Many roofing materials require a waterproof under – layment to be installed over solid sheathing before roofing is applied. Underlayment, usually 15-lb. felt, which can be applied quickly, is often used to keep the building dry until the permanent roofing is applied.

In the case of wood shakes, the underlayment layer is woven in with the roofing courses and is called interlay – ment (see 186).

Other considerations for selecting a roofing material include cost, durability, fire resistance, local climatic conditions, and the slope (pitch) of the roof.

Cost—Considering both labor and materials, the least expensive roofing is roll roofing (see 180-181). Next in the order of expense are asphalt shingles (see 182-183), followed by preformed metal (see 190), wood shingles (see 184-185), shakes (see 186-187A), and tile (see 187B-189). Extremely expensive roofs such as slate and standing-seam metal are not discussed in depth in this book.

Durability—As would be expected, the materials that cost the most also last the longest. Concrete-tile roofs typically have a 50-year warranty. Shake and shingle roofs can last as long under proper conditions but are never put under warranty. Preformed metal and asphalt shingles are usually under a warranty in the 15-year to 30-year range.

Fire resistance—Tile and metal are the most resis­tant to fire, but fiberglass-based asphalt shingles and roll roofing can also be rated in the highest class for fire resistance. Wood shakes and shingles can be chemically treated to resist fire, but are not as resistant as other types of roofing.

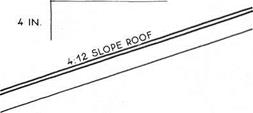
Slope—The slope of a roof is measured as a propor­tion of rise to run of the roof. A 4-in-12 roof slope, for example, rises 4 in. for every 12 in. of run.

There are wide variations among roofing manu­facturers, but in general, the slope of a roof can be matched to the type of roofing. Flat roofs (У8-т-12 to!/4-in-12) are roofed with a built-up coating or with a single ply membrane (see 178-179). Shallow – slope roofs (1-in-12 to 4-in-12) are often roofed with roll roofing. Special measures may be taken to allow asphalt shingles on a 2-in-12 slope and wood shingles or shakes on a 3-in-12 slope, and some metal roofs may be applied to 1-in-12 slopes. Normal-slope roofs (4-in – 12 to 12-in-12) are the slopes required for most roofing materials. Some materials such as built-up roofing are designed for lower slopes and may not be applied to normal slopes.

12 iN.

ROOF JACKS AND VENTS


ROOFING

Introduction


ROOF JACKS AND VENTS

Flat roofs aren’t actually flat, but must slope to drain water or manufacturers will not guarantee their products. The actual slope depends on the application, but most manufac­turers recommend 14 in. per ft. The slope may be achieved with the framing of the roof (see 139) or with tapered insula­tion. Water is usually contained at the edges of a flat roof with a curb or a wall and directed to a central drain (see 179B) or scupper at the edge of the roof (see 57D). A continuous gutter at the edge of a flat roof can also collect the water.

The selection of an appropriate roofing system for a flat roof can be complicated. As with all roofs, climate is one factor. But the fact that a flat roof is covered with a large continuous waterproof membrane presents some special technical problems, such as expansion and contraction. If the roof is going to be used for a terrace or walkway, the effects of foot traffic must also be considered (see 56 and 57). For these reasons, a flat roof is best selected by a design profes­sional and constructed by a reputable roofing contractor.

There are several application methods for flat roofs:

Built-up roof—A built-up roof is composed of several layers of asphalt-impregnated felt interspersed with coats of hot tar (bitumen) and capped with gravel. This traditional and effective method is in widespread use. The applica­tion is technical and should be performed by professional roofers. Warranties range from one to five years.


WOODEN CURB WiTH CANT (SLOPE) TO PREVENT RiGHT ANGLES iN ROOFiNG MATERiAL

METAL Flashing cONTiNuOuS OVER

curb and with drip

AT WALL SIDE


ROOFiNG Material cONTiNuOuS OVER TOp OF cuRB

ROOF SHEATHING

SHEATHING & WALL FINISH

RAFTER


NOTE

this curb is generally used in conjunction WiTH A scupper WHEN THE ROOF SLOpES TOWARD THE OuTSiDE EDGE OF THE BuiLDING. FOR ScuppER, SEE 57D.


Kjj-Stiffness Method—A Unified Method for Both Metallic and Polymeric Reinforced Soil Walls

Allen and Bathurst (2001) developed a new methodology for estimating reinforcement loads in both steel and geosynthetic reinforced soil walls known as the K0-Stiffness Method. Figure 8.44a and b, for polymeric and metal reinforcements, respectively, are provided for estimating the reinforcement load distribution with respect to the magnitude of maximum reinforcement tension from the top to the bottom of the wall. The soil reinforcement load distribution factor (D, max) in these two figures was determined empirically from all of the available field wall case histories. There were empirical databases consisting of measured reinforcement strains and loads from nine full-scale field geosynthetic wall cases (13 different wall sections and surcharge conditions, and 58 individual data points) and 19 full-scale field steel reinforced soil wall cases

FIGURE 8.44 Distribution of maximum tension force in a reinforcement layer Tmax with normalized depth below top of wall. (a) For geosynthetic-reinforced soil walls; (b) for steel-reinforced soil walls. (From Research Report WA-RD 528.1, Washington State Department of Transportation, Olympia, Wash., with permission)

(24 different wall sections and surcharge conditions, and 102 individual data points). The resulting factor is shown in Fig. 8.44a for geosynthetic-reinforced soil walls and in Fig. 8.44b for steel-reinforced soil walls. This factor, D, , is the ratio of the

‘max

maximum tension force Tmax in a reinforcement layer to the maximum reinforcement loads in the wall, T (the maximum value of T within the wall). The two parts of Fig. 8.44 provide the distributions of load, but the magnitude of Tmax is evaluated by the equations of the ^-Stiffness Method in Art. 8.5.13. Empirical reinforcement load distributions provided in Fig. 8.44a and b apply only to walls constructed on a firm soil foundation. The distributions that would result for a rock or soft-soil foundation may differ from those shown. The two parts of the figure demonstrate the differences in reinforcement load distributions between geosynthetic – and steel-reinforced soil walls. The long recognized fact of nontriangular load distribution is clarified, espe­cially for the geosynthetic-reinforced soil wall. Though two different drawings have been used to determine the reinforcement load distribution, this new method provides an improved load estimation for both steel – and geosynthetic-reinforced soil walls and a unified approach.

This new method was developed empirically through analyses of many full-scale wall case histories. In most cases, reinforcement loads had to be estimated from measured reinforcement strain converted to load through a properly estimated reinforcement modulus. For metal-reinforced soil walls, the use of Young’s modulus to convert strain to stress and load is relatively straightforward. However, to accurately determine the
reinforcement loads for geosynthetic-reinforced soil walls, the correct modulus, con­sidering time and temperature effects, had to be estimated accurately. The creep modulus generated from long-term laboratory creep data through regular product analysis was considered accurate enough for estimating reinforcement loads from measured strains.

Once the correct load levels in the reinforcement layers were established, the rein­forcement loads obtained from the full-scale walls were compared to what would be predicted with the new method and the current methodologies found in design guidelines and design codes, including the simplified coherent gravity approach in article 5.8.4.1 of AASHTO. All existing design methodologies were found to provide inaccurate load predictions, especially for geosynthetic-reinforced walls. Considering all available case histories, Allen and Bathurst (2001) reported that the average and coefficient of varia­tion (COV) of the ratio of the predicted to measured Tmax, the peak reinforcement load in each layer, for the simplified method were as follows: 2.9 and 85.9 percent, respectively, for geosynthetic walls, and 0.9 and 50.6 percent, respectively, for steel-reinforced soil walls. The average and COV of the ratio for the K0-Stiffness Method were as follows: 1.12 and 40.8 percent, respectively, for geosynthetic walls, and 1.12 and 35.1 percent, respectively, for steel-reinforced soil walls. This indicates a marked improvement and shows that the calculated loads can be estimated more closely with the D, factors

‘max

and the K0-Stiffness Method.

In the determination of the magnitude of Tmax in the wall, the stiffness of all wall components (facing type, facing batter, reinforcement stiffness, and spacing) relative to soil stiffness is evaluated. By the nature of extensibility of soil reinforcement, the rein­forcement load distributions (D, max) are differentiated by two unique figures. From working load to ultimate load up to incipient soil failure, this methodology covers the full range of strain and load predictions. The method is workable to estimate reinforce­ment responses for both the serviceability and strength limit state. It also includes the estimate of wall deformation from reinforcement strain prediction, load, and resistance factors that account for the uncertainty in the method and material properties.

High-Energy Design: Creating a Well-Lit Room with Four Types of Lighting

TASK LiGHTiNG: BOTH LEDs AND FLUORESCENTS Are up TO The Job

Task lighting is the lighting by which you do work, including undercabinet lighting in a kitchen, closet lighting, and reading lamps. The optimum task light provides shadow – free light and is located between your head and the worksurface.

Depending on the type of fixtures being used, both fluorescents and LEDs can provide effective task lighting. Fluorescent puck lights, such as those by Tresco Interna­tional (www. trescointernational. com), offer shadow-free illumination along worksurfaces such as kitchen counters. Because much of today’s architecture is open plan (where one room flows into the other), choose a light with a color temperature of 2,700 K so that the color is complementary to light sources in other rooms.

For task lighting in closets and laundry rooms, consider using 5,000 K lamps from LEDs or CFLs for excellent color matching. Although some people dislike the lag time associated with CFLs, I like to use them in closets. In fact, I don’t need a sudden punch of light in the morning. I also appreciate the color rendering—very important when matching clothes—that’s possible with a combination of CFLs and LEDs.

Those energy-eating xenon and halogen festoon lamps used in undercabinet task lights and shelf lights come in LED versions; those offered by companies such as Phan­tom Lighting (www. phantomlighting. com)

Closet coordinated.

High-Energy Design: Creating a Well-Lit Room with Four Types of Lightinga strip of 5,000 K LED festoon lights above the clothing shows their true colors under daylight conditions (top) com­pared to incandescent lighting (bottom).

High-Energy Design: Creating a Well-Lit Room with Four Types of Lighting
High-Energy Design: Creating a Well-Lit Room with Four Types of LightingПодпись: The right accent. Here, this niche is illuminated with a single LED MR16 housed inside a square-trimmed recessed low-voltage fixture from lucifer lighting. The absence of UV light will help to preserve the integrity of the photograph.

are dimmable. Other options for undercabi­net task lights include LED puck lights from Lucifer Lighting (www. luciferlighting. com) and LED strip lights by Edge Lighting (www. edgelighting. com).

One caution when using LEDs as task lights: because they are point sources of il­lumination, they tend to create multiple shadows, which can be distracting. Hiding LED sources behind a diffusion material eliminates this problem.

ACCENT LiGHTiNG:

THE SPOTLiGHT GOES TO LEDs

Accent lighting is used to highlight specific objects, adding depth and dimension to an environment. Recessed adjustable fixtures, track lights, portable uplights, and directional landscape lights all fall into this category. Accent lighting can be very dramatic, but when overused can make the objects you own appear more important than friends

and family. This unfortunate result is often referred to as the "museum effect."

LEDs work well as accent lighting for several reasons: They provide directional light, they produce no UV (ultraviolet) rays that can harm fine artwork or textiles, and, unlike incandescents, the color temperature doesn’t alter when they are dimmed. Fluo­rescent light sources are usually too broad in their beam spreads to be effective as accent lights. An exception to this rule would be the illumination of a wall mural or a large hanging tapestry. In these cases, I recom­mend adding a UV-filter to the light fixture to reduce possible degradation of the art.

DECORATiVE LiGHTiNG:

CCFLs SHOW OFF JUST ENOUGH

Decorative lighting also could be called ar­chitectural bling. Its purpose is simple: to look pretty and to add visual sparkle to a space. Chandeliers and candlestick-type wall

Just enough light.

High-Energy Design: Creating a Well-Lit Room with Four Types of LightingBecause they can be obtained in flame – tip styles and lower wattages than typical cFLs, ccFLs are often more suitable (and less overpowering) in decorative fixtures with multiple bulbs, such as this breakfast – room chandelier.

sconces fall into this category. Decorative lighting should not be relied on to provide primary light for a room. If it’s too bright, it can be overpowering. These fixtures were originally designed around incandescent light sources, particularly those of a low – enough wattage so as not to be overpower­ing. The best replacement, then, among the newer light sources would be CCFLs, because they can have a color temperature similar to that of a dimmed incandescent lamp. I particularly like the MicroBrite™ A19 by LiteTronics, which has a very warm color temperature of 2,250 K and, being a CCFL, dims down a full 90%. LEDs would have to be the worst choice for decorative lighting because they do not provide an even, overall glow.

AMBIENT LiGHTiNG:

FLUORESCENTS HAVE A SLIGHT EDGE

Ambient lighting is the gentle light that fills the volume of an interior with a warm glow. Because it is indirect light, it not only
provides overall illumination, but it also softens the shadows on people’s faces, help­ing them to look more relaxed and youth­ful. I refer to it as architectural Botox. The best ambient light comes from illumination that is bounced off the ceiling. Opaque wall sconces, torchieres, pendant-hung indirect fixtures, and cove lighting can be used to create ambient light (see "Green—and Unseen," below). Translucent fixtures can sometimes serve double-duty as both ambient and decorative light. Both LEDs and fluorescents can provide excellent ambient light.

Design Example of MSE Retaining Wall with Steel Reinforcement

The following design example is provided with the permission of the Reinforced Earth Company. Typical calculations are shown, including the determination of allowable
reinforcement tension for galvanized steel reinforcing strips. Figure 8.40 shows a cut­away view of a typical Reinforced Earth retaining wall. Refer to Fig. 8.41 for illustration of calculation steps.

Geometry

Height of wall H = 20 ft

Strip length B = 20 ft (AASHTO minimum = 0.7H = 14 ft) Soil Properties

ф

Cohesion, c

Unit weight, у

R. E. material

34.00°

0.125 kip/ft3

Random fill

25.00°

0.100 kip/ft2

0.120 kip/ft3

Foundation

25.00°

0.300 kip/ft2

Other Properties

• Equivalent fill height for traffic surcharge of 0.25 kip/ft2 =

0.25 kip/ft2 0.120 kip/ft3

• Maximum value of apparent coefficient of friction (bond) = 1.50.

• Coefficient of friction at foundation level (sliding) = 0.47.

• Surface area of one “A” panel = 24.2 ft2.

• Maximum reinforcement tension = 7.20 kips per strip.

• Stress at connection = 100 percent of maximum tie tension.

General Calculations. Random fill is used outside the zone filled with R. E.

(Reinforced Earth) material.

Pressure Coefficient for Random Fill. For the case of level ground at the top of the wall, a vertical backface, and neglecting the effect of wall friction, the pressure coefficient for the fill is given by

Ka = tan2(45° – ф)

Substituting ф = 25° gives

/ 25°

Ka = tan2l 45°———- —) = 0.4059

To allow for the effects of cohesion in the fill (see Fig. 8.41b), define an equivalent pressure K such that

eq

yHK = yHK – 2cVk

eq a a

Thus

, / 2c VK

ф = 21 45° – arctan / K _ —————————- –

eq a 7H

_ 2 X 0,10kip/ft2 X VO.4059
0.12kip/ft3 X 20 1t

= 28.58°

The calculation of the equivalent pressure coefficient follows as Keq = tan2^45° _ —— j = 0.3528

This coefficient is subsequently used to calculate F1, the horizontal force on the wall caused by the surcharge, and F2, the horizontal force on the wall caused by the fill.

Vertical Loads and Resisting Moment. The vertical loads to be considered are the weight of the reinforced fill, V1, and of the surcharge, Vsurch. These loads are calculated and multiplied by their horizontal moment arm from the base (point A in Fig. 8.41b), and the results are summed to determine the resisting moment M. The sum of the vertical loads is designated Rv.

Load, kips/ft

Moment arm, ft

Resisting moment Mr, kips • ft/ft

V1 = 0.125 kip/ft3 X 20 ft X 20 ft = 50.0 kips/ft

10 ft

500 kips • ft/ft

V h = 0.25 kip/ft2 X 20 ft = 5.0 kips/ft

10 ft

50 kips • ft/ft

R = V, + V h = 50 + 5 = 55 kips/ft

v 1 surch

Total Mr = 550 kips • ft/ft

Horizontal Forces and Overturning Moment. The horizontal force due to the sur­charge, F1, and that due to the random fill, F2, are illustrated in Fig. 8.41b. They are calculated using the value of Keq determined previously and multiplied by their vertical moment arm from the base, and the results are summed to determine the overturning moment M.

o

Load, kips/ft

Moment arm, ft

Overturning moment Mo, kips • ft/ft

F1 = 0.3528 X 0.250 kip/ft2 X

10 ft

17.64 kips • ft/ft

20 ft = 1.764 kips/ft

F2 = 0.3528 X 0.120 kip/ft3 X

20 ft/3 = 6.67 ft

56.44 kips • ft/ft

(20 ft)2 X (K) = 8.47 kips/ft

F1 + F2 = 10.23 kips/ft

Mo = 74.08 kips • ft/ft

Eccentricity e ((without Surcharge). The eccentricity without surcharge must be calculated to make sure it is less than one-sixth of the base dimension B, which is the length of the reinforcing strip.

e=

B

M – M

ro

2—

500 – 74.08

2

V1

2

55

B

2—

= 3.33 ft

OK

6

6

e <

1.4816 ft

Safety Factors. The safety factor against overturning is the ratio of the resisting moment to the overturning moment. The safety factor against sliding is the ratio of the horizontal resisting forces (weight of reinforced fill times friction factor plus foundation cohesion force) to the horizontal active forces. These safety factors must be calculated to make sure they are within limits.

M 500

SF (overturning) = —- =——————– = 6.75 > 2.0 OK

Mo 74.08

V1 tan 25° + c X B
F—

334.75

Safety factor for overturning = ———————– = 20 > 2.0 OK

e

2

—————– 0.482 It

33.475

81^

VI

<0

= 3.33 ft

OK

a

V

33.475 kip

B – 2e

20 ft – 2 X 0.482 ft

20

334.75 – 16.15

= 1.759 kips/ft2

The pressure coefficient K is assumed to vary linearly between K0 (the coefficient of earth pressure at rest) at the top of the wall and Ka (the coefficient of active earth pressure) at a depth of 20 ft. Below a 20-ft depth, K = Ka. The distance below the top of the wall is d.

Maximum horizontal pressure a = Ka

K„ = 1 – sin 34° = 0.4408

0.4408 – 0.2827

= 0.4408 —————- 20————— X 11.39 ft

K = 0.3508

ah = 0.3508 X 1.759 kips/ft2 = 0.617 kip/ft2

The area of a standard “A” panel is 24 ft2. Use four strips per panel.

Reinforcing strip tension = 0,617 X 24 = 3.73 kips per strip

4

3.73 kips/strip < 7.2 maximum tension for 75-yr design life OK

(See subsequent calculations for maximum tension allowable for strip and connections.) Check length of strip:

V = 0.125 kip/ft2 X 11.39 ft X 20 ft = 28.475 kips (without surcharge)

Resisting moment = 28.475 kips X 10 ft = 284.75 kips • ft/ft Overturning moment SMo = 16.15 kips • ft

e=

20

284.75 – 16.15

2

28.475

20/6 =

3.33 ft

OK

e <

0.567 ft

V

ah = 0.3508 X 1.509 kips/ft2 = 0.5295 kip/ft2 T = tension on an “A” panel = ah X A = 0.5295 kip/ft2 X 24.2 ft2

= 12.81 kips

R = frictional resistance of reinforcing strips = 2b X leff X H X 8 X f* X N

2 X 197

where 2b = ———- ——– = 0.328 ft = width of top and bottom surface of one strip

H = 11.39 ft = overburden leff = 14.834 ft = effective strip length *8 = 0.125 kip/ft3

f* = 1.5 – [(1.5 – tan 34° X 11.39 ft)/20 ft] = 1.03 = coefficient of apparent friction N = 4 = number of strips per panel

R = 0.328 ft X 14.834 ft X 11.39 X 0.125 kip/ft3 X 1.03 X 4 = 28.54 kips

Effective length safety factor = — = 28,54 = 2.23 > 1.5 OK 6 3 T 12.81

Design Summary at Intermediate Levels

Level, ft

Maximum

horizontal

stress,

Stress at

facing,

kips/ft2

Straps

per

panel

Reinforcing

strip

tension, kips

Horizontal stress (bond), kips/ft2

Effective length safety factor

Strip

length,

ft

2.00

0.21

0.21

4

1.29

0.11

2.52

20.00

4.01

0.31

0.31

3

2.50

0.21

1.84

20.00

6.47

0.42

0.42

3

3.39

0.32

1.76

20.00

8.93

0.52

0.52

3

4.21

0.43

1.67

20.00

11.39

0.62

0.62

4

3.73

0.53

2.23

20.00

13.85

0.70

0.70

4

4.26

0.62

2.28

20.00

16.31

0.79

0.79

4

4.76

0.71

2.29

20.00

18.77

0.86

0.86

4

5.22

0.79

2.25

20.00

Calculation of Allowable Reinforcement Tension. The following calculations show the determination of the allowable reinforcement tension for galvanized reinforcing strips in permanent mechanically stabilized earth structures. Allowable stresses in strips and components are based on the AASHTO Bridge Specifications. The allowable rein­forcement tension is based on maintaining allowable hardware stresses to the end of a 75-year service life. After 75 years, the structure will continue to perform with reinforce­ment stresses that may or may not exceed allowable levels, depending on the soil environment and the applied reinforcement loads. The calculations are based on the following mechanical properties of the reinforcement components.

• Reinforcing strips

50- X 4-mm ribbed (1.97- X 0.16-in)

ASTM A572 grade 65

Fu = 80 kips/in2 ( minimum tensile strength)

Fy = 65 kips/in2 (minimum yield point)

• Tie strips

50- X 3.0-mm (1.97- X 0.12-in)

ASTM A570 grade 50 Fu = 65 kips/in2 Fy = 50 kips/in2

• Bolts

/2-in-diameter X 1/4 inch long ASTM A325

To begin, consider the tie strips at a section where there are no bolt holes (Section A-A, Fig. 8.42). There are two 50- X 3-mm tie strip plates with 2 oz/ft2 (86 ^m) of zinc. Calculate the life of the zinc coating (see Art. 8.5.7):

T = 2 yr + 86 fun – 2yr(15 ixm/yr) = 16 yr 4 ^m/yr

No carbon steel is lost until after depletion of the zinc.

Next, calculate the carbon steel loss in the subsequent 59 years. (See Art. 8.5.7.) The thickness of the carbon steel loss on one side is determined as follows:

Дє = 59 yr X 12 ^m/yr = 708 ^m on each exposed side

The outside surfaces of the tie strip plates are in contact with soil; the inside surfaces are not in contact with soil. Therefore, use one-half the carbon steel loss rate for the inside surfaces. The sacrificial thickness of reinforcement during service life is deter­mined from:

ES = 708 ^m + 354 ^m = 1062 ^m per plate

The thickness of the reinforcement at end of service life is the nominal thickness minus the sacrificial thickness:

EC = En — ES = 3000 ^m — 1062 ^m = 1938 ^m per plate

50 x 4 mm A-572 Gr. 65 reinforcing strip (galvanized)

Section @ – @: gross section of tie strip Section © – ©: net section of tie strip and reinforcing strip at bolt

Section © – ©: gross section of reinforcing strip

FIGURE 8.42 Structural connection of reinforcing strip to facing panel. (From the Reinforced Earth Co., with permission)

The cross-sectional area at end of service life is found from:

The allowable tensile stress is found from:

FT = 0.55Fy = 0.55(50 kips/in2) = 27 kips/in2

The allowable tension on reinforcement is:

Tal = FTAS = 27 kips/in2 X 0.300 in2 = 8.10 kips per connection

Now, consider the tie strips at a section through the bolt holes (Section B-B, Fig. 8.42). There are two 50- X 3-mm tie strip plates with 2 oz/ft2 (86 [m) of zinc. The diameter of each bolt hole is %s in (14.3 mm). The life of the zinc is 16 years, as found in the calculation for Section A-A.

Calculate the thickness of carbon steel loss over the subsequent 59 years:

Дє = 708 [m per exposed side

(See the preceding calculation for Section A-A.) Corrosion does not occur on the inside surfaces of the plates, because of protection provided by sandwiching the reinforcing strip. Thus,

ES = 708 ^m per plate

Proceed with calculations for thickness at end of service life, cross-sectional area, allowable tensile stress, and allowable tension force:

Now, consider the reinforcing strip at a section through the bolt holes (Section B-B, Fig. 8.42). The reinforcing strip is 50 X 4 mm with 2 oz/ft2 (86 ^m) of zinc. The diam­eter of each bolt hole is %s in (14.3 mm). No carbon steel is lost from reinforcing strip surfaces at the net section, because of the sandwiching protection by the tie strip. Thus,

Es = 0

EC = E = 4000 ^m or 4 mm

50 mm — 14.3 mm

(25.4 mm/in)2 FT = 0.50Fu = 0.50(80 kips/in2) = 40 kips/in2 T, = FTAS = 40 kips/in2 X 0.221 in2 = 8.84 kips per connection

The shear strength of each bolt is found as follows. Each bolt is /2 in X 1/4 in, ASTM A325, galvanized. It is assumed that no carbon steel is lost from the bolt shank, because of sandwiching protection by the strips. The bolt head, nut, and washer have more than adequate metal for loss to corrosion.

The allowable shear stress on the bolt (with threads excluded from the shear plane) is

FV = 1.4 X 19 kips/in2 = 27 kips/in2 allowable

The nominal cross-sectional area of the /2-in-diameter bolt is 0.196 in2. The allowable force on each bolt, considering two shear planes, is

Tal = FVAS = 27 kips/in2 X 0.196 in2 X 2 = 10.60 kips per connection

A check shows that bearing strength does not control for this case.

Next, consider the reinforcing strip at a section where there are no bolt holes (Section C-C, Fig. 8.42). The reinforcing strip is 50 X 4 mm, with 2 oz/ft2 (86 ^m) of zinc. The life of the zinc is 16 years, from previous calculations.

Calculate the thickness of carbon steel loss over the subsequent 59 years.

Де = 708 ^m per exposed side (see previous calculations) ES = 2 sides X 708 ^m/side = 1416 ^m

Design Summary for Allowable Reinforcement Tension

Component

Section

Allowable force, kips

Tie strip

Main

8.10

Tie strip

Through bolt holes

8.13

Reinforcing strip

Main

7.20

Reinforcing strip

Through bolt holes

8.84

Bolt

Shear planes

10.60

The least value controls the design. In this case, the allowable reinforcement tension (7.20 kips) is governed by the strength of the reinforcing strip at a section where there are no bolt holes.

8.5.10 Material Properties of Polymeric Reinforcement

The tensile properties of polymeric reinforcement are subject to creep under load because properties of the materials are both time- and temperature-dependent. Also, the materials are subject to damage during the construction process and are affected by durability con­siderations such as aging. Furthermore, characteristics of geosynthetic products made from the same base polymer exhibit the normal variation of most manufactured products.

The allowable long-term reinforcement strength (tension capacity) based on limit state criteria is

Values of RFid, RFcr, and RFD must be determined from the results of prescribed product specific tests, and RFID and RFD should be no less than 1.1 each. Alternatively, in lieu of product-specific tests, a default reduction factor RF for certain geosynthetic products that meet AASHTO minimum requirements may be used. The default reduc­tion factor for “applications not having severe consequences should poor perfor­mance or failure occur” is 4.0 for permanent applications and 2.5 for certain temporary applications.

The allowable connection strength (T’ac) between the wall facing and the reinforcement on a load per unit reinforcement width basis is

where RFc = RFcr X RFd (as defined previously); product-specific long-term degra­dation data at the environment shall be considered CRa = reduction factor to account for reduced ultimate strength resulting from the connection

CRS = reduction factor to account for reduced strength due to connection pullout

FS = 1.5 (minimum) overall factor of safety as defined previously

ASTM designation D4595, “Standard Test Method for Tensile Properties of Geotextiles by the Wide-Width Strip Method,” serves as a quality control test from which a “minimum average roll value (MARV)” is determined and certified by the manufacturer to the user of the product. The MARV value is a measure of the ultimate tensile strength of the polymeric material under the stated test conditions.

As noted, the manufacturing process is subject to variation. The minimum value the manufacturer certifies must therefore meet or exceed the design minimum value. The man­ufacturer must also be able to meet this minimum value at a specific confidence level. The ASTM and the industry have adopted a 95 percent confidence level. A normal distribution of the test results is assumed.

ASTM Designation D4595. Test method ASTM 4595, which is prescribed by AASHTO, covers the measurement of tensile properties of geotextiles using a wide – width strip specimen. The test is also applied to geogrids. A relatively wide specimen is gripped across its entire width in the clamps of a constant-rate-of-extension (CRE) type tensile testing machine operated at a prescribed rate of extension, applying a longi­tudinal force to the specimen until the specimen ruptures. The distinctive feature of this test is that the width of the specimen is greater than the length, and this tends to minimize the contraction (neck-down) effect that is present with other test methods for measuring strip tensile properties of geotextiles. It is believed that the test will provide a closer relationship to expected geotextile behavior in the field. Tensile strength, elongation, initial and secant modulus, and breaking toughness of the test specimen can be calculated from the results.

The determination of the wide-width strip force-elongation properties of geotex­tiles provides design parameters for reinforcement applications such as reinforced MSE walls. D4595 may be used for acceptance testing of commercial shipments of geotextiles, although an individual owner may specify other acceptance criteria.

This test method is generally used by manufacturers, but when it is not, it should be required by owners in order to provide supporting data for the manufacturer’s stated MARV. To the end user, MARV is a minimum value that exceeds design requirements.

To account for testing variation, the manufacturer is required to take a sufficient num­ber of specimens per fabric swatch that the user may expect, at the 95 percent proba­bility level, that the test result will not be more than 5.0 percent of the average above or below the true average of the swatch for both the machine and the cross-machine direction.

The number of tests required to establish a MARV depends upon whether a reliable estimate of the coefficient of variation v of individual observation exists, in the laboratories of either the manufacturer or the end user. Specifically, when there is a reliable estimate of v based upon extensive past records for similar materials tested as directed in the method, the required number of specimens is calculated using the equation:

where n = number of specimens (rounded upward to a whole number)

v = reliable estimate of coefficient of variation of individual observations on similar materials in user’s laboratory under conditions of single-operator precision, %

t = value of Student’s t for one-sided limits (see Table 8.6), a 95% probability level, and degrees of freedom associated with the estimate of v A = 5.0 percent of average, the value of allowable variation

When there is no reliable estimate of v for the manufacturer’s or user’s laboratory, the equation should not be used directly. Instead, specify the fixed number of six specimens each for the machine direction and the cross-machine direction tests. The number of spec­imens is calculated using v = 7.4 percent of the average. This value for v is somewhat larger than usually found in practice. When a reliable estimate of v for the user’s labora­tory becomes available, the above equation will usually require fewer than the fixed number of specimens.

D4595 specifically includes formulas for determining the initial tensile modulus and the offset tensile modulus. Additionally, the formula for breaking toughness is included. The appendix to the designation contains graphical representations for the determination of the modulus values.

TABLE 8.6 Values of Student’s t for One-Sided Limits and 95% Probability

df

One-sided

df

One-sided

df

One-sided

1

6.314

11

1.796

22

1.717

2

2.920

12

1.782

24

1.711

3

2.353

13

1.771

26

1.706

4

2.132

14

1.761

28

1.701

5

2.015

15

1.753

30

1.697

6

1.943

16

1.746

40

1.684

7

1.895

17

1.740

50

1.676

8

1.860

18

1.734

60

1.671

9

1.833

19

1.729

120

1.658

10

1.812

20

1.725

1.645

df = degrees of freedom = number of samples — 1. Source: From Geotextiles magazine, with permission.

8.5.11 Design Example of MSE Retaining Wall with Geogrid Reinforcement

The following design example (provided courtesy of Tensar Earth Technologies) illus­trates an application of AASHTO specifications and the tieback wedge method of analysis.

Step 1: Qualify Design Assumptions. Review plans, specifications, and available infor­mation to confirm feasibility, to determine if the information is adequate to continue with design, and to ascertain that the wall layout is clearly understood.

Step 2: Define Parameters for Soil, Reinforcement, Geometry, and Loading. On the

basis of the information provided, clearly state the design parameters and factors of safety that will be used for design. Provide a diagram for the geometry of the wall that will be designed indicating slopes above and below the wall, any surcharge loadings and their locations, magnitude and direction of application, and hydrostatic and seismic loading conditions.

For this example, refer to Fig. 8.43 for geometry. Design parameters are as follows: 1. Soil

Zone

Ф’, °

c

y, lb/ft3

Reinforced fill

34

0

120

Retained fill

30

0

120

Foundation

30

0

120

Allowable foundation bearing stress is 6000 lb/ft2.

2. Groundwater: none

3. Surcharge: 250 lb/ft2 uniform

4. Seismic loading: none

Step 3: Calculate External Stability. First calculate the coefficient of active earth pres­sure, Ka. The slope angle p is zero above the wall because the slope levels before reaching the end of the reinforcement. Had the slope extended beyond the tail of the reinforcement, a trial wedge solution or infinite slope calculation would be required, depending on the distance of the slope extension.

For the following calculation, refer to Art. 8.2.3 for equation and nomenclature:

For ф’ = 30°, p = 0, 0 = 93.6° (face has 3.6° batter), S = 0: Ka = 0.31.

Minimum embedment length L ~ 0.7H = 0.7(29) = 20.3 ft. Use 20 ft.

Sum moments and forces about the toe of the wall and solve for external safety factors (SF) as follows:

Item, Fig. 8.43

Force, lb

Moment arm, ft

Moment, ft • lb

W1

69,600

10.91

759,336

W2

3,750

14.15

53,075

W3

2,099

20.07

42,127

W4

875

20.07

17,661

Pa

21,502

11.33

243,613

Pq

2,635

17.00

44,795

Rv = W + W2 + W3 = 76,325 lb Rh = Pa + Pq = 24,137 lb

Resisting moment = M1 + M2 + M3 = 854,538 ft • lb Overturning moment = 243,613 + 44,795 = 288,408 ft • lb SF overturning = 854,538/288,408 = 2.96 > 2 .0 OK SF sliding = RCt tan 30°/Rh = 76,325 X 0.5774/24,137 = 1.82 > 1.5 ‘ OK

The safety factor for sliding should be calculated in at least two locations: at the inter­face of the foundation and the reinforced fill, and at the lowest geogrid. In this case, C,, the coefficient of interaction between the geogrid and the reinforced fill, is 1.0 according to test data supplied by the geogrid manufacturer. Because the reinforced fill is stronger than the foundation soils, the lowest safety factor for sliding is at the foundation interface.

Next check bearing. The eccentricity of the vertical reaction is

The maximum bearing stress is then

All external safety factors are satisfied. Next, calculate internal safety factors for geogrid tension, pullout at face, and pullout past the Rankine failure plane.

No.

Height, ft

Depth, ft

Wv lb

W2. lb

Wv lb

W4.lb

P, lb/ft2

a

P, lb/ft2

tl

a,, lb/ft2

v, A2

T, lb/ft

Grid, UX-

13

26.67

2.33

6,692

3750

2099

875

999

568

492

3.99

509

1500

12

23.35

5.65

13,560

3750

2099

875

2,108

826

895

3.34

774

1500

11

20.00

9.00

21,600

3750

2099

875

3,643

1084

1326

3.34

1148

1500

10

16.67

12.33

29,592

3750

2099

875

5,582

1342

1782

3.00

1387

1600

9

14.00

15.00

36,000

3750

2099

875

7,434

1549

2175

2.67

1504

1600

8

11.34

17.66

42,384

3750

2099

875

9,543

1755

2598

2.33

1570

1600

7

9.34

19.66

47,184

3750

2099

875

11,302

1910

2940

2.00

1525

1600

6

7.34

21.66

51,984

3750

2099

875

13,210

2065

3309

1.67

1433

1600

5

6.00

23.00

55,200

3750

2099

875

14,571

2168

3573

1.34

1237

1600

4

4.67

24.33

58,392

3750

2099

875

15,988

2271

3851

1.33

1328

1600

3

3.34

25.66

61,584

3750

2099

875

17,471

2374

4146

1.34

1436

1600

2

2.00

27.00

64,800

3750

2099

875

19,032

2478

4463

1.34

1545

1600

1

0.67

28.33

67,992

3750

2099

875

20,647

2581

4801

1.34

1662

1600

0

29.00

69,600

3750

2099

875

21,502

2635

4989

732

TABLE 8.7 Calculations for Tension in Geogrid Reinforcement of MSE Retaining Wall

Step 4: Calculate Internal Stability. The calculation of Ka for this check is similar to the external calculation, except that the slope angle above the wall (if any) is always assumed to be zero. Thus, Ka = 0.31 in this example. The additional forces contributed by the sloping surface are accounted for in the summation of forces and moments in determining bearing stress. Calculation of internal stability and tension in reinforcements is similar to the preceding calculations. At each level of reinforcement, the vertical stress m is calculated on the basis of the resultant of the forces and moments of both the reinforced fill and the external forces. This stress is then multiplied by Ka and the vertical tributary area vi to calculate the tension in the reinforcement. If the calculated tension T exceeds the allowable tension Tal, either a stronger reinforcement or a reduced vertical spacing must be adopted.

The allowable design stress for the geogrids is determined from AASHTO criteria, considering both ultimate strength and serviceability. Both the geogrid and the connec­tion of the grid to the face must be considered. In this case the following allowable ten­sion values have been determined for two geogrids:

Geogrid UX1500: Tal = 1267 lb/ft

Geogrid UX1600: Tal = 1731 lb/ft

The calculations for tension in Table 8.7 can now be made; the last column indicates the reinforcement selected.

Check pullout in the top geogrid layer. Geogrids must extend beyond the failure plane (45° — ф/2) by at least 3 ft.

Le = 20 — [26.67 tan (45° — ^ + 26.67 tan (3.6°)]

= 7.50 ft > 3.0 OK

Calculate pullout resistance by friction (two grid sides) based on weight acting beyond the failure plane:

Minimum pullout capacity = 2[7.5 ft X 2.33 ft X 120 lb/ft3 + W3]C tan ф = 2(2097 + 2099)1.00 tan 34°

= 5660 lb/ft

FS = 5660/508 = 11.1 > 2.0 OK