The ancestral principles of use of the Nile

An irrigation technique that is natural for the regimes of the Nile develops in the

IIIrd millennium BC. The flood regime of the Nile is quite regular in time, from June to October, but is obviously of quite irregular magnitude. The earliest agriculture consist­ed quite simply in planting seeds in the moist soil fertilized by silty flood deposits. But a flood of small magnitude inevitably precedes a year of famine:

“I was in mourning on my throne, Those of the palace were in grief… .because Hapy had failed to come in time. In a period of seven years, Grain was scant, Kernels were dried up…Every man robbed his twin…Children cried…The hearts of the old were needy…Temples were shut, Shrines covered with dust, Everyone was in distress..”

“My heart was greatly troubled for the Nile did not come soon enough during seven years. Grain was scarce, the grain was dried out, everything to eat was in very meager quantity, all were frustrated by the revenue.”

Although the Egyptians were never able to eliminate the effect of variable flooding on agriculture, they were nevertheless able to increase the amount of productive land through irrigation. Initially, the technique was to exploit natural basins on either side of the river. Water is stored in them long enough for the deposition of sediment (one or two months), and then drained to the Nile or to another lower basin, leaving the soil ready for cultivation. This practice was then extended to the development of artificial reten­tion basins, and this required the construction of dikes and canals of increasing capaci­ty. The shaduf (balance beam) appears during the IInd millennium BC; in a tomb of the Ramses period there is a depiction of an entire battery of shadufs.

The austere Greco-Roman Strabo, who visited Egypt about 25 BC at the beginning of the Roman domination, was not easily impressed, yet he wrote of the Egyptians: “Their practices concerning the river (The Nile) are so excellent that because of their diligence nature was conquered. For by natural order, one land will provide more yield than another, and more so if it has been flooded; and the greater the flood, the greater the extent of flood­ed lands. But often when nature falters, diligent activity can, even when the floods are weak,

з

cause as much land to be flooded as during large floods, this by means of canals and dikes”.

Figure 3.1 provides an overview of the major sites of hydraulic engineering works in ancient Egypt and Nubia.

THE COST OF CONGESTION

Congestion, when applied to traffic, refers to that condition which occurs when drivers experience a noticeable delay in completing a trip because of inability to maneuver through the traffic stream. This condition is characterized by slow travel speeds, increased travel times, increased accident frequencies, erratic stop-and-go driving, increased vehicle operating costs, and other undesirable circumstances leading to driver dissatisfaction (Ref. 4).

Congestion on urban freeways is of two types—recurring and nonrecurring. Congestion that occurs regularly at particular locations during certain time periods is said to be recurring. On the other hand, congestion that occurs as a result of irregular events, such as accidents, disabled vehicles, or other similar happenings, is said to be nonrecurring. Both can cause driver dissatisfaction, but drivers usually expect the recurring congestion and make adjustments in their travel plans to accommodate it. The most common example of recurring congestion is the morning and afternoon “rush hour” periods, when traffic demands can exceed the capacity of the freeway.

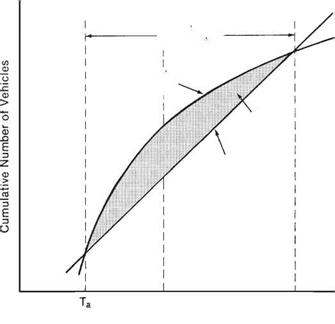
Figure 2.60 shows a graph illustrating what happens when demand exceeds capacity. The straight line represents the capacity of a section of freeway at a particular time (i. e., the number of vehicles getting past the point under prevailing roadway conditions). As long as traffic demand, or the number of vehicles arriving at that point (shown by the curved cumulative demand line), is less than or equal to the capacity of that section of the freeway, there is little congestion. However, once the arrival rate begins to exceed the capacity at time Ta, a bottleneck is formed and vehicles begin to accumulate upstream until time Tb, when the demand once again falls below the capacity. Congested conditions continue until time Tc, when the accumulated traffic at the bottleneck dissipates. The area between the capacity and demand curves during congested conditions is the delay result­ing from the congestion (Ref. 4).

THE COST OF CONGESTIONDuration of

Congestion

Cumulative

Demand

Delay

Capacity

Ть Tc

Time

FIGURE 2.60 Illustration of relationships among demand, capacity, and congestion. (From Traffic Engineering Handbook, Institute of Transportation Engineers, 1992)

The cost of congestion is the sum of individual costs of items that represent an increase over normal operating costs directly attributable to the congestion. Among these items are fuel and oil consumption, tire wear caused by the frequency and severity of speed changes, other maintenance items affected by the speed changes, and increased idling times. There are other costs that may not be readily apparent to the individual driver but are real costs affecting the general public, such as inefficient movement of commercial vehicles and the increased level of pollutant emissions.

Where congestion on freeways is of the recurring kind, the usual solutions to try and solve the problem are geometric in nature. The most logical solution in many cases is lane addition. In urban areas, congestion frequently occurs downstream from entrance ramps when the combination of traffic entering the freeway and the traffic already present exceeds the capacity of that segment. In other cases, the existing horizontal alignment may contain one or more “sharp” curves, which result in lower capacity. Ramp designs may have a detrimental effect on freeway capacity if their merge or diverge areas are too short, or if they are too closely spaced, creating weaving problems for traffic entering and exiting the freeway traffic stream. Other problems involving physical features include unconventional interchanges, inadequate shoulders, narrow medians, poor surface quality, and poor signing.

The next article discusses a new approach to the problem that takes advantage of evolving technology: intelligent vehicle highway systems.

Permeability Testing

The permeability of soils is a material parameter that relates the rate of water flow to the hydraulic gradient in the soil and, therefore, determines the material’s suitabil­ity for drainage layers. An embankment usually consists of compacted materials. The compaction often results in anisotropy such that the vertical and the horizontal permeability properties are not equal. For road construction layers, water move­ments below the ground water table are almost entirely horizontal and thus it is the horizontal permeability that should be measured. Above the groundwater table in the unsaturated zone the movement of water is much more complex, involving vertical as well as horizontal components depending on material parameters such as temperature, water content and matric suction.

Some typical values of the coefficient of permeability for saturated soils are shown in Table 3.1.

The permeability of soils can either be estimated in saturated conditions or for par­tially saturated conditions. If the permeability of soils is estimated from saturated

Soil

Coefficient of perm. K (m/s)

Degree of permeability

Gravel

> 10-3

Very high

Sandy gravel, clean sand, fine sand

10-3 > K > 10-5

High to medium

Sand, dirty sand, silty sand

10-5 > K > 10-7

Low

Silt, silty clay

10-7 > K > 10-9

Very low

Clay

< 10-9

Virtually impermeable

Table 3.1 Typical values of the coefficient of permeability of saturated soils

samples and the unsaturated permeability is sought, the Soil Water Characteristic Curve (SWCC – see Chapter 2) can be used to predict the permeability for a speci­fied volumetric water content (Fredlund & Rahardjo, 1993).

Part i: Coarse Aggregate Content

Designing the coarse aggregate part of an SMA mix differs widely from designing an asphalt concrete (AC) mix. The unexpected difference lies in the various results of similar actions. Let us consider the example of SMA gradation curves.

It should be kept in mind that SMA has a strong aggregate skeleton with little to none of the medium aggregate fraction. Different distributions of sizes within the coarse aggregate fraction can lead to greater or smaller discontinuities in the overall gradation in a course, which can lead to some pretty interesting consequences for the mixture.

Example i

MIXTURE S

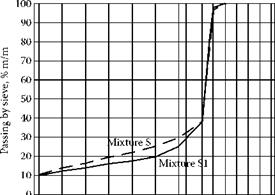
Thus let us take the gradation limits of SMA 0/12.8 mm and insert a gradation curve between them, marking that design as S (Figure 6.2). Grading parameters of the mixture S are shown in Table 6.5.

MIXTURE S1

Let us perform the operation of adding coarse aggregates to the mixture. Now, more coarse graded grains have been added as can best be seen on 2.0- and 4.0-mm sieves. This creates mixture S1 (Figure 6.2). The gradation characteristics of a new mixture S1 may also be found in Table 6.5. The gradation curve for mix­ture S1 has been moved downward in the area of sieves larger than 2 mm relative to mixture S.

image44"0

10

20

30

40

50

60

70

80

90

100

Sieve, # mm

FIGURE 6.2 Grading curves of S (the dotted line) and S1 (the solid line) mixes – SMA of Example I.

TABLE 6.5

Grading Characteristics of Mixtures S and S1

Gradation properties

mixture s

mixture s1

Filler fraction content (grains <0.063 mm), % (m/m)

10.5

10.1

Sand fraction content (grains 0.063-2.0 mm), % (m/m)

14.4

9.8

Coarse aggregate content (grains >2.0 mm), % (m/m)

75.5

80.1

Coarse aggregate content (grains >4.0 mm), % (m/m)

70.0

74.3

Specific surface area of the mixture, cm2/g

189

170

Подпись: FIGURE 6.3 SMA mixtures with increasingly higher contents of the coarse aggregate fraction. Part i: Coarse Aggregate Content

Conclusions of the Example I SMA mixture

Conclusions drawn from the analysis of Example I include the following:

• The increase in coarse grains in a mix brings about the lowering of curves in the area of sieves larger than 2 mm. There then follows an increase in par­ticles retained on the 2-mm sieve; all in all, SMA gradation curves behave the same way as those of AC.

• The main difference in gradation between mixtures S and S1 is that the sand fraction (0.063/2.0 mm) of mixture S1 is less by about 5% than that of mixture S, and this percentage of material is moved to fraction 2.0/8 mm of S1 mixture.

• It is easy to observe that the amount of coarse aggregates of fraction 8/11.2 mm is almost the same in mixtures S and S1; this means that the main changes occurred between sieves 0.063 and 8 mm.

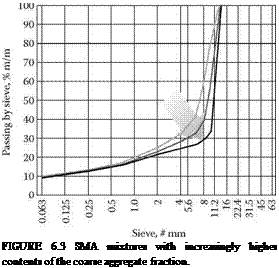
• There are more coarse aggregates in mixture S1, hence the quantity of coarse aggregates carries with it an increase in the air voids in the aggre­gate mix and an increase in the quantity of binder needed in the SMA. Meanwhile, let us look at Figure 6.3, which shows numerous gradings of SMA mixtures. Each of them contains more and more coarse particles, and the gradation curves move in the direction of the arrow. Naturally, the con­sequences of such movements are more and more spacious voids among coarse particles.

Other Methods

A number of other methods exist for estimating soil water content such as nuclear magnetic resonance (NMR), which can detect nuclear species that have a magnetic moment or spin. As hydrogen has a nuclear spin of 1/2 the NMR technique can be used to estimate water content in soils. This is a fast and non-destructive method with high accuracy in uniform samples. However the method is costly, not suitable for field use and highly dependent upon sample calibration and is therefore not used in soil studies or in applications related to roads (Veenstra et al., 2005).

Near infrared reflectance spectroscopy (NIRS), seismic methods and thermal properties are all methods that can be used for estimation of soil water content. Although they are in many respects good and accurate methods, they all have some drawbacks making them non-suitable as routine methods to be used in the pavement environment. In the first two methods the calibration process is complex or difficult to perform due to the influence of other factors, and assessing the thermal properties of the soil is costly and needs a long measurement time relative to other methods (Veenstra et al., 2005).

Historical Points of Reference

The earliest Egyptian cultures evolve essentially in parallel with those of Mesopotamia, lagging only slightly. However in contrast to the agitated history of the Syro – Mesopotamian universe, the historical evolution in Egypt is relatively linear. The polit­ical unification of the twin lands (upper Egypt and the delta) occurs about 3100 BC, and clearly is the logical outcome of a common culture. This cultural and political union of the south and the north is a cherished aspiration of the Egyptians, and persists across the centuries despite several troubled periods. One of these periods is the separation of the ancient and middle Empires from 2180 to 2040 BC, and another is from 1730 to 1560 BC, a prelude to the establishment of the new Empire.

The middle and new Empires were marked by a commercial and military expansion to the south, up the Nile, and also toward the northeast. Egypt succeeded several times in extending its domination into Palestine, and even to the upper course of the Euphrates, under Thoutmosis III and Ramses II in the 15th and 13th centuries BC.

Around 1200 BC Egypt resists the land and river invasion of Sea People, but is weakened by the effort. Always capable of rising to new challenges, Egypt succeeds, for the most part, in preserving its unity. The Assyrian Ashurbanipal temporarily conquers Egypt about 660 BC; but the Assyrians are expulsed with the rebirth of the Saite Dynasty. The Persian Cambyse conquers Egypt in 525 BC, a date which marks the end of pharaonic Egypt and its integration into Achaemenid Persian Empire. In 331 BC, Egypt falls under the control of Alexander the Great, then of the heirs of Ptolemy, Alexander’s general.

INSTALLING SHINGLES

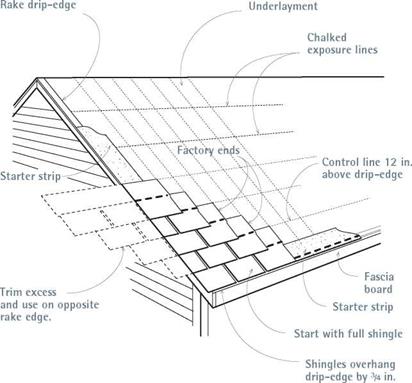
After attaching drip-edge flashing to the eaves and rolling out underlayment over the drip-edge, install the starter course along the eaves. You’ll cover the starter course with the first course of shingles. Running starter courses along the rakes isn’t imperative, but it’s smart because starters stiffen the overhanging shingle edges and create a cleaner line.

The starter course. First determine how much the starter course will overhang the drip-edge:

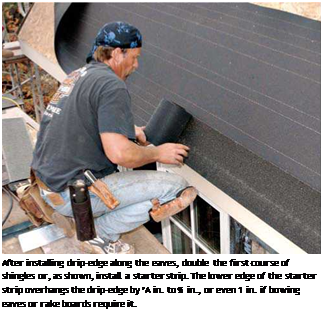
I in. to Va in. overhang is typical, but some roofers allow as much as 1 in. if eaves or rake boards are badly bowed. The starter course will be 7 in. high. Extend your tape measure past the drip – edge the amount of the overhang, and make crayon marks on the underlayment at 7 in. and at 12 in. Do this at both ends of the roof and snap chalklines through both sets of marks. The 7-in. line indicates the top of the starter course; the 12-in. line indicates the top of the first course of shingles.

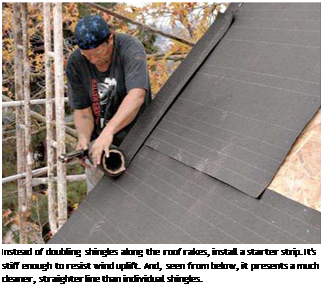
Подпись: After installing drip-edge along the eaves, double the first course of shingles or, as shown, install a starter strip. The lower edge of the starter strip overhangs the drip-edge by ’A in. to % in., or even 1 in. if bowing eaves or rake boards require it. Подпись: Instead of doubling shingles along the roof rakes, install a starter strip. It's stiff enough to resist wind uplift. And, seen from below, it presents a much cleaner, straighter line than individual shingles. Starter courses can be three-tab shingles with the bottom 5 in. cut off or a starter strip that comes on rolls in various widths. Starter strips have the advantage of stiffening shingles above and, viewed from below, providing a clean, unbroken line. Still, trimming three-tab shingles is cheaper, so here’s a quick look at that method.

First, use three-tab shingles as a starter course, rather than laminated shingles, which cost more and don’t lie flat. Traditionally, the starter course was just a full shingle turned upside down so its tabs faced up, but that placed the shingle’s self-seal strip too high to do much good. Far better to measure down 7 in. from the top of the shingle, trim off the bottom 5 in., and snap off the shingle tabs.

Secure the starter course by aligning the shingles’ top edges to the 7-in. control line and nailing them down, four nails per shingle. If you’re installing a starter strip, align its top edge to the 7-in. control line. Next, install starter courses over rake drip-edges, using the same overhang you used for eaves. Rake starter strips overlap eave starter courses when they meet at lower corners. Along both ends of the roof, measure up from the 12-in. control line and snap exposure chalklines for the shingle courses to come. That done, you’re ready to install the first course of shingles.

Shingling the field. Install the first course of shingles over the starter course. If you’re right­handed, start at the left side of the roof and work right; otherwise, you’ll be reaching across your­self continually. Left-handers, of course, should start right and work left.

image165
Подпись: A pyramid pattern is best for installing laminated shingles that don't have distinct cutouts. As you build the pyramid along the rake edge, trim excess from the rake end so a factory end always leads off each course. Align shingles to horizontal chalklines you snap, not to lines printed on building paper. This method is also shown in the photo sequence on p. 80.

Using a Pyramid Pattern Layout

Earth Energies: Choosing the Right Site

Choosing a site that avoids hazardous pollutants and then building with healthy materials are vital for creating a healthy home. The naturally occur­ring Earth energies, known as geopathic stress, are another important factor to consider. These ener­gies result from polar magnetism, underground domes, veinsand streams of water, radon gasemis – sions, electromagnetic waves, and seismic activity. Their effects can be seen in rockfaufts, fissures and geological stresses, power spots, vortices, mineral and ore deposits, and underground caves.

Their health effects can range from subtle to severe, with some being well accepted and oth­ers less recognized and sometimes controversial. California prohibits new construction over earth­quake faults, and the US Environmental Protection Agency recommends that all homes be checked for radon gas emissions. Switzerland and Germany have mandated testing for geopathic stress before hospitals, schools, and multifamily dwellings are constructed.

Increasingly, the human body is also subjected to the effects of artificially produced electromag­netic forces. These result from mining, building foundations, excavations, underground trans­portation, sewers, water pipes, communication
systems, electrical generation, and transmission infrastructure as well as microwaves, satellites, ra­dar, cell phones, and wireless technologies.

In the 1940s, German researchers Ernest Hart­mann and Manfred Curry identified a tightly wo­ven network of magnetically charged, naturally occurring energy lines crisscrossing the Earth and penetrating buildings. When geopathic stress is combined with human-caused stress conditions over a prolonged period of time, our health can be profoundly affected.

Our five senses pick up an infinitesimal part of the spectrum of information about these stresses. In the past, known locations with high levelsof nat- urallyoccurring harmful Earth forces wereavoided. Indigenous people were aware of places where subtle energies supported the abundant growth of plants and trees and the health of animals. We are all familiar with special places that make usfeel comfortable, warm, or inspired. Similarly, when we walk into other spaces we become disturbed, cold, or restless. Overtime, the places where we live and work will have an impact on our health.

Our understanding of these subtle health ef­fects is growing. According to the Dulwich Health Clinic in London, geopathic stress is present in
problems may be costly. Industrial toxins in the soil, poor percolation for installing a sep­tic system, and unstable soils are examples of conditions that might be causes for concern. We recommend that you make your offer to purchase contingent on inspections by profes­sional consultants. In this way you can prevent being obligated to purchase a contaminated or otherwise unacceptable site. The following sections describe some of the more common consultant specialties.

Phase I Environmental Inspector

If you are considering a property with a past of industrial or agricultural use or underground fuel tanks, or if old buildings are suspected of containing lead or asbestos, then a Phase I environmental audit should be conducted to

people with most types of serious and long-term illnesses. "Geopathic stress does not cause any specific type of illness but lowers your immune system and your ability to fight off viruses and bacteria."9

In 1989, Otto Bergsmann found measurable changes in levels of serotonin, melatonin, calcium, and zinc when a person was subjected to noxious Earth energy emissions.13 Hans Nieper concluded that the incidence of cancer was higher over geo­pathic zones: "Geopathic zones increase the risk of gene lability," or genetic errors. He strongly ad­vised those suffering from these ill effects to re­move themselves from the site of geopathogenic exposures

Kathe Bachler has linked children’s poor school performance to geopathogenic "interfer­ence zones."d After investigating noxious geo­pathic lines and chronic fatigue syndrome in 14,000 cases, Alf Riggs concluded that geopathic stress is a major factor in 72 percent of cases of the syndrome and that measurable improvement oc­curred when a patient’s bed was moved to a neu­tral location. There was even more improvement when a wooden bed was substituted for a metal bed and mattress springs. e

Other physical indicators have included:

• sleep disorders (strong resistance to going to bed, insomnia, nightmares, sleepwalking, sweating, cold/shivers, waking feeling tired/ unrested, waking feeling nauseous)

• an aversion to lying in certain spots in one’s bed

• experiencing a feeling of falling out of bed

• depression, stress, rapid heart rate, or cramps

Some physicians suggest that, if symptoms do not respond to normally successful treatments, Earth energies may exist in their patient’s home.

Conventional electronic scientific instruments can be used to indicate zones of geopathic stress by measuring parameters such as conductivity of the ground and air, DC magnetic fields, changes to air ionization, ground temperature, above-nor­mal soil or air humidity, and seismic activity. These sophisticated instruments are expensive and not generally usable by the public.

Plant life and animal behavior can indicate ar­eas of geopathic stress. Cats, bees, and ants are drawn to these areas. Cattle, horses, sheep, pigs, swallows, chickens, and dogs avoid them. In tradi­tional cultures, animals were herded onto building identify the risks. Remember that up-front costs are minor compared to hazardous waste cleanup costs, which may far exceed property value.

Geotechnical Consultant

If you are concerned about the geological structure of the site, you should consult with a geotechnical engineer, who will be able to troubleshoot problems such as high water tables, unstable soils, expansive soils, earth­quake faults, and sink holes. Engineering so­lutions can be devised for many of these prob­lems so that the costs of development can be determined before you purchase the land.

Septic Engineer

In many locations where municipal sewers are not available, an engineered septic system plan is required before a building permit will be issued. The septic engineer, who is often a geotechnical engineer as well, will study the

sites and their behavior was observed to ensure avoidance of geopathic stress. Oak, ash, elm, and willow trees thrive in areas of high geopathic stress whereas fruit trees do not. Trees can also be observed to see if they lean, twist, or grow knurls.

Lightning has been reported to strike where underground water veins cross and geopathic stress appears to be more prevalent in areas of ex­posed fractured igneous or sedimentary rock and less common in areas with a thick overburden of gravel or soil. Clay soils seem to accentuate the stress. Even observation of buildings can be use­ful since cracks, moisture, mold, crumbling plaster, discoloration and damaged materials in existing construction, and patterns of alignment or deteri­oration of stone, masonry, concrete, or pavement correspond to areas of geopathic stress and can indicate its presence.

For centuries, dowsers or diviners have lo­cated water veins, energy grids, and points of el­evated energy (power spots). Levels of skill and techniques for assessing, locating, and correcting these forces vary considerably, but results are re­ported to be consistent among experienced prac­titioners.

Geopathic stress can be reduced or reversed, but the most important corrective measure is avoidance. Architects and designers should take land energies into account and avoid them when siting buildings. In its top 25 principles, Building Biology considers geobiology in the process of selecting building sites and materials. It recom­mends avoiding certain materials such as steel structural frames, metal furniture, electrical wir­ing, and ductwork, which conduct and transmit Earth energies throughout a building.

Various correction techniques and devices have been proposed. Individual research and testing by experienced practitioners is recom­mended to ensure that any corrective measures are effective and do not have any unhealthy con­sequences.

Choosing building sites with a balanced qual­ity can positively influence our health. It is not a good idea to spend extended time in negatively stressed areas or to inhabit places of high ener­getic activity. Pay attention to how you feel on a po­tential building site. Applying information about Earth energies known from ancient universal prac­tices will have a profound effect on our health and well-being in our homes and workplaces.

Further information:
land formation and perform percolation tests to determine how the sewage waste projected for your development can best be handled. In areas with limited percolation, steep slopes, or high water tables, the installation of a proper septic system could be costly or even impossi­ble. If such conditions exist, it is best to be in­formed prior to purchasing the land.

Step 9-Subfloor Sheathing

Подпись:Подпись:7. Start second row with half sheet so ends will be staggered.
1. Chalk a line at
4′-%" on joists.


!/б" gap – larger if moist application (check with instructions on sheathing)


4. Pull layout on
sheathing.


3. Center sheathing to last joists and on chalk line, then nail,


6. Nail remaining joists, setting them to layout marks.


pr4J


Step 9-Subfloor Sheathing

Step 9-Subfloor Sheathing

Подпись: a

ЖЙЇЇЇЗйг

Six Steps for Setting First Sheet of Sheathing

MAKING A BLOCK-CUTTING TOOL

Many carpenters cut blocks with a chopsaw, which is fine if you have one. But there is another easy way to cut blocks. Try making a simple block-cutting tool to use with a circular saw. Once you have the guide, simply hook it on a 2x and make the cut along the edge.

Подпись: That empty feeling. When installing sheathing, you can feel when a nail doesn't hit a joist—it goes in too easily. Driving a fresh nail to the left or right of the dud usually results in solid contact.

joists, bridging is often visible between the rim joists and the interior girders or crib walls in the basement or crawl space of an old house. Stress tests have long shown that bridging provides little extra stability to a floor sheathed with plywood or OSB. My experience is that most midspan bridging does little except increase floor squeaks.

Blocking between joists, on the other hand, helps stabilize a building and keeps the joists from falling like dominoes under severe lateral stress, such as that generated by an earthquake
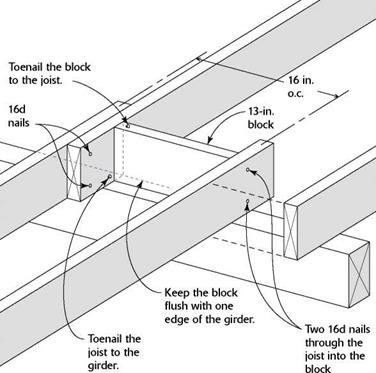
or high winds. Blocking is installed at the bearing points where joists cross girders or crib walls. On many houses, this is also the spot where joists from opposite sides of the building lap against each other (see the illustration on the facing page). To quickly cut identical blocks with a circular saw, use a jig like the one shown in the sidebar above.

If you’re building with I-joists, you’ll need to determine the length of the blocking on the job site, as I-joist width varies from manufacturer to manufacturer. The most common width

Подпись: iiiiiiiiiiiiiiiiiiiiiiiiiiiiiiiiiiiiiiiiiiiiiiiiiiiiiiiiiiiiiiiiiiiiiiiiiiiiiiiiiiiiiiiiiiiiiiiiiiiiiiiiiiiiiiiiiiiiiiiiiiiiiiiiiiiiiiiiiiiiiiiiiiiiiiiiiiiiiiiiiiiii NAILING BLOCKING AT LAPPED JOISTS MAKING A BLOCK-CUTTING TOOLMAKING A BLOCK-CUTTING TOOL

for residential I-joists is 9V2 in., so you can cut blocking from scrap pieces of I-joists or from 2×10 lumber. Cut the blocking to fit snugly between the chords of adjacent I-joists, and nail the blocking to the chords.

When nailing blocking between joists, it’s best to begin at one end of the house and simply work your way toward the opposite end. Sight down the length of the first joist (the one closest to the rim joist) and make sure it is running straight. Measure the first joist space and cut the block to length. Set the block on edge over a girder or a crib wall. Drive two 16d nails into one end of the block and two 16d nails through the floor joist into the opposite end. Then nail the joist directly into the girder with two 16d nails. Finish by nailing the lapping joists to­gether with two more 16d nails.

Once you have a few blocks nailed in place, use a tape measure to make sure the joists are maintaining an accurate 16 in. or 24 in. o. c. layout so that the sheathing will land mid-joist. If necessary, cut the blocks a bit short or long to maintain accurate spacing.

In many parts of the country, rough plumb­ing and heating ductwork are installed before the floor is sheathed, so be sure to check with those contractors before sheathing. Also, find out whether you need a floor joist inspection before you install the floor sheathing.

STEP 8 INSTALL THE FLOOR SHEATHING

Before plywood and OSB were readily available, we sheathed floors with softwood 1x 6s that were cut and nailed diagonally across the joists. To make the joints between the 1×6 boards, the ends of each board were cut at a 45-degree angle. Frequently, the 1×6 lumber was of poor quality and had large knots. I still have scars

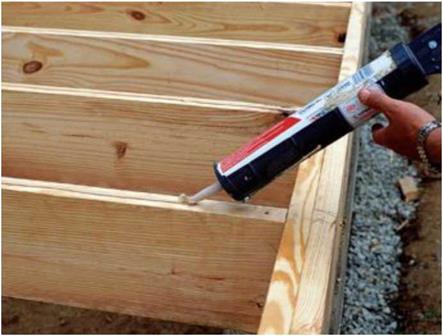
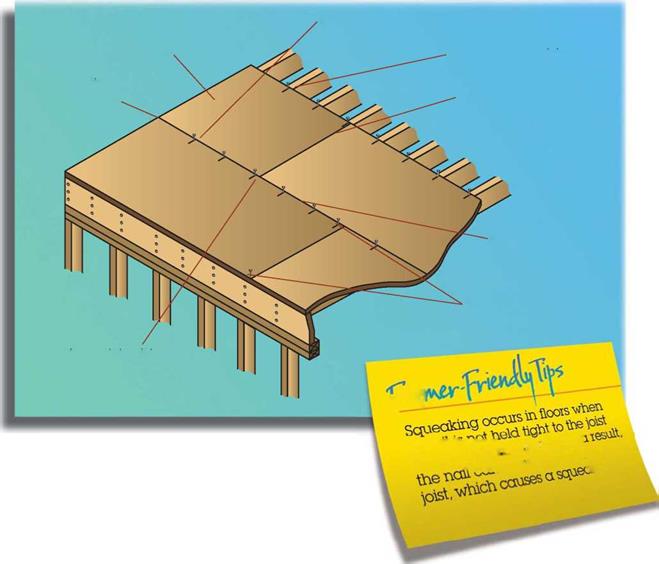
Sheathing must be glued and nailed. Use a caulk­ing gun to apply a bead of construction adhesive to the joists’ top edges before installing the floor sheathing. The adhesive strengthens the floor and helps reduce squeaking in the future.

Lapped joists spaced at 16 in. o. c. require a block about 13 in. long between the joists.