Tune Up Existing Insulation

The two types of insulation that are usually found in older attics are fiberglass batts and loose-fill cellulose. For batt insulation to perform at its rated level, it must be installed snug to the ceiling surface and to the edges of the framing. Any gaps or voids reduce the insulation’s effectiveness. If the existing insulation is in good condition, it can be reused.

I tune up the insulation by tightening end joints, making sure batts are tight to the ceiling drywall, and filling in any voids with new pieces of insulation.

If I’ve decided to increase the amount of insulation with more batts, I like to bring the level of the older batts flush with the top of the joists and then install a new layer of unfaced batts running perpendicular to the joists. Placed above the joists, the cross-

(continued on p. 53)

Composite Pavement Distress—Visual Rating

Composite pavement deterioration is exhibited in a combination of some flexible pave­ment distresses and some rigid pavement distresses. The most prominent composite pavement distresses, which were defined under flexible or rigid pavement, are raveling, bleeding, rutting, corrugations, pumping, and various slab distresses.

3.8.2 Investigative Methods

If a pavement exhibits structural distresses, such as cracking, patching, potholes, faulting, etc., further evaluation may be necessary to identify the cause of the distress, the extent,

and the strength of the existing pavement system and subgrade. Roadways with high traffic volumes, especially those with high truck volumes, should also be evaluated prior to rehabilitation.

Pavement Coring. Without question, the simplest and most reliable method of identifying pavement deterioration is pavement coring. Pavement coring can be used to investigate many different pavement distress factors, from rigid joint deterioration to stripping in asphalt concrete pavement layers. The following are examples of pavement cores taken in various investigations.

Figure 3.41 shows a core of a composite pavement taken at a transverse joint. The core reveals a tight joint with aggregate interlock and little or no deterioration. The asphalt overlay is left intact. However, during the coring operation, the asphalt portion of the core should be inspected for delaminations between paving layers, rutting of any layers, or stripping of the asphalt from the aggregate.

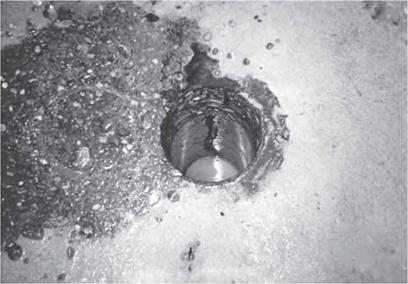
Figure 3.42 shows a core hole in the pavement taken at a midpanel transverse crack. A wealth of information can be obtained by inspection of the core hole. The core hole reveals aggregate interlock to be questionable. A close inspection revealed the reinforcing mesh to be rusted and broken, not cut by the coring operation. Because the core hole indi­cates most of the aggregate interlock is lost, this crack can be considered a working crack and should be repaired.

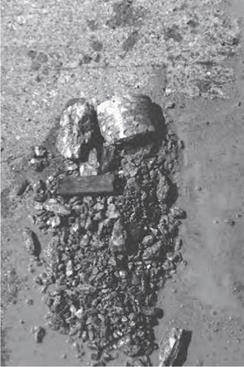
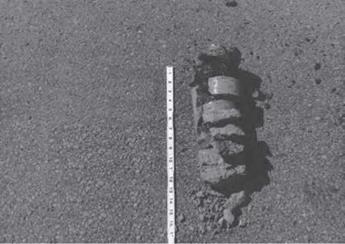
Figures 3.43 and 3.44 show the remains of cores taken at transverse joints. It is obvious that these joints need a full-depth repair. Cores should also be taken away from the joint to determine required width of repair.

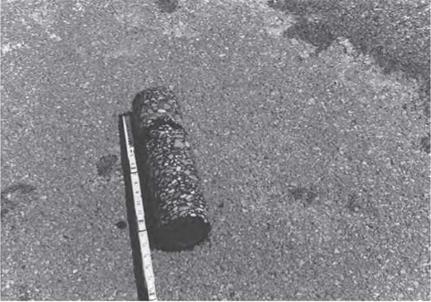
Figure 3.45 shows a core of an asphalt pavement that indicates a delamination approximately 3 in (75 mm) from the surface. Several cores should be taken to verify the extent of the flaw. A delamination found in an asphalt pavement such as this could result in debonding of the surface layer. If warranted, asphalt milling may be required to a depth sufficient to remove the delamination.

Composite Pavement Distress—Visual Rating

Composite Pavement Distress—Visual Rating

FIGURE 3.42 Hole in pavement after core was drilled at transverse crack in composite pavement.

Composite Pavement Distress—Visual Rating

FIGURE 3.43 Crumbled core taken from transverse joint in rigid pavement.

Composite Pavement Distress—Visual Rating

FIGURE 3.44 Crumbled core taken from transverse joint in composite pavement.

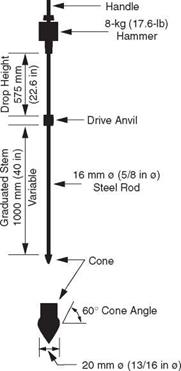
Dynamic Cone Penetrometer. The dynamic cone penetrometer (DCP) is commonly used to determine the stiffness of the base and/or subgrade. As shown in Fig. 3.46, the DCP consists of a 13/16-in (21-mm) diameter, 60° cone mounted on a 5/8-in (16-mm) rod. A 17.6-lb (8-kg) weight is attached to the top of the DCP in such a manner that it can be raised 22.6 in (574 mm) and released while the cone is resting on the base or subgrade.

Composite Pavement Distress—Visual Rating

FIGURE 3.45 Core from flexible pavement indicating delamination about 3 in (75 mm) from surface.

Composite Pavement Distress—Visual Rating

FIGURE 3.46 Schematic of dynamic cone penetrometer. (From Pavement Technology Advisory 97-7, Dynamic Cone Penetrometer, Illinois Department of Transportation, Bureau of Materials and Physical Research, 1997, with permission)

The penetration per drop of the weight is correlated to the CBR or modulus of the base or subgrade. Figure 3.47 shows one such correlation used by the Illinois Department of Transportation. The DCP is popular because it is a relatively inexpensive device that can rapidly determine the stiffness of a base or subgrade in the field.

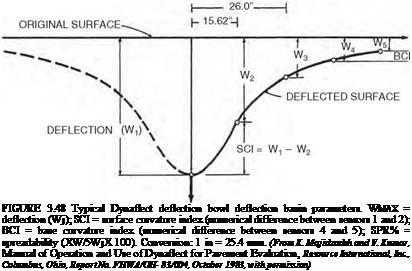
Nondestructive Testing. The most common of the nondestructive testing (NDT) methods is a deflection measuring device such as the falling weight deflectometer (FWD), road rater, and Dynaflect. These devices place a load, either impulse or cyclic, on the pavement and measure the deflection of the pavement using three or more geophones placed at various dis­tances from the load. The measured deflection at each sensor can be described as a “deflection bowl” (see Fig. 3.48). The deflection bowl can be used to evaluate the pavement and to determine the stiffness of the pavement system and individual pavement layers. Stiffness of the layers can be determined using any one of numerous backcalculation programs such as Modulus, Modcomp, Evercalc, etc.; many of which are available in the public domain. The calculated stiffness can then be used to design a rehabilitation treatment. The various deflec­tion parameters shown in Fig. 3.48 can also be used to evaluate the pavement. Table 3.27

0.1 1 10 Penetration Rate, in/blow

Подпись: FIGURE 3.47 Correlation of California Bearing Ratio (CBR) and penetration rate. Conversion: 1 in = 25.4 mm. (From Pavement Technology Advisory 97-7, Dynamic Cone Penetrometer, Illinois Department of Transportation, Bureau of Materials and Physical Research, 1997, with permission)

— . 49.03” 37.36”

Подпись: FIGURE 3.48 Typical Dynaflect deflection bowl deflection basin parameters. WMAX = deflection (Wj); SCI = surface curvature index (numerical difference between sensors 1 and 2); BCI = base curvature index (numerical difference between sensors 4 and 5); SPR% = spreadability (XW/5WjX 100). Conversion: 1 in = 25.4 mm. (From K. Majidzadeh and V. Kumar, Manual of Operation and Use of Dynaflect for Pavement Evaluation, Resource International, Inc., Columbus, Ohio, Report No. FHWA/OH- 83/004, October 1983, with permission)
P

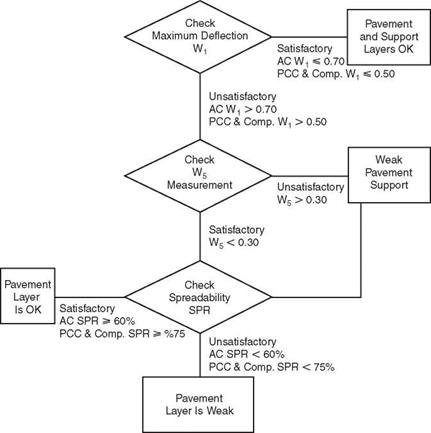
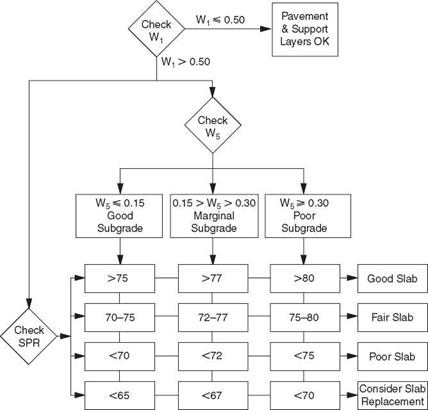
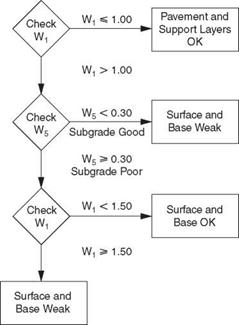
and Figs. 3.49 through 3.52 show an example of how the Dynaflect deflections can be used to determine subgrade and pavement conditions.

Ground Penetrating Radar. Improved analysis software has moved the ground pene­trating radar (GPR) from research to common usage. This GPR consists of a transmitter

TABLE 3.27 Joint Evaluation of Rigid and Composite Pavements

Dynaflect SCI (W1 – W2)

Joint condition

< 0.05

Probably frozen

0.05-0.11

Good load transfer

0.11-0.23

Fair load transfer

> 0.23

Poor load transfer

Source: K. Majidzadeh and V. Kumar, Manual of

Operation and Use of Dynaflect for Pavement Evaluation, Resource International, Inc., Columbus, Ohio, Report No. FHWA/OH-83/004, October 1983, with permission.


Composite Pavement Distress—Visual Rating

FIGURE 3.49 Rigid and flexible (thickness >6 in or 150 mm) pavement evaluation from Dynaflect measurements. (From K. Majidzadeh and V. Kumar, Manual of Operation and Use of Dynaflect for Pavement Evaluation, Resource International, Inc., Columbus, Ohio, Report No. FHWA/OH-83/004, October 1983, with permission)


Composite Pavement Distress—Visual Rating

FIGURE 3.50 Evaluation of rigid and composite pavements from Dynaflect measurements. (From K. Majidzadeh and V. Kumar, Manual of Operation and Use of Dynaflect for Pavement Evaluation, Resource International, Inc., Columbus, Ohio, Report No. FHWA/OH-83/004, October 1983, with permission)

and receiver. The GPR transmits pulses of electromagnetic energy at various frequencies into the pavement system. The pulses are reflected back to the receiver by the interface of the various pavement layers. The dielectric constant of the various pavement layers is determined by coring the pavement and calibrating the GPR. The GPR can be used to determine pavement layer thicknesses, locate voids, and locate areas with high moisture. Use of the GPR has been standardized in ASTM D-4748.

Spectral Analysis of Surface Waves. Spectral analysis of surface waves (SASW) is cur­rently a research tool but may find use as an evaluation tool in the near future. As shown in Fig. 3.53, two or more accelerometers are attached to the pavement in line with the test point. An instrumented hammer is used to generate surface waves. The accelerometers measure the travel time of the surface waves. By varying the distance between two accelerometers or by using multiple accelerometers, data can be gathered for the deeper pavement layers. Analysis of the surface waves can be used to determine the modulus and thickness of each layer in the pavement surface.

Composite Pavement Distress—Visual Rating

FIGURE 3.51 Evaluation of thin (thickness 4 to 6 in) asphalt pavements from Dynaflect measurements. (From K. Majidzadeh and V. Kumar, Manual of Operation and Use of Dynaflect for Pavement Evaluation, Resource International, Inc., Columbus, Ohio, Report No. FHWA/OH-83/004, October 1983, with permission)

Flexible Pavement Distress—Visual Rating

Flexible pavement deterioration is exhibited in any combination of the following distresses.

Raveling. Raveling, as shown in Fig. 3.31, is the result of loss of small aggregates from the pavement surface. Raveling can be caused by oxidation of the mix, improper mix design, segregation, or lack of compaction.

Bleeding. Bleeding is the flushing of excess asphalt cement to the surface of the pavement, as evident in Fig. 3.32. Asphalt cement concrete mixtures are more prone to

Flexible Pavement Distress—Visual Rating

Flexible Pavement Distress—Visual Rating

FIGURE 3.33 Example of small pothole in flexible pavement.

bleed with hotter pavement surface temperatures. Bleeding is a result of excess asphalt cement in the mix and/or low air voids in the mix.

Potholes. One of the most common problems is the development of a pothole (Fig. 3.33). Potholes are small, localized, but deep pavement failures characterized by a round shape. Potholes are caused by weak and wet subbase and/or subgrade. In freeze-thaw environments, potholes are generally formed during the thaw.

Rutting. Rutting (Fig. 3.34) is the longitudinal deformation of the pavement structure within the wheel tracks. Where found only in the uppermost portions of the pavement, it is caused by poor mixture design and lack of stability. Where rutting is deep-seated and found throughout the depth of the pavement structure, it is caused by inadequate pavement structure above the founding layers or by a weak, wet subgrade.

Corrugation. Corrugations (Fig. 3.35) are transverse waves in the pavement profile, which are found most generally at stop lights, at stop signs, or on hills. Corrugations are found in the wheel track and are the result of acceleration and deceleration of heavy trucks in a regular pattern on the roadway surface. The stability of the asphalt mix can also be a contributing factor.

Longitudinal Cracking. Longitudinal cracking, such as shown in Fig. 3.36, is most often found at paving joints established during construction. The construction joint is most gen­erally specified at lane lines. As weathering of the pavement takes place, the longitudinal joint ravels and eventually spalls. Longitudinal cracks found at locations other than paving joints are due to thermal shrinkage from seasonal temperature changes.

Transverse Cracking. As illustrated by Fig. 3.37, transverse cracking is best described by cracks that form across the pavement perpendicular to the centerline.

Flexible Pavement Distress—Visual Rating

FIGURE 3.34 Example of rutting in flexible pavement.

Transverse cracking is caused by thermal shrinkage from seasonal temperature changes and age hardening of the binder.

Block Cracking. Block cracking is the combination of longitudinal and transverse cracking, as shown in Fig. 3.38. As the cracks worsen with time as a result of weathering, they join each other and form block cracking.

Flexible Pavement Distress—Visual Rating

Flexible Pavement Distress—Visual Rating

FIGURE 3.36 Example of longitudinal cracking in flexible pavement.

Wheel Track Cracking. Wheel track cracking is shown in Fig. 3.39. It can be described as mostly longitudinal cracks found at the surface of the pavement within a 3-ft-wide (0.9-m) strip considered to be the wheel track. Wheel track cracking ranges from a single longitudinal crack to a series of interconnected longitudinal cracks, also referred to as alligator cracking. Wheel track cracking is commonly considered to be the most alarming distress found in a flexible pavement. This type of cracking starts at the bottom of the pavement structure and is transmitted to the surface. By the time alligator cracking can be detected by visual inspection, the pavement is generally considered to be failed.

Flexible Pavement Distress—Visual Rating

Flexible Pavement Distress—Visual Rating

FIGURE 3.38 Example of block cracking in flexible pavement.

Flexible Pavement Distress—Visual Rating

Flexible Pavement Distress—Visual Rating

FIGURE 3.40 Example of edge cracking in flexible pavement.

Edge Cracking. Edge cracking, as shown in Fig. 3.40, is a series of short longitudinal or irregular-shaped cracks at the outer 15 in (380 mm) of the pavement. Edge cracking is a result of lack of support outside the pavement edge.

Continuously Reinforced Rigid Pavement Distress—Visual Rating

Continuously reinforced concrete pavement deterioration is exhibited by the same dis­tresses discussed for jointed concrete pavement along with the following additional considerations.

Settlement. As previously stated, settlement as displayed by a depression in the pro­file of the pavement affects the smoothness of a pavement. It may be the result of poor construction practice such as poor compaction over a utility, poor grade control during final grading of the subgrade, or localized soil conditions that cannot resist additional overburden or increased loading. Repair methods consist of replacement to the cor­rected profile or an overlay. However, settlements are more predominant in CRC pavement, because transverse cracks are inherently more numerous. With the trans­verse cracking at a spacing of 5 to 8 ft (1.5 to 2.4 m), the pavement is able to bend more freely and does not bridge weak foundations as effectively.

Continuously Reinforced Rigid Pavement Distress—Visual Rating

FIGURE 3.28 Example of corner break in jointed rigid pavement.

Trans-verse Cracking. Although CRC pavement is designed to have transverse

cracks, the cracks should be spaced properly. Transverse cracks spaced too closely (less than 3 ft (0.9 m), as illustrated in Fig. 3.29) have a good chance of interconnect­ing, because they do not form uniformly straight and perpendicular to the centerline. Thus, as they interconnect, spalling will occur and pavement failures will result. On the other hand, transverse cracks spaced too far apart create higher stresses than the reinforcement can tolerate, and this can also result in pavement failures. Although

Continuously Reinforced Rigid Pavement Distress—Visual Rating

Continuously Reinforced Rigid Pavement Distress—Visual Rating

FIGURE 3.30 Example of punchout in continuously reinforced rigid pavement.

Continuously Reinforced Rigid Pavement Distress—Visual Rating

incorrect transverse crack spacing is not a distress by itself, it must be monitored to help pavement engineers predict failures. Once failures are evident, they must be repaired by full-depth pavement removal and replacement. It is important to reestablish conti­nuity of the reinforcement within the repair.

Punchouts. Figure 3.30 shows a punchout in a CRC pavement. A punchout is formed by the combination of intersecting transverse and longitudinal cracks over an area of weak foundation.

The oasis of Maryab; the great dike on the wadi Dhana

Maryab is the largest city of the region during the period of the sudarabic kingdoms. It occupies some 90 hectares enclosed by a 4.5 km wall. The site, apparently dating from the IInd millennium BC, is located some ten kilometers downstream of a gorge through which the wadi Dhana leaves the mountains. This wadi, typical of others in the region, has only occasional but particularly violent floods (twice a year, in April and July – August). Its flood flow can be as high as 600 m3/sec.

At first, partial diversions are employed to make use of water in the wadi, as is done throughout the region. Inscriptions from the 6th or 5th century BC mention the con­struction or rehabilitation of water intakes. As completed, these are massive installa­tions of cut stone, from which emanate two irrigation canals that branch out to deliver water to two vast irrigation zones on either side of the course of the wadi. At an unknown date (perhaps prior to, or perhaps after the 5th century BC), the bed of the wadi is blocked by a large earth dam, 15 m high and 650 m long, with rock protection on its upstream face. The reason for this dam, which is unique in the region, is proba­bly found in the continuously rising elevation of cultivated lands due to the deposition of sediments. The thickness of such deposits can reach 30 meters. One can imagine that the initial response to this increase in level is to move the intakes further upstream (there are remains of even older works downstream of the dam). But once the intakes had been moved all the way upstream to the narrow gorge from which the wadi Dhana emanates, the only solution became to raise the water level for the intakes by complete­ly blocking the gorge.

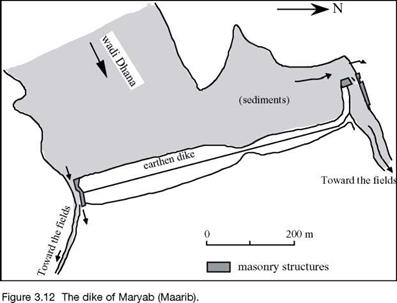
In its final form, the irrigation infrastructure of Maryab is truly impressive.[134] [135] It includes a vast reservoir that, during floods, extends 4 km upstream of the dam. The intake at the north edge of the dam includes two passages, 3 and 3.5 m wide and 9 m high, that can be blocked by sliding beams into grooves carved into the massive stone

blocks. These passages lead to a sort of stilling basin, whose outlet supplies a 14 m wide canal that is 1,100 m long. This principal canal ends at a stone distribution basin fitted with numerous channels leading toward secondary canals.

At the southern extremity of the dam, an 80-m long masonry revetment, 11m high, protects the flank of the dike and borders the intake channel, 4.5 m wide. Here again, grooves are provided for controlling the water flow. This intake structure provides access to another narrower canal, as on the north side, but it is only 4 m wide.

On each of the two banks of the wadi, there is a side weir that permits overflow of excess water back into the channel (Figure 3.12). The two irrigated zones, covering some 5,700 hectares to the north and 3,750 to the south, comprise the “two gardens of Sheba”, veritable oases that will later be celebrated by Arab writers.

The oasis of Maryab; the great dike on the wadi Dhana

It is quite likely that the capacity of the two outlets ends up being insufficient dur­ing large floods, given the continuous deposit of sediments in the reservoir. The dam is probably damaged, and perhaps fails, by overtopping on several occasions. According to inscriptions, there was a rupture that was repaired in the middle of the 4th century BC, and major reconstructions in 456, 462, 549, and 558 BC.52 The definitive failure of the dam, occurring in the 6th century BC soon after the last reconstruction, is mentioned in the Koran:

“There was surely a sign in their country, for the people of Sheba: two gardens, to the right and left (that is to say on each side of the wadi). (…).

But they sidestepped this. Therefore we send against them the flooding of the Dam, and we changed their two gardens into two gardens of bitter fruits, tamarix and jujube trees.”-”

The city of Maryab cannot survive this catastrophe, and is abandoned. [136]

Use special markings to help other tradespeople

It’s important to remember that the framing must accommodate plumbing, heating, and electrical features. Talk to the subcontractors before you even start on the floor. Show them your plans and find out what you can do when it comes time to frame walls so that they can do their work without having to remodel your structure.

You can start by asking the plumber whether there’s anything you can do while laying out the bathroom to make it easier to install the pipes. The plate layout for a typical bathroom is shown in the illustration below. Code requires a minimum of 31 in. from sidewall to sidewall for a toilet. The wall behind a toilet

is usuallv 12: in. from the center of the waste

/

drain. Standard bathtubs are usuallv 30 in. wide and 60 in. long. If building on a slab, you may need a 12-in. bv 12-in. access hole in the

* 4

Use special markings to help other tradespeople
wall so the plumber can hook up or repair the

Jointed Rigid Pavement Distress—Visual Rating

Jointed rigid pavement deterioration is exhibited in any combination of the following distresses:

Surface Deterioration. Surface deterioration (Fig. 3.22) is the result of loss of cement at the surface of the slab (scaling). It is generally caused by excessive surface water and finishing practice, or the loss of both small aggregates and cement caused by abrasion from tires. Surface deterioration affects the noise level of a pavement and cannot be repaired. Surface deterioration by itself is generally of little concern.

TABLE 3.26 Pavement Coefficients for Flexible Section Design, Louisiana

Strength*

Coefficient

I. Surface course*

Asphaltic concrete

Types 1, 2, and 4 BC and WC

1000+

0.40

Types 3 WC

1800+

0.44

BC

1500+

0.43

II. Base course

Untreated*

Sand clay gravel—grade A

3.3—

0.08

Sand clay gravel—grade B

3.5 —

0.07

Shell and sand-shell

2.2—

0.10

Cement-treated§

Soil-cement

300+

0.15

Sand clay gravel—grade B

500+

0.18

Shell and sand-shell

500+

0.18

Shell and sand-shell

650+

0.23

Lime-treated*

Sand-shell

2.0—

0.12

Sand clay gravel—grade B

2.0—

0.12

Asphalt treated*

Hot-mix base course (type 5A)

1200+

0.34

Hot-mix base course (type 5B)

800+

0.30

III. Subbase course*

Lime-treated sand clay gravel—grade B

2.0—

0.14

Shell and sand-shell

2.0—

0.14

Sand clay gravel—grade B

3.5 —

0.11

Lime-treated soil

3.5 —

0.11

Old gravel or shell roadbed (8-in thickness) (200 mm)

0.11

Sand (R-value)

55+

0.11

Suitable material—A—6 (PI = 15—)

0.04

IV. Coefficients for bituminous concrete overlay

Base course

Bituminous concrete pavement

New

0.40

Old

0.24

Portland cement concrete pavement

New

0.50

Old, fair condition

0.40

Old, failed

0.20

Old, pumping

0.10

Old, pumping (to be undersealed)

0.35

*Refer to the following footnotes for strength designations. See the AASHTO guide referenced below for further details.

^Marshall stability number.

*Texas triaxial values.

§Compressive strength, lb/in2 (1 lb/in2 = 6.895 X 10—3 MPa)

Source: Interim Guide for Design of Pavement Structures, American Association of State

Highway and Transportation Officials, Washington, D. C., 1972 (rev. 1981), with permission.

Jointed Rigid Pavement Distress—Visual Rating

FIGURE 3.21 Procedure for determining thicknesses of layers using a layered analysis approach. a, D, m, and SN are defined in the text and are minimum required values. An asterisk indicates that the value actually used is represented; this value must be equal to or greater than the required value. (From Guide for Design of Pavement Structures,

American Association of State Highway and Transportation Officials, Washington, D. C., 1993, with permission)

Popouts. Figure 3.23 shows a typical popout. Popouts are generally due to high steel placement, but also may be the result of poor-quality aggregate, which disintegrates, causing cavities at the surface of the slab. Popouts affect the noise level of a pavement and cannot be repaired. Popouts by themselves are generally of little concern.

Pumping. Pumping is defined as the ejection of subbase or subgrade materials from under a pavement through a joint or crack and out onto the pavement and shoulder. The loss of subbase or subgrade material causes loss of support and leads to corner breaks and faulting. The existence of pumping can be determined visually by the pres­ence of soil stains at the joints or cracks on the adjacent shoulder.

Faulting. Faulting is a result of the loss of load transfer across a joint or crack, which causes the slab on one side of the joint or crack to be at a lower elevation than the slab on the other side. Faulting (Fig. 3.24) is generally a result of pumping. Faulting affects the noise level and the smoothness of a pavement. It is generally con­sidered excessive when faulting exceeds 1/4 in (6 mm). Faulting can be corrected by pavement grinding, joint or crack repair, or slab jacking. However, unless load transfer

Jointed Rigid Pavement Distress—Visual Rating

FIGURE 3.22 Example of surface deterioration in jointed rigid pavement.

Jointed Rigid Pavement Distress—Visual Rating

Jointed Rigid Pavement Distress—Visual Rating

FIGURE 3.24 Example of faulting at joint in rigid pavement; pavement on right is about 1/2 in (13 mm) lower than that on left.

is established across the joint or crack and any existing voids under the joint or crack are filled, faulting can be expected to return.

Settlement. Settlement is the result of poor construction practice. It may be due to either poor compaction over a utility, poor grade control during the final grading of the subgrade, or possible localized soil conditions that cannot resist additional over­burden or increased loading. Settlement, which is displayed by a depression in the profile of the pavement, affects smoothness. Repair methods consist of replacement to the corrected profile, or an overlay of some type. Settlements are generally of little concern unless they are numerous and severely affect the ride of the pavement.

Joint Spalling. Figure 3.25 shows typical joint spalling, defined as deterioration of the concrete slab around transverse or longitudinal joints. The deterioration is generally only to partial depth and is visible from the surface of the slab. Joint spalling may result from poor-quality aggregates (D cracking); improperly placed dowels, tie-bars, or dowel baskets; or excessive expansion of the concrete (pressure). Repair of spalled joints can be accomplished by either partial-depth joint repairs or full-depth joint repairs.

Jointed Rigid Pavement Distress—Visual Rating

FIGURE 3.25 Example of joint spalling in rigid pavement.

Trans-verse Cracking. A significant transverse crack is depicted in Fig. 3.26.

Transverse cracking severity varies from hairline cracks to cracks sufficiently wide to completely separate the slab into two distinct pieces. Hairline cracks are expected in reinforced concrete and pose no expected problems. In plain concrete pavement, a hairline crack can be a sign of future problems. Without reinforcing mesh to hold the crack together, the long-term performance of the slab is questionable; however, as long as the crack is tightly closed (hairline), it poses no problem. Regardless of

Jointed Rigid Pavement Distress—Visual Rating

Jointed Rigid Pavement Distress—Visual Rating

FIGURE 3.27 Example of longitudinal crack in jointed rigid pavement.

whether the pavement contains mesh, cracks that have separated by a distance greater than one-half of the largest aggregate diameter are generally considered to be failed.

Longitudinal Cracking. Longitudinal cracking, such as shown in Fig. 3.27, may be caused by excessive lane widths, longitudinal joints that were not sawed properly, or local conditions that increase the stress level along the pavement. Longitudinal cracking is pri­marily a concern when it occurs within the wheel track. Where a longitudinal crack is faulted, spalled, pumping, or working and is in the wheel path, it can become a safety hazard.

Corner Breaks. As illustrated in Fig. 3.28, corner breaks are cracks found at the cor­ner of the slab. They usually propagate from the transverse joint to the longitudinal joint. Corner breaks are full-depth cracks and are generally the result of loss of sup­port under the corner of the slab.

Earth Masonry and Other Alternatives to Frame Construction

Introduction

Most code-approved building materials in North America are manufactured using in­dustrialized processes that create components of uniform size and form, with predictable performance characteristics such as fire resis­tance, permeability ratings, insulation values, and structural properties. Since the process of testing such materials for code approval is extremely expensive, only large manufactur­ers who intend to produce, package, and sell a product for wide distribution can afford to test. This product-oriented approval process is not geared toward the analysis and acceptance of nonproprietary unprocessed natural build­ing materials and it has all but closed the door on 9,000 years of preindustrial building tech­nology.

There is at least one exception to this trend that perhaps serves as a model in this coun­try for future code approval of other natural building materials. Wood is a naturally oc­curring, minimally processed building mate­rial that has universal code acceptance even though it is flammable and subject to shrink­age, comes with inconsistent structural prop­erties, and will rapidly deteriorate through rot and insect infestation if left unprotected. In spite of its embarrassingly preindustrial na­ture, it remains the dominant building mate­rial in residential construction, and building codes have succeeded in creating safe guide­lines for its classification and use.

Why consider alternative natural mate­rials such as earth and straw as an option for healthy housing? These historically derived methods of construction differ from standard cavity wall construction in that manufactured petrochemical-based barriers are not installed to retard the flow of vapor through the walls. Instead, vapor is allowed to flow naturally. The massive walls employ hygroscopic nat­ural materials to increase the capacity of the wall to handle the transfer of moisture from the interior and the exterior surroundings and

to release vapor back into the surroundings as climatic conditions change. Because temper­ature change occurs very slowly in the flow­through process, and because dried clay – based materials have the ability to absorb and desorb large amounts of moisture without de­teriorating,1 accumulation from condensa­tion is insignificant. When a home is properly constructed using these mass wall techniques it will be an extremely comfortable environ­ment with superior temperature and humidity stability. Furthermore, because the solid walls provide insulation and can be finished with a covering of plaster or furred-out wood applied directly to them, the need for synthetic exte­rior sheathing, batt insulation, gypsum board, joint fillers, and paint is eliminated. Many volatile organic compound contamination sources are thereby eliminated as well.

In the philosophy of Building Biology, a

Water-Induced Damage in Asphaltic Wearing Surfaces

5.5.1 Introduction: The Problem of Water for Road Surfacings

Practice has shown that asphaltic wearing surfaces which are exposed to water generally start losing aggregates prematurely through a damage phenomenon that has become known as asphaltic ‘stripping’ or ‘ravelling’. Stripping is generally at­tributed to water infiltration into the asphaltic mixture, causing a weakening of the mastic, and a weakening of the aggregate-mastic bond. Due to the continuing action of water and traffic loading, progressive dislodgement of the aggregates can occur. This initial stripping rapidly progresses into a more severe ravelling of the wearing surface, and ultimately leads to pothole forming, Fig. 5.4.

Sometimes, open-graded mixtures are deliberately designed and laid. As de­scribed in Section 5.7, this is to help drain pavement surface water. This tends to

Water-Induced Damage in Asphaltic Wearing Surfaces

Fig. 5.4 Water-induced damage in asphaltic material (a) ravelling (b) potholing (de Bondt, 2005). Reproduced by permission of N. Kringos

allow water to reside more or less permanently within the mixture, contributing to the development of water-induced damage.

An additional challenge in the pavement industry is that there is often a big dif­ference between the asphaltic mixture composition and the material characteristics, which are determined in the laboratory, and the asphaltic mixture which is actually constructed on the road. For instance, with regards to water-induced damage, it is not uncommon for the asphaltic mixture components to be exposed to water, even before construction, Fig. 5.5. Since most aggregates and binders do absorb moisture, when exposed to a wet environment, a binder with a significantly reduced stiffness and an initially damaged mixture would end up on the pavement – see Fig. 5.6.

The only real solution to date, for keeping the asphaltic wearing surfaces at an acceptable performance and safety standard, is frequent closure of the major high­ways for repair and maintenance, implying high costs and frequent road congestion.

Water-Induced Damage in Asphaltic Wearing Surfaces

Fig. 5.5 Wet asphaltic mixture components before construction (Huber, 2005). Reproduced by permission of N. Kringos

Подпись: Time (hrs)
Water-Induced Damage in Asphaltic Wearing Surfaces

Fig. 5.6 (a) water absorption in three SHRP binders (b) reduction of binder stiffness, G*, due to water infiltration (Huber, 2005). Reproduced by permission of N. Kringos

For this reason, it is greatly desired to shift the solution from a repair measure to a preventive measure. This is currently impossible as mixture designers have no prior knowledge of the engineering properties of the mixture at the time of purchase of the bulk materials. Common practice for evaluation of the moisture sensitivity of any particular asphaltic mixture is to perform a set of mechanical tests on dry and moisture-conditioned specimens, giving ‘moisture sensitivity ratios’ for the engi­neering mixture properties. Unfortunately, such ratios can only be used to compare case-specific mixtures under a set of pre-determined conditions, but give no insight into the actual water damage phenomena, nor lead to any fundamental remedies.

For this reason, in recent years, these phenomenological studies are giving way to more fundamental studies in which both experimental and analytical investiga­tions on water-induced damage in asphaltic mixtures are combined. Researchers at Delft University of Technology in the Netherlands have focussed on developing a computational tool which allows a study of the interaction between physical and mechanical water damage inducing processes. The tool developed is named RoAM (Kringos & Scarpas, 2004; Kringos, 2007) and operates as a sub-system of the finite element system developed at TU Delft, CAPA-3D (Scarpas, 2005).

ALL ABOUT HEADERS

ALL ABOUT HEADERSALL ABOUT HEADERS

Spanning the distance above window and door openings, headers transfer the weight of the roof down through the trimmers, making it possible to have openings in a wall without compromising its strength. There are three things you need to know about headers: length, cross-sectional dimensions, and construction details.

Header Lengths

Window and door manufacturers typically provide recom­mended rough opening sizes for the prehung units they sell. To determine the length of a window header, you can simply add 3 in. to the rough opening size; this is the com­bined thickness of the trimmers that support the ends of the header.

■ The length of a door header is usually 5 in. greater than the width of the door. Therefore, a 3/0 door (36 in. wide) needs

a 41-in. header. The extra 5 in. includes 3 in. for the trimmer thickness, 11/2 in. for two 3/4-in.-thick door jambs, and 1/2 in. of clearance space for setting the door plumb.

■ A set of sliding doors typically requires a shorter header than a regular door—just 3 in. longer than the combined width of the pair of doors. For example, a set of 5/0 (60-in.) sliding doors requires a 63-in.-long header, which provides 1У2 in. on each side for the trimmers. After the trimmers are wrapped with drywall, you’re left with a 59-in.-wide opening, which allows the sliding doors to overlap 1 in.

Подпись: “Scrap” pieces are valuable. It's smart to collect and organize the offcuts that accumulate as you cut plates, sills, and other wall parts. (This is a great job for one or two volunteers who haven't worked on a construction crew before.) Shorter pieces of 2x lumber can be used to make essential small parts, such as top cripples and blocking. On the other hand, bifold doors require a header 4[1]/4 in. longer than the actual door size. So 5/0 (60 in.) bifold doors require a 64V4 in. header. The 4V4 in. margin leaves room for two trimmers

(3 in.), a layer of drywall (1 in.), and V4 in. so that the doors will close properly.

■ The standard header length for vinyl­framed windows is 3 in. longer than the rough opening (39 in. for a 36 in. win­dow). For wood-frame windows, head­ers are cut 5 in. longer than the rough opening, just like door headers are. Make sure that the window sizes meet code requirements for daylight, ventila­tion, and egress.

Header Cross Section and Construction

■ The header in a nonbearing wall can be a single 2x. In a load-bearing wall, the length a header spans determines its cross-sectional measurement. For a 3/0 exterior door or a 4/0 window in a 2×4 wall, code requires at least a 4×4 header. A 5/0 or 6/0 window requires

a 4×6 header. An 8/0 window needs at least a 4×8 header. In 2×6 walls, simply increase the thickness of the header to 51/2 in.

■ Headers can be constructed in many ways. They must be as wide as the wall in which they are installed. In cold re­gions, headers are built with gaps so that foam or fiberglass insulation can be added. Talk to builders in your area to find out what’s done locally, and check with the building inspector to make sure the headers you plan to use will meet code.

You can place the top plate alongside the bottom plate or toenail the top plate on edge to the bot­tom plate. These plating strategies maintain the alignment of the top and bottom plates so that you can accurately mark both plates at once.

Interior walls without bolts can be secured to a slab in various ways. You can drill through the plate and into the concrete with a cement bit. Once the hole is cleaned out, you can secure a bolt in the cement using epoxy or by using a bolt that expands as it is tightened.

Another common way to fasten a plate to a slab is by using a powder-actuated tool that shoots a hardened pin through the wood into the concrete. These tools pack serious power, so take care. Ask for training from your site super­visor before using them. Be sure to wear lenses to protect the eyes and plugs for the ears.

STEP 3 COUNT AND CUT THE HEADERS, ROUGH SILLS,

CRIPPLES, AND TRIMMERS