CORROSION PROTECTION OF NEW STEEL BRIDGES

The application of protective coatings to steel bridges, and the maintenance reapplication of coatings, is costly and so alternatives to the use of coated steel should be sought. Where appropriate, unpainted weathering steel should be used instead (see Art. 4.13). If a coated bridge is still the best candidate for the particular location, a long-lasting coating system should be applied.

Modern Paint Systems. The development of high-performance paint systems for new bridges has resulted mostly in two – or three-coat systems involving combinations of various materials including organic and inorganic zinc, epoxy, and urethane. The prime coats of these systems require cleaning the steel to a white or near white condition, which is an expensive operation even when done conveniently in a steel-fabricating plant. The application of subsequent coats, especially field coats, is labor-intensive. Despite these factors, these new systems can provide acceptably economical protection.

Water-Based Paint. The most recent emphasis in the development of paint systems has been on water-based paints. Because they do not contain volatile organic com­pounds, water-based paints can easily conform to the environmental restrictions placed on the levels of those compounds emitted during the painting process. Evaluation of this system and other systems continues. At this time, one can say that there is no one single paint system that is the best and most economical for all exposures. If a department of transportation or another agency representing an area with diverse geography, climate, or industrial development dictates a single-paint system for all parts of that area, it is likely that some of the bridges will be overprotected and some underprotected.

Galvanizing. Depending on local availability of galvanizing facilities of adequate size, steel members of limited length can be hot-dip galvanized. In addition to the deposition of zinc, the galvanizing process results in a change in chemistry of the surface of the steel, where an alloy is created, so that a degree of protection remains after the zinc coating is gone. The different stages of loss of coating and rusting that will eventually occur on galva­nized steel can be seen on exposed highway hardware such as galvanized steel roadside barriers, luminaire supports, and traffic sign and signal supports. Since these structures are more exposed to salt spray than a bridge superstructure may be, unless the bridge is a grade-separation structure, the longevity of the protection may be expected to be greater on a bridge.

Fusion-Bonded Coating. The coating of large structural members by fusion bonding with epoxy or other powders is now feasible in at least one coating plant, but this method of coating has not been used extensively for bridges. It is frequently used for pipe piles.

Metallizing. Another method of coating steel, which has been used on small components of new bridges, such as bearing plates, and on a few existing bridges, is application of a metallic coating by the flame spray method, or “metallizing.” The existing steel is first prepared to a near white condition. Then a continuously fed wire is vaporized in a flame and sprayed onto the surface of the steel. Although results have been satisfactory, the cost on complete bridges has been extremely high compared with other methods of coating.

Selection of Protection System. Environmental conditions and owners’ experience may dictate the selection of a corrosion protection system. Where acceptable life of protection can be expected from galvanizing, painting, or use of unpainted weathering steel, the selection may be based on initial or life-cycle cost. Alternative bids should be encouraged.

Road Equipment

Road equipment comprises crash barriers, road signs, sign-posts, lamp-posts, etc. Many of these structures are made of galvanized steel. Corrosion of these surfaces releases zinc to the environment (Barbosa & Hvitved-Jacobsen, 1999). Corrosion is promoted under moist conditions often prevailing as a result of splashing from the traf­fic during and after precipitation. Soiling and the use of de-icing salt further enhance the corrosion. Re-painting is usually preceded by the removal of old paint. The old paint may contain heavy metals. Regular washing of road equipment may contribute pollutants to the environment in cases where detergents are used (Folkeson, 2005).

6.2.2 Maintenance and Operation

Many measures taken within road maintenance and operation introduce pollutants into the highway environment. De-icing activities are among the most important of these. In countries with a cold climate, de-icing and snow clearing are important measures to reduce slipperiness and maintain the functionality of the road dur­ing periods with frost or snow. Ice and snow control is performed mechanically (ploughing) or with the use of chemicals. The most widely used chemical is sodium chloride (NaCl). As an anti-caking agent, a minute quantity of potassium-ferro – cyanide is often added to the salt. At places, other chemicals than NaCl are used, e. g. urea on some bridges, or calcium chloride or calcium magnesium acetate (Ihs & Gustafson, 1996; Persson & Ihs, 1998). Winter operation of high-class roads, usually heavily trafficked highways, in cold regions is accompanied with the use of large quantities of salt. De-icing chemicals can thus be a considerable source of contamination of soil as well as groundwater and surface waters (Blomqvist, 1998; Johansson Thunqvist, 2003). Moreover, de-icing salt has been shown to mobilise heavy metals accumulated in roadside soils (Norrstrom & Jacks, 1998). Dust­binding chemicals used mainly on gravel roads include inorganic salts such as cal­cium chloride (CaCl2) and magnesium chloride (MgCl2) (Alzubaidi, 1999).

Roadside vegetation and its maintenance also influence the transport of pollutants having entered the road environment. Dense and tall vegetation close to the road will trap pollutants and diminish their spread away from the road (Folkeson, 2005). Upon decay of the plant litter, the pollutants trapped or taken up by the shoots will enter the soil and contribute to pollutant accumulation in the roadside ecosystem. If the mown vegetation is collected, pollutants in the cut material will be exported from the roadside ecosystem. Increasingly, around the world, especially in parts of Europe, the USA and Australasia, vegetated swales (Fig. 1.10) at the side of roads are being deliberately employed as a part of the environmental management of the highway runoff water. They aim to reduce the quantity and improve the quality of runoff that enters groundwater (see also Chapter 12, e. g. Fletcher et al., 2002).

In countries where chemical vegetation control is still not banned, herbicides are directly released into the roadside environment. Unless rapidly degraded into less harmful substances, these toxins may contribute to groundwater or surface-water contamination.

Ditch clearing involves the handling of soils that can be heavily polluted with organic pollutants and heavy metals. Displacement of the material to the outer slope will lead to the accumulation of pollutants in the road area and eventually to the leaching of, e. g., heavy metals to the groundwater or surface water bodies. Where rehabilitation of roads is planned, any spreading of pollutants having accumulated in the road body or the roadside should be avoided.

Road-runoff water carries large amounts of pollutants away from the road sur­face. The amounts so transported vary greatly depending on a range of factors, the most important being traffic volume and characteristics and amount of precipitation. Pollutant concentrations in runoff have been widely studied. Concentration ranges commonly reported are collected in Table 6.3.

Care must be taken both in road design and in road operation so as to avoid con­tamination of surface waters and the groundwater. The Water Framework Directive aims at securing good quality in all natural waters, not only where sensitive aquifers or drinking-water abstraction points could be at risk (see Section 6.5 below). Some national road authorities have handbooks for the treatment of highway runoff, e. g. Sweden (Vagdagvatten, 2004).

At some places, runoff water is diverted to retention ponds or other facilities for handling of pollutants (Hvitved-Jacobsen & Yousef, 1991). Facilities for protection of the environment from pollutants should be properly maintained so as to secure the continuous effectiveness of the facility. For instance, sediments in retention ponds accumulate large amounts of pollutants and must be treated or disposed in such a way that pollutants do not enter into the environment (Hvitved-Jacobsen & Yousef, 1991; Stead-Dexter & Ward, 2004).

Country, location,

AADT

pH

Conductivity

Tot.

susp’d

Pb (M. g/l)

Zn (^g/l)

Cu (^g/l)

Cd (^g/l)

Cr(Pg/l)

publication

(^S/cm)

solids (mg/l)

min

max

min

max

min

max

min

max

min

max

min

max

min

max

min

max

USA (Thomson

116

169

et al., 1997)

USA, Texas (Barrett

8,780

91

15

44

7

et al., 1998)

47,200

19

3

24

12

58,200

129

53

222

37

Portugal, Vila Real

6,000

5.9

7.2

00

CO

184

<8

147

<1

200

<50

1,460

<1

54

(Barbosa, 1999) UK (Hares &

140,000

81

208

274

14.1

105

Ward, 1999)

120,000

70

188

248

11.9

86

UK (Moy

71,900

88.6

8.6

et al., 2002)

23,600

318

51.4

163

33.6

0.99

11.5

36,100

101

50.4

66.8

23.3

0.56

9.08

83,600

82.7

16.7

29.0

11.8

0.25

7.73

65,000

45.8

15.4

55.7

17.6

0.43

4.82

37,200

51.4

4.38

21.4

16.5

0.21

2.72

All

15.2

1,350

0.00

178

0.00

536

0.00

90.0

0.00

5.40

0.00

49.0

USA (Kayhanian

<30,000

7.0

168

1.2

35.3

6.5

1.7

et al., 2003)

>30,000

7.4

145

6.1

79.1

14.7

0.3

2.6

All

5.1

10.1

1

5,100

0.2

414

3

1,020

1

121

0.02

6.1

0.6

22

UK, Readingc

98,200

6.0

7.7

150

12,000

160

704

43

1,800

140

4,200

50

1,000

<1

13

<20

UK, Oxfordc

77,700

6.5

6.7

72

2,000

70

134

<20

54

84

200

22

55

<1

<20

Netherlands,

150,000

6.5

7.6

120

9,600

3

95

52

1,700

17

160

0

2

0

5

Nieuwegein#c

Netherlands,

90,000

5.7

7.8

90

3,500

0

88

28

290

13

61

0

3

0

20

Spaarnwoude#c Sweden, Svanebergc

7,350

6.3

7.1

30

10,000

3

18

51

220

6

70

0

0

0

2

Sweden, Norsholmc

18,000

6.2

7.7

50

33,000

4

43

92

490

12

100

0

1

2

11

Table 6.3 (continued)

116 L. Folkeson & T. B^kken

Likewise, water used for the washing of road tunnels (pavement, walls and roof) must be treated in a way that prevents the pollutants in the rinsing water from reach­ing the environment (Cordt et al., 1992; Barbosa et al., 2006).

Application of the Method during Production Control

Subsequent to the design of the recipe and its approval, it is time for the pro­duction of an SMA mix. Production control using the Dutch method takes into account the same factors that have been used during SMA design (job mix for­mula [JMF]).

The properties of some elements are naturally changeable; this particularly applies to the aggregate gradation, particle shape, and resistance to crushing.

As noted earlier, designing an SMA using the Dutch method is based on optimiz­ing the coarse-aggregate content in order to obtain the selected air void content in compacted samples of the SMA. So if the gradation of the supplied coarse aggregate changes during production of the SMA in an asphalt plant, then the SMA volumet­ric parameters change accordingly. Therefore the factory production control (FPC) should include examining the amount of air voids in the coarse aggregate fraction as used in the SMA design. Each new delivery of coarse aggregates should undergo such tests. The results should be compared with corresponding results of testing the materials used in the SMA design. If the difference in the air void volume is greater than 1.5% (v/v), an adjustment must be made to the design in accordance with the principles put forward in Figure 7.15.

How can we make good use of Figure 7.15? Let us fix the following values of a mix: [44]

image77

FIGURE 7.15 Graph showing the relationship between the contents of coarse aggregate fractions and air voids applied to the adjustments of mixes when producing SMAs. Note: FRs = Filling ratio stone skeleton. (From Voskuilen, J. L.M., Jacobs, M. M.J., and van Bochove, G. G., Proceedings of the 3rd Eurasphalt & Eurobitume Congress Vienna 2004— Paper 326, 1802. With permission.)

Let us assume that the properties of new deliveries of aggregates have altered slightly and are marked by a different content of air voids. To maintain the fixed volumetric relationships in the mix under these circumstances, the content of the coarse-aggre­gate fraction in the SMA design must be changed. Thus we test the new delivery of the coarse-aggregate fraction in a gyratory compactor,* being sure to test not only one single fraction but the entire newly composed material larger than 2 mm. Let us examine two different types of results of this testing:

• Case 1: the content of air voids in the new compacted coarse-aggregate fraction amounts to 34.7% (v/v) (i. e., 2% [v/v] less than in the design).

• Case 2: the content of air voids in the new compacted coarse-aggregate fraction amounts to 38.7% (v/v) (i. e., 2% [v/v] more than in the design).

Whether we deal with the Case 1 or Case 2, the air voids should equal 5% (v/v) of the SMA mix. So let us have a look at Figure 7.15. We can read the instructions on how the content of coarse aggregate fraction in the aggregate mix should be adjusted for the given contents (34.7% and 38.7%) of air voids in the coarse aggregate frac­tions and air voids in SMA (5.0%). Consequently we find: [45]

• Case 1: the content of air voids in the compacted chipping fraction amounts to 34.7% (v/v), so the coarse aggregate content should be increased to approximately 79.5% (m/m).

• Case 2: the content of air voids in the compacted chipping fraction amounts to 38.7% (v/v), so the coarse aggregate content should be decreased to approximately 76.5% (m/m).

Adjustments to the mix make sense. If there are fewer air voids in the coarse aggregate fraction (particles are packed better in a volume unit), it is necessary to increase the coarse aggregate content (“to open” the mix) in order to retain the 5% of air voids in the SMA. If the coarse aggregate mix is more open after compaction than during design, the quantity in the mix should be reduced (it is necessary “to close” the mix). As we can see, this is the same principle that may be applied to adjust two fillers with different contents of air voids according to Rigden.

Procuring the Timbers

W

HEN I WAS A YOUNG MASONS LABORER IN SCOTLAND BACK IN THE 1970 S, master stone mason Hughie Mathieson would say to me, “You cannae build without the stones, Robbie, you cannae build without the stones!” It was his way of telling me to get the lead out and provide him with more building stones on his scaffold.

With timber framing, you cannae build without the timbers! Now, where are they going to come from?

Recycled Timbers

Years ago, there used to be more old timber frame barns available for salvage than there are now. Jaki and 1 used lots of recycled barn beams at Log End Cottage, Log End Cave, and Earthwood. But, recently, a large barn became available. We heard about it through a friend. As Jaki and I didn’t need timbers at the moment, and a young neighbor did, we put him onto this resource.

But even though the number of available barns has diminished, the use of recycled timbers is still a good strategy. Listen to Jim Juczak, who built a huge 18- sided timber-frame home (with cordwood infilling) near Watertown, New York:

The post and beam frame of our home is made out of recycled beams from a large bowling alley that was being demolished within six miles of our site. 1 asked the destruction foreman if I could get the wood from the ioo-foot curved trusses that were being removed. I got ten of the huge trusses, 400 sheets of used %-inch roofing plywood and about 500 pieces of 2- by 12-inch by 21-foot (6.4-meter) framing lumber. Our cost was $10,000 for what I estimated to be over $50,000 worth of materials. Disassembling the trusses, denailing the lumber, and deroofing the plywood took the better part of a summer. The curved pieces became roof rafters, the straight laminated pieces

became the eighteen vertical posts in the outside wall and the four-by material became the radial floor joists for the second floor. The first floor was radially framed with the two-by-twelve-inch material and covered with two layers of recycled plywood.

Now, $10,000 may seem like a lot, but it supplied virtually all the structural, roof sheathing and flooring materials for a beautiful 3,000 square foot home. As Jim is skilled at scrounging materials like windows, doors, and even plumbing fixtures, the total cost of the home was only about $30,000 or $10 per square foot. Jim tells the full story of this project, with pictures, in my previous book Cordwood Masonry: The State of the Art.

Jim also gives a warning: “Unfortunately, getting all this great stuff into one place can be a detriment. Last June, someone with a housing need greater than my own felt compelled to ‘borrow, without permission,’ a tractor trailer load of salvaged construction lumber from our home site.”

There are people in the salvage business who make a good living by tearing down old warehouses and the like, and selling the materials. In February of 2003, I had a lengthy and informative phone chat with my friend Bob Samuelson, a very successful dealer in recycled materials in the Chicago area. Bob built a io, ooo-square-foot lodge in Wisconsin with huge timbers salvaged from Chicago warehouses that needed to come down. The walls are made from sixteen-by – sixteen-inch timbers, laid like logs. Internal posts are huge. Roof rafters are six – by-tens. Bob’s comments were encouraging.

“Any city, small or major, has a demolition contractor, maybe several,” Bob told me, “and there are plenty of timber frame materials being salvaged all the time. Also, more and more laminated timbers are becoming available. Use the internet or the Yellow Pages to find these contractors. And it’s okay to gently bug them. They’re nice people. If they see that you are trying to do something good for yourself, they will bend over backwards to help. There are around 3,000 demo projects a year, just in Chicago, but it’s a small network and everyone knows everyone else. One person may not have what you want, but there’s a good chance that they know someone who does.”

Some demolition contractors may have recycled materials available, even old hewn timbers, but they are likely to charge a pretty penny for them, as they are in demand as atmospheric pieces in new restaurants and upscale homes. Bob says that Bill Gates of Microsoft fame used mostly recycled timbers on his big expensive house. You can’t blame people for charging what the market will bear; they’ve gone to the trouble of doing the salvage work and need to be reimbursed for their time and effort. But, many of these contractors make their money from the actual demolition, not by selling the materials. They haven’t got storage space to keep up with the rate of teardown. Bob tells me that with landfill charges of $400 to $600 a load, contractors are happy to find a cheaper way to get rid of materials, like bring them to you, for example. “You’re helping them to clean their site,” says Bob.

“Materials can be expensive or cheap and so can haulage, so shop around,” Bob advises. “If you’re not too far from the demolition site, the contractor might deliver to you fairly cheap, but if you are some distance away — say 250 miles or so from the site — expect to pay $400 to $500 for a semi load as a reasonable haulage charge.”

Bob likes to speak in large units: “semi loads.” A semi is a tractor-trailer unit, with, perhaps, a 50-foot (15.2-meter) flatbed trailer. Such a vehicle can carry up to 24 tons, which could be 12,000 to 15,000 board feet of lumber, depending on the density of the wood. This is enough lumber to frame — and complete — a good – sized home.

Bob had some other good tips. He mentioned that utility companies often have old cedar poles that they have replaced with new pressure-treated poles. Often times, only the large butt end (the part that went into the ground) was treated, usually with creosote. The rest of the pole might be in excellent condition and quite suitable for a viga-type rafter system, or tie beams, or internal posts. You can even flatten one or more sides, if you are careful to check the whole piece over for nails and spikes. A metal detector works well for this.

Summing up his commentary on salvaged material, Bob told me, “It’s still there. Old buildings with great materials are coming up all the time, sometimes with virgin growth lumber you can’t even get new.”

For a bargain on recycled timbers, you are going to have to do some legwork (see Cultivating Coincidence below) or make the effort to find the old buildings and tear them down yourself, a strategy better suited for rural areas.

Tearing down old buildings is a lot more dangerous than building a new one. Heavy timbers can fall on you, and they don’t shout a warning first. You can step on rusty nails, get poison ivy, or tangle with nasty dogs.

This is a book about building, not demolition, which is a whole different kettle of fish. The safest way to tear down an old barn, particularly one which is

Traffic and Cargo

Road traffic and cargo produce a range of compounds that pollute the environment. Corrosion of vehicle compartments is a source of heavy metals. Tyre wear gives rise to particles containing zinc, cadmium and iron (literature cited by Fergusson, 1990 [p. 420]; Landner & Lindestrom, 1998; Sarkar, 2002). Brake pads and brake linings emit copper, zinc and lead (Weckwerth, 2001). Fuel, fuel additives and lubricants are sources of hydrocarbons. Lead (Pb) is no longer allowed in the EU states but in countries where leaded petrol is still used, e. g. many African countries, this metal is emitted in the exhausts. Wear of catalytic converters gives rise to emission of plat­inum, palladium and rhodium, though in minor amounts. Spills and littering from cargoes also release a wide range of contaminants. Car-polish and windscreen clean­ing agents give rise to the spread of organic detergents. Snow banks along roads ac­cumulate the pollutants over time and may become highly polluted. Through petrol and diesel spillages and other contamination, petrol-filling stations, often situated adjacent to roads, continuously contribute a range of contaminants, notably organic compounds from petrol products, to road runoff and the road environment.

6.2.1 Pavement and Embankment Materials

Pavement and embankment materials can be sources of contaminants that reach the environment either through leaching, runoff transport or aerial transport. The amount reaching the environment varies to a great extent with the type of material used in the various layers, the type, condition and wear resistance of the surface layer, the influence of water and traffic, and a range of other factors.

Pollutant leaching from modern types of bitumen used in asphalt pavements is usually low (Lindgren, 1998). As a substitute for or compliment to natural aggre­gates, various kinds of secondary materials may be used in road constructions. Some of the most commonly used secondary or manufactured materials include:

• crushed asphalt, concrete and brick (from old road pavements and demolished buildings);

• rock or soil associated with mining activities;

• by-products from metallurgical processes, such as slag;

• pulverised and bottom fuel ash – particularly “fly ash” from coal burning elec­tricity generation; and

• other industrial by-products such as bottom ash from municipal solid waste in­cineration.

The re-use of materials can be considered advantageous from a natural resource – management point of view. The content of hazardous compounds must, however, be considered. A range of heavy metals and other pollutants such as oil and or­ganic micro-contaminants (e. g. PAH, PCB) may be contained in such alternative materials. The concentrations and leaching ability vary greatly between materials and should be tested to ascertain feasibility for road-construction usage (Baldwin et al., 1997; Lindgren, 1998; Apul et al., 2003; Hill, 2004; Olsson, 2005; Dawson et al., 2006).

Pollutant leaching from road-construction materials containing potentially harm­ful chemicals has been subject to a Czech field study (Jandova, 2006). Water seeping down from the road surface through the pavement and embankment was collected 1.5 m beneath the road surface using the device described in Chapter 7 (Section 7.4.5 and Fig. 7.8), having passed through a pavement foundation formed of slag. The data of Legret et al. (2005), for water having passed through an asphalt containing recycled components, are given for comparison in Table 6.2. Significant PAH concentrations in the soil beneath the asphalt were observed also by Sadler et al. (1999) due to water entering the environment through leaching from asphalt surfaces. Results from leaching tests on standard hot-mix asphalt have been reported by Kriech (1990, 1991). Except for naphthalene, all PAH were below the detection limits. The same fact was observed for metals – only chromium was found in con­centrations above the detection limit. Legret et al. (2005) analysed percolating water through two core samples containing 10% and 20% of reclaimed asphalt pavement. They also described leaching of selected heavy metals and PAH from reclaimed

Table 6.2 Leaching of pollutants from road construction materials containing recycled materials

Chemical characterization (pg/l except pH)

Jandova(2006) Slag under asphalt

Legret et al. (2005)

10% recycling

20% recycling

pH

6.99

6.9

6.9

Cu

9.8

20

21

Cr

14.9

5

8

Cd

<0.1

1.6

1.0

Ni

30.7

11

11

Zn

16.0

250

317

Pb

4.3

BDL

BDL

Anthracene

0.0001

BDL

BDL

Benzo(a)anthracene

0.0004

Benzo(a)pyrene

0.0012

BDL

BDL

Benzo(b)fluoranthene

0.0006

BDL

BDL

Benzo(ghi)perylene

0.0005

BDL

BDL

Benzo(k)fluoranthene

0.0009

BDL

BDL

Dibenzo(ah)anthracene

0.0001

BDL

BDL

Fluoranthene

0.0021

0.035

0.035

Indeno(123cd)pyrene

0.0007

BDL

BDL

Naphthalene

0.0006

Phenanthrene

0.0008

Pyrene

0.0019

Chrysene

0.0008

Acenaphthylene

0.0001

Acenaphthene

0.0002

Fluorene

0.0003

BDL = below detection limit; – = not analysed.

asphalt pavement in samples from an experimental site that were tested in both static batch tests and column leaching tests.

Where allowed, the use of studded tyres causes substantial pavement wear, typ­ically in the range of 2-10 g/km/vehicle for modern pavements of high quality (Jacobson, 2005). The wear is higher from pavements of lower quality. Pave­ment wear results in high aerial concentrations of particles. Onto these parti­cles, other pollutants such as heavy metals become adsorbed (Dahl et al., 2006; Lindbom et al., 2006). Aggregates of different mineralogical origin vary in their heavy-metal content. Granite/gneissic aggregates, e. g., have been shown to contain higher concentrations of heavy metals than does porphyry (Lindgren, 1996). This concentration difference in combination with lower resistance of granite/gneiss to studded-tyre wear results in higher release of Cu, Cr and Zn from this type of aggregate than from porphyry (Lindgren, 1996). The build-up of tyre-generated pavement-wear dust on the street surface and along streets during the winter often results in greatly elevated aerial particle concentrations during dry winter and spring days (Gustafsson, 2002). Dust generation from the unbound surface layers of gravel roads is a well-known problem (Oscarsson, 2007).

SUPPORTING A VENT SYSTEM

Подпись: ✓ fast code fact If a vent is run up the outside wall of a building and is exposed to weather, the pipe must be protected from freezing. One way of doing this that is generally accepted is to enlarge the diameter of the vent to prevent condensation from freezing and ultimately sealing the vent pipe with ice.

SUPPORTING A VENT SYSTEM Подпись: Support material Maximum distance between supports (ft)

Supporting a vent system is another element of a system design. The spac­ing allowed for support varies from code to code and with the type of pipe being used in the vent system. The tables below will show you some examples of recommended minimums for support spacing.

SUPPORTING A VENT SYSTEM
Подпись: Lead pipe Cast iron Galvanized Copper PVC ABS Подпись: Type of vent pipe Maximum distance between supports

FIGURE 5.38 ■ Horizontal pipe-support intervals in Zone Two. [Courtesy of McGraw-Hill)

FIGURE 5.39 ■ Vertical pipe-support intervals in Zone One. [Courtesy of McGraw-Hill)

SUPPORTING A VENT SYSTEM

Type of vent pipe Maximum distance between supports (ft)


ABS

Cast iron

Galvanized

PVC

Copper (2 in and larger) Copper (ІУ2 in and smaller)


SUPPORTING A VENT SYSTEM

Maximum distance between supports (ft)


Lead pipe

4

Cast iron

At each storyt

Galvanized

At each storyt

Copper (ІУ4 in)

4

Copper (ІУ2 in and larger)

At each story

PVC (ІУ2 in and smaller)

4

PVC (2 in and larger)

At each story

ABS (1У2 in and smaller)

4

ABS (2 in and larger)

At each story

Type of vent pipe

*A11 stacks must be supported at their bases. tSupport intervals may not exceed 15 ft. tSupport intervals may not exceed 30 ft.

SUPPORTING A VENT SYSTEM

FIGURE 5.41 ■ Vertical pipe-support intervals in Zone Two. (Courtesy of McGraw-Hill)

Подпись: Type of vent pipe Maximum distance between supports (ft)

FIGURE 5.42 ■ Horizontal pipe-support intervals in Zone Three. (Courtesy of McGraw-Hill)

Lead pipe

4

Cast iron

15

Galvanized

15

Copper tubing

10

ABS

4

PVC

4

Brass

10

Aluminum

15

SUPPORTING A VENT SYSTEM

SUPPORTING A VENT SYSTEM

Подпись: ► sensible shortcutПодпись: A rule of thumb for hanger spacing when working with plastic vent piping is to support the pipe at intervals that do not exceed four feet from the center of one support to the center of the next support.

Cantilever

A cantilever, as in Fig. 2.4, can be thought of as an upside down beam, supported at just one end. It is “upside down” in the sense that its top surface is in tension while its bottom surface is in compression. Note that the unsupported part of the cantilever tends to impart the same kind of upside-down stresses as the supported part. I think of it as being a bit like a first-class lever: the downward pressure of

the overhanging load pivots at the wall (which acts like a fulcrum) and causes an uplifting pressure on the supported portion.

Подпись: building to exceed the one-thirdimage25During my researches, I have found writers (some of them engineers) who say that the over-hanging part should be one-third of the supported apart. Others say 40 percent. Some say 50 percent is the absolute limit. Let us think of these numbers as parameters. Personally, I see no reason in house-
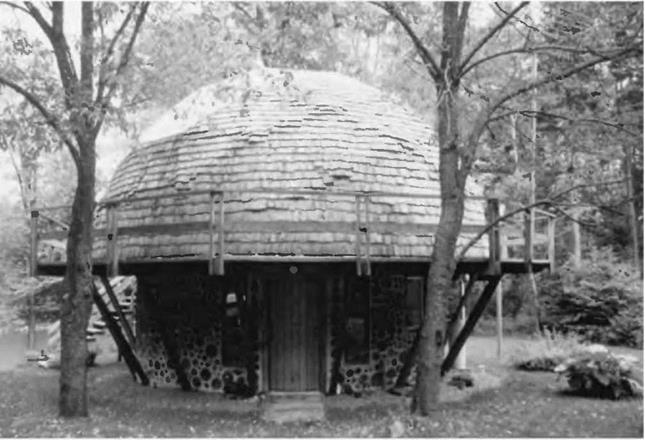
recommendation, and if there is a large load on the cantilever, I’d either Fig. 2.14: The Mushwood Cottage. consult a structural engineer or avoid the cantilever altogether.

At Mushwood, our summer cottage (Fig. 2.14), the second-story 29-foot (8.8- meter) diameter geodesic dome is supported by 16 radial four-by-eight joists, which, in turn, are supported by a 22-foot (6.7-meter) diameter cordwood masonry first story and a large post at the center of the building. The overhang of the dome by itself is 3V2 feet (1 meter) beyond the outside edge of the cordwood wall, and the supported portion of the joist is 11 feet (3.35 meters). Dividing 3.5 by 11 gives 31.8 percent—not too bad at all, it would seem, but really it is not very good, as the dome is applying a concentrated load to the end of the cantilever.

In the case of a concentrated load, an overhang of 25 percent should be thought of as the limit (Clark, 1966, p. 189). However, Jaki and I wanted a three – foot walkway all around the deck, also to be supported by the radial rafters. Snow sliding off the dome accumulates on this deck, a heavy distributed load. If a lot of snow slides off the dome at once, we re looking at an impact load. Adding the 3-foot deck to the зї/2-foot dome overhang, we have a total cantilever of 6V2 feet (1.98 meters). The supported portion of the joist is still 11 feet. The new relationship is 6.5/11 = 59 percent, which exceeds anyone’s rule of cantilever by quite a bit.

We attended to the problem by installing sixteen diagonal supports, which carry the line of thrust from the dome through the diagonals (which are in compression) to the floating slab foundation that supports the cordwood

Cantileverimage26

Fig. 2.16: The principal members of this basic bent framing plan are the Posts, Tie Beam, and Rafters. The secondary members are the Interior Posts, Queen Posts, and Collar Tie. The secondary members are necessary only when bent spans exceed the structural limitations of any of the principal members. Braces are required to make this a rigid structural framework. These joints are made with fine crafted joinery, but such a bent could be constructed using mechanical fasteners and then raised into place. The drawing is by Steve Chappell, author of The Timber Framer’s Workshop (Fox Maple Press, 1999), and is used with permission.

image30

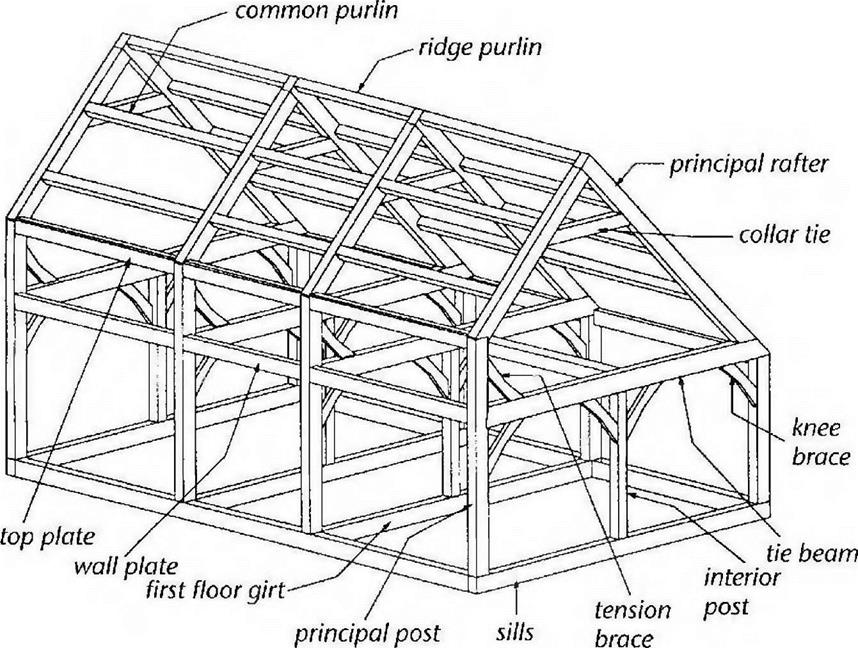
Fig. 2.18: Parts of a traditional timber frame. This drawing is only intended to illustrate framing members. Other authors and timber framers might use slightly different terminology for some of the components. Drawing by Steve Chappell and used with permission.


bent as “a transverse structural frame-work.” Jack Sobon, author of Build a Classic Timber-Framed House (see Bibliography) describes a bent as “an assemblage of timber-frame components that can be put together lying flat and then reared up into position.” He adds that bents are usually cross-frames, but adds that they can also be longitudinal wall frames.

There are no bents at our garage, in the sense of transverse frameworks, although the gable ends could have been built flat on the concrete slab and tilted up into position. The longitudinal sidewall framework could have been built that way, too. In the actual event, posts were simply stood up, individually fastened to the slab as described in Chapters 4 and 5, and the girts heaved into place and fastened together with connectors.

Fig. 2.16 shows a typical bent for a traditional timber frame. The installation of the top portion of such a bent is shown in Fig. 2.17. Four such transverse bents

Подпись: 10'8

image31

Fig. 2.19, above: Framing plan for Log End Sauna, Fig. 2.20, below: West elevation, Log End Sauna.


(two internal and one at each gable end) would be the major framework for a structure such as the one shown in Fig. 2.18, except that the upstairs of the frame in Fig. 2.18 is a little different; it is a saltbox design instead of the more common gable roof like Figures 2.16 and 2.17.

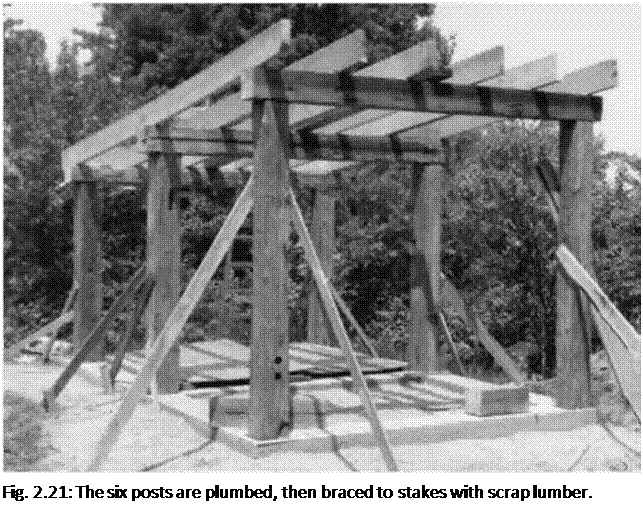
Подпись: Fig. 2.21: The six posts are plumbed, then braced to stakes with scrap lumber. You could put a plank-and-beam roof on the lower frame of a building like our garage, but we chose pre­made engineered roof trusses to support our shingled roof. The convenience, economy, and strength characteristics of pre-built engineered trusses cannot be over-emphasized, and I will speak more of them in Chapter 4.

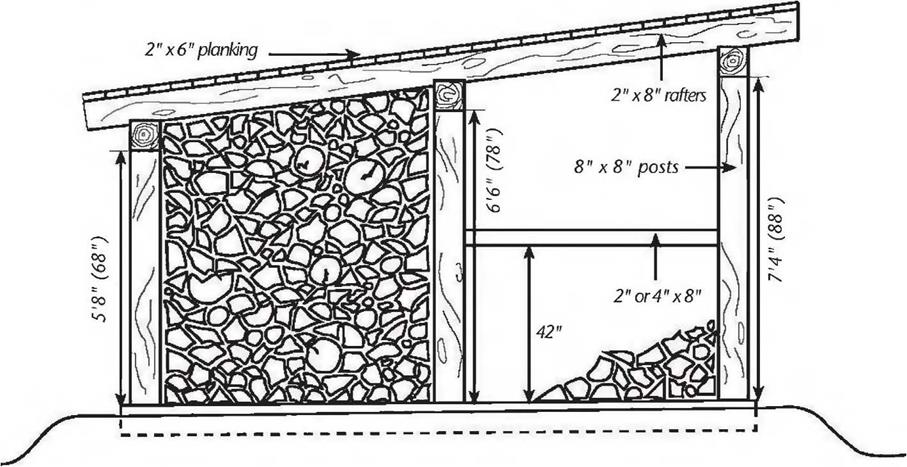
There are as many timber frame plans as there are buildings. At one end of the scale, our little cordwood sauna design consists of just 6 major posts, 3 girders, and 6 long rafters, as per Figures 2.19, 2.20 and 2.21. At the other end of the scale are houses of 3,000 square feet and more.

You can design your own structure based on the design principles in this chapter, keeping in mind the various fastening techniques described in Chapters 4 and 5. Unless you are very confident of your own engineering capabilities — or are using a tried and proven plan — you should have a structural engineer check your plans. This is a lot less expensive than going to an engineer and saying, “Please design me a timber frame for this floor plan and such-and-such a snow load.”

In New York State, any home of 1,500 square feet or greater must carry either an architect’s or an engineer’s stamp to get a building permit. (This takes the onus of responsibility off of the local building inspector.) Ki Light, a neighbor of mine, drew the plans for his post-and-beam house (with straw bale infilling) and took them to a local engineer to see if he could get his plans stamped. Ki and his wife spent a couple of hours with the man, and spoke of things like rafter frequency and span. “It took a while to explain straw bale construction to him,” Ki told me, “but, as we’d be laying up the straw bales within a heavy post-and-beam frame, he
was okay with it.” The meeting cost the Lights $100. They received some good advice, and the engineer stamped their plans. In a couple of days they had their permit.

Another strategy that has worked well for some is to bring your seat-of-the – pants structural drawings to a college engineering class and have the class check and critique the plans… under the guidance of the professor, of course!

Finally, there are two sections in Chapter 4: Building Techniques, which also contribute to an understanding of structure. They are Build Quality, Gravity and Inertia, beginning on page 87, and Roof Systems beginning on page 88. I have put them there because they cover building techniques more than structure. But they are important enough to read now, and then again when you get to Chapter 4.

Now, you will need to know where you are going to get your timbers.

Tools

My tools are pictured on the facing page. They are pretty much all I have needed to build a dozen small houses. Folks I’ve worked with tell me I’m a fool for not using a table saw, too. You might want to add one to your list.

1. skill saw, 2. jig saw, 3. plyers, 4. files, 5. miter saw, 6. hammer, 7. wrench, 8.goggles, 9. tape measure, 10. drill & drill bits, 11. pencil, 12. box cutter, 13. level, 14. chisel.

image40

Selection of Distribution Model

Based on a given sample of finite observations, procedures are needed to help identify the underlying distribution from which the random samples are drawn. Several statistical goodness-of-fit procedures have been developed (D’Agostino and Stephens, 1986). The insensitivity to the tail portion of the distribution of the conventional chi-square test and Kolmogorov-Smirnov test has been well known. Other more powerful goodness-of-fit criteria such as the probability plot correlation coefficient (Filliben, 1975) have been investigated and advocated (Vogel and McMartin, 1991). This and other criteria are described herein.

3.7.1 Probability plot correlation coefficients

Подпись: PPCC = Подпись: X^m=1(x(m) x)(ym y) [£ m=1( x(m) — x)2£ m=1( ym — y)2]0'5 Подпись: (3.17)

The probability plot is a graphic representation of the mth-order statistic of the sample x(m) as a function of a plotting-position F (x(m)). For each order statistic X(m), a plotting-position formula can be applied to estimate its corresponding nonexceedance probability F (X(m>), which, in turn, is used to compute the corre­sponding quantile Ym = G—1[F(X(m>)] according to the distribution model G( ) under consideration. Based on a sample with n observations, the probability plot correlation coefficient (PPCC) then can be defined mathematically as

where ym is the quantile value corresponding to F (x(m)) from a selected plotting – position formula and an assumed distribution model G(-), that is, ym = G-1 [F (x(m))]. It is intuitively understandable that if the samples to be tested are actually generated from the hypothesized distribution model G( ), the corre­sponding plot of X(m) versus ym would be close to linear. The values of F (x(m>) for calculating ym in Eq. (3.17) can be determined by using either a probability – or quantile-unbiased plotting-position formula. The hypothesized distribution model G( ) that yields the highest value of the PPCC should be chosen.

Critical values of the PPCCs associated with different levels of significance for various distributions have been developed. They include normal and lognormal distribution (Fillben, 1975; Looney and Gulledge, 1985; Vogel, 1986), Gumbel distribution (Vogel, 1986), uniform and Weibull distributions (Vogel and Kroll, 1989), generalized extreme-value distribution (Chowdhury et al., 1991), Pear­son type 3 distribution (Vogel and McMartin, 1991), and other distributions (D’Agostino and Stephens, 1986). A distribution is accepted as the underlying random mechanism with a specified significance level if the computed PPCC is larger than the critical value for that distribution.

3.7.2 Model reliability indices

Based on the observed (X(m>} and the computed {ym}, the degree of goodness of fit also can be measured by two reliability indices proposed by Leggett and Williams (1981). They are the geometric reliability index KG,

Подпись: KG =Подпись: 1 (ym/xjm)) 1 +( ym/x(m)) Подпись: 1 (ym/xjm)) 1 +( ym/x(m)) Selection of Distribution Model(3.18)

Подпись: KS = exp Selection of Distribution Model Selection of Distribution Model Подпись: (3.19)

and the statistical reliability index KS,

When the computed series {ym} perfectly matches with the observed sequence {x(m)}, the values of KG and KS reach their lower bound of 1.0. As the discrep­ancy between {x(m)} and {ym} increases, the values of KG and KS increase. Again, for each of KG and KS, two different values can be computed, each associated with the use of probability-unbiased and quantile-unbiased plotting-position formulas. The most suitable probability model is the one that is associated with the smallest value of the reliability index.

3.7.3 Moment-ratio diagrams

Relationships between product moments and the parameters of various distri­butions are shown in Table 3.4, which also can be found elsewhere (Patel et al., 1976; Stedinger et al., 1993). Similarly, the product-moment ratio diagram
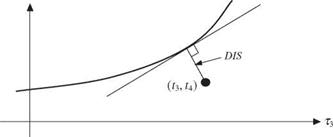
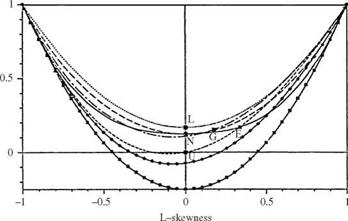
based on skewness coefficient and kurtosis (Stuart and Ord, 1987, p. 211) can be used to identify the distributions. When sample data are used, sample prod­uct moments are used to solve for the model parameters. However, owing to the low reliability of sample skewness coefficient and kurtosis, use of the product – moment ratio diagram for model identification is not reliable. Alternatively, the L-moment ratio diagram defined in the (r3, r4)-space (Fig. 3.3) also can be used for model identification. Namely, one can judge the closeness of the sam­ple L-skewness coefficient and L-kurtosis with respect to the theoretical r3 – r4 curve associated with different distribution models. Some types of distance mea­sures can be computed between the sample point of (t3, t4) and each theoretical т3 – t4 curve. One commonly used distance measure is to compute the shortest distance or distance in L-kurtosis direction fixed at the sample L-skewness coefficient (Pandey et al., 2001). Although it is computationally simple, the

Selection of Distribution Model

£


E Exponential G Gumbel L Logistic N Normal U Uniform


Generalized logistic _ _ Lower bound

Generalized extreme-value for wakeby Generalized pareto

Lognormal.. Lower bound for

Gamma all distributions


T4

Selection of Distribution Model

Figure 3.3 L-moment ratio diagram and shortest distance from a sample point.


Selection of Distribution Model

distance measure could not account for the sampling error in the sample L – skewness coefficient. To consider the effect of sampling errors in both the sam­ple L-skewness coefficient and L-kurtosis, the shortest distance between the sample point (t3, t4) and the theoretical r3 – r4 curve of each candidate distribu­tion model is computed for the measure of goodness of fit. The computation of the shortest distance requires locating a point on the theoretical т3 – t4 curve that minimizes the distance as

DIS = min J(t3 – T3)2 + [t4 – t4(t3)]2 (3.20)

T3

Since the theoretical t3 – t4 curve for a specified distribution is unique, determination of the shortest distance was accomplished by an appropriate one­dimensional search technique such as the golden-section procedure or others.

Example 3.7 (Goodness of Fit) Referring to the flood data given in Example 3.3, calculate the values of the probability-unbiased PPCCs and the two reliability indices with respect to the generalized Pareto distribution (GPA).

Solution Referring to Table 3.4, the GPA quantile can be obtained easily as

x(F) = § + в [1 – (1 – F )a]

a

According to the model parameter values obtained from Example 3.6, that is, a = 1.154, в = 361.36, § = 314.64, the GPA quantile can be computed as

x(F) = 314.64 + 36136 [1 – (1 – F)L154]

Using the probability-unbiased plotting position, i. e., the Weibull formula, the cor­responding GPA quantiles are calculated and shown in column (4) of the following table. From data in columns (2) and (4), the correlation coefficient can be obtained as 0.9843.

To calculate the two-model reliability indices, the ratios of GPA quantiles ym to the order flow q(m) are calculated in column (5) and are used in Eqs. (3.18) and (3.19) for Kg and Ks, respectively, as 1.035 and 1.015.

Rank (m) (1)

Ordered q(m) (2)

F (q(m)) = m/(n + 1) (3)

Ут

(4)

ym/q(m)

(5)

1

342

0.0625

337.1

0.985714

2

374

0.1250

359.4

0.960853

3

390

0.1875

381.4

0.977846

4

414

0.2500

403.1

0.973676

5

416

0.3125

424.6

1.020591

6

447

0.3750

445.7

0.997162

7

505

0.4375

466.6

0.923907

8

505

0.5000

487.1

0.964476

9

507

0.5625

507.2

1.000308

10

524

0.6250

526.8

1.005368

11

533

0.6875

546.0

1.024334

12

543

0.7500

564.5

1.039672

13

549

0.8125

582.4

1.060849

14

591

0.8750

599.4

1.014146

15

596

0.9375

615.0

1.031891

3.7.4 Summary

As the rule for selecting a single distribution model, the PPCC-based criterion would choose the model with highest values, whereas the other two criteria (i. e., reliability index and DIS) would select a distribution model with the smallest value. In practice, it is not uncommon to encounter a case where the values of the adopted goodness-of-fit criterion for different distributions are compatible, and selection of a best distribution may not necessarily be the best course of action, especially in the presence of sampling errors. The selection of acceptable distributions based on the their statistical plausibility through hypothesis test­ing, at the present stage, can only be done for the PPCCs for which extensive experiments have been done to define critical values under various significance levels (or type I errors) and different distributions.

SELECTION OF MATERIALS FOR MAIN SUPERSTRUCTURE MEMBERS

For the primary superstructure members of a bridge (not including the deck), concrete (reinforced and prestressed) and structural steel are the principal candidates. Concrete and steel both have desirable attributes and shortcomings as bridge materials. In general, bridges of both materials can be designed, constructed, and maintained to ensure long life.

Claims of both steel and concrete industry associations, including references to national bridge inventory data used to support contentions of superiority of one material over the other, must be critically considered. One can find examples of both concrete and steel bridges that are old and in good condition, and conversely, relatively new and in poor condition. The trade associations do a service in countering each other’s claims.

Some advantages of concrete bridges are

• They do not require painting.

• They do not rust (but are susceptible to rebar corrosion).

• They can be formed to the desired shape (if of reinforced concrete).

• If of prestressed concrete, they may be fabricated more quickly than steel, although in some emergencies steel replacement structures have been fabricated and erected as quickly as prestressed members.

• They are not susceptible to fatigue failure (to date).

Some advantages of steel bridges are

• Lighter weight permits smaller cranes for erection.

• Lighter weight permits reduction of substructure size, number of piles, etc.

• They are more readily dismantled and reused at the same or another site.

• Use of conventional erection and construction techniques may avoid construction cost overruns and litigation sometimes experienced with segmental concrete.

• Attachments to bridge are readily made by bolting or welding.

• Components are accessible and visible for inspection.

• Members damaged by vehicular collision may be more easily repaired than con­crete members.

For short – to medium-span bridges, the selection of material will depend on which bridge type and material are the most economical for the particular site. This may be known by experience with bids received over a period of time, or can be determined by taking alternative bids on projects.

Long-span bridges are often designed in both steel and concrete, or in different framing systems of the same material, so that contractors bidding on both sets of plans can make the determination of which is less costly. An increasingly common practice for bridges of all sizes is to allow the contractor to submit alternative designs, which must be designed by professional engineers and conform to the requirements of the owner.