Summary of the Method

The determination of air voids based on compacted Marshall samples has been regarded in the Netherlands as the weakest point of the Dutch method of design. According to many engineers, these samples do not reflect the true arrangement of coarse aggregate particles in real pavement. Under real-world conditions, displacement of grains and their close arrangement occur as a result of the high temperature of the pavement and post-compaction; this may be followed by the reduction of air voids among the par­ticles that create the skeleton. Then a significant decrease of air voids in the pavement can result, right up to a complete filling-up with mastic. Subsequently, with a lack of space between the coarse aggregates, they may be shoved aside; the loss of interpar­ticle contact and a bleeding of the mastic onto the surface of a wearing course may occur. Because of that, among other considerations, SMA for heavy traffic is designed with air voids amounting to 5% in the Netherlands, not 3- 4% as in other countries.

Factory or production control adopting the principles depicted in Figure 7.15 appears to be an interesting solution; however, it necessitates the determination of relationships shown there at the design stage, which appears to be a rather time-con­suming procedure. Such activities in a laboratory are reasonable provided that there is a putative guarantee of using aggregates of the same origin over the course of at least one season—that is, an unchanged SMA design will be used for a long period. Then one could afford to carry out such thorough tests. The FPC system requires a new series of tests in case of a change of an aggregate supplier.

The aforementioned method outlined in Section 7.4 describes the state of SMA design in the Netherlands in 2004. A series of research studies were conducted there in 2004-2006, leading to a change in the design procedure. Consequently the pro­cess of design was simplified in 2007. The new cycle of SMA design is as follows: [46]

• Calculate the FRs ratio.

• Calculate an actual SMA void content based on an additional corrective factor (shift factor), which denotes the relationship between the expected and actual SMA void contents.

• Assess an analyzed SMA composition based on the results of the actual air void content, adjust composition if necessary, and redo the calculations.

• Produce extra mixtures of x + 2.5% and x – 2.5% of the coarse aggregate fraction, followed by an assessment of their parameters.

About the drawings

Construction terms vary regionally, and the names for the components that frame wall openings (see 68A) are the least cast in stone. Studs called “trimmer studs” in one locality are called “jack studs” in another; and the bottom plate may go by either “bottom plate” or “sole plate.” Consult local builders and architects for common usage.

For clarity, insulation is not generally shown in the exterior walls except in the insulation section (120-125).

OPENINGS


RAKE WALLS SEE 72


CONNECTIONS WITH ROOF & CEILING SEE 132-134


LATERAL

bracing SEE 77


corners SEE 70A & D, 71


SEE 73A & В


SEE 73c & D


About the drawings

resource-efficient advanced framing

SEE 74 NOTE

IN THIS cHAPTER ALL 2×4 wALLS ARE SHOwN with studs AT 16 IN. O. c.; ALL 2×6 wALLS ARE shown with studs at 24 in. o. c..- unlabeled walls МАУ be EITHER 2X4 OR 2X6.

@ WALL FRAMING

About the drawings

OPENINGS IN A STUD WALL

About the drawings

& PROVIDES NAILING AT ALL SURFACES.


About the drawings

Подпись: 4X HEADERTYPICAL DOUBLE 2X HEADER

2×4 Bearing Wall


2×4 Bearing Wall


Подпись: DOUBLE TOP PLATEПодпись:Подпись: TRIMMER STUDПодпись: KING STUDAbout the drawingsDOUBLE (OR SINGLE) 2X10 HEADER WITH 2X4 SCABBED To Bottom

(eliminates the need for cripple studs in

Подпись:Подпись:Подпись:Подпись: TRIMMER STUDПодпись:Подпись:About the drawingsAN 8-FT. WALL)

About the drawings

2X10 HEADER

2×4 Bearing Wall


DOUBLE LVL OR LSL HEADER

2×4 Bearing Wall


Подпись: DOUBLE TOP PLATEПодпись: CRIPPLE STUDS AT SAME SPACING AS COMMON Подпись: DoUBLE FLAT 2X4 HEADERПодпись: TRIMMER STUDПодпись: KING STUDAbout the drawingsПодпись:Подпись:Подпись:About the drawingsCRIPPLE STUDS AT SAME SPACING AS common STUDS

1/2-in. cdx plywood

Подпись:
(MIN.) NAILED To oNE SIDE oF FRAMING WITH 8D CoMMoN NAILS AT 3 IN. o. C. STAGGERED 1/2 IN. To AVoiD SPLITTING FRAMING

About the drawings

OPEN-BOX PLYWOOD HEADER

2×4 Bearing Wall


DOuBLE TOP PLATE OvERLAPs at corners to lock two


DOUBLE TOP PLATE


NOTCH CRIPPLE STUDS FOR 2X HEADER.


2X HEADER AT OUTSIDE OF WALL


2-IN. OR 4-IN. SPACE at inside of HEADER for insulation


About the drawings

KING stud


2X4 CORNER


INSULATED HEADER

2×4 or 2×6 Exterior Wall


At Double Top Plate


About the drawingsAbout the drawingsAbout the drawings

About the drawings

corner studs built up with 2X4 blocking BETWEEN provides nailing at

About the drawings About the drawings

Подпись:About the drawingsПодпись: CONTINUOUS TOP PLATE OF PRIMARY WALL Подпись: COMMON STUDS IN PRIMARY WALL Подпись:Подпись:About the drawingsTOP PLATE OF INTERSECTING WALL OVERLAPS CONTINUOUS TOP PLATE OF PRIMARY WALL.

About the drawings

2X4 OR 2X6 CORNER

At Double Top Plate


INTERSECTING 2X WALLS

At Double Top Plate


Подпись: EXTRA STUD ADDED PERPENDICULAR TO CORNER STUD PROviDES NAILING AT INSIDE CORNER & ALLOWS SPACE FOR Подпись: CONTINUOUS TOP PLATE OF PRIMARY WALLПодпись:About the drawings

NAILING AND ALLOWS SPACE FOR INSULATION

TOP PLATE OF INTERSECTING WALL OvERLAPS CONTINUOUS TOP PLATE OF PRIMARY WALL

END STUD OF INTERSECTION WALL

About the drawings

INTERSECTING 2X WALLS

At Double Top Plate/Alternative Detail


A wall that extends to a sloped roof or ceiling is called a rake wall and may be built one of two ways:

Platform framing—Platform framing is commonly the method of choice when a horizontal structural element such as a floor or ceiling ties the structure together at the level of the top plate or when the top plate itself is short enough to provide the necessary lateral strength (see 72B).

Balloon framing—Balloon framing allows for ease of construction and economy of material and stabilizes a tall wall because the studs are continuous from sole plate to roof (see 72C). Balloon framing can also be employed to stiffen a wall that projects above the roof such as a parapet or railing (see 72D). Balloon framing is greatly preferred in general from a structural per­spective where lateral forces are extreme, such as in high-wind areas.

Подпись:Подпись: CEILING JOISTAbout the drawingsFor details of rake walls with truss-framed roofs, see 156.

A RAKE wall


Notes


SINGLE TOP PLATE SLOPED TO MATCH PITCH OF ROOF


FIREBLOCKING AS REQUIRED


STUD CONTINUOUS FROM SOLE PLATE


TOP SURFACE OF SLOPED TOP PLATE FLUSH WITH INSIDE CORNER OF Double TOP PLATE


NOTE

TIE CORNER

together

with

SHEATHING OR Metal STRAPS.


About the drawings About the drawings

About the drawingsAbout the drawings

Подпись:About the drawingsПодпись: BLOCKING SUPPORTS PIPING & OTHER UTILITIES WITHIN THE WALL CAVITY. IT PROVIDES A SOLID NAILING SURFACE FOR cHANGES IN MATERIAL SUCH AS WAINSCOTING & IT ALSO SUPPORTS CABINETS, PLUMBING FIXTURES, TRIM, TOWEL BARS, BALUSTRADES & oTHER ACCESSORIES THAT ARE ATTACHED TO THE FINSH SURFACE OF THE WALL. WHEN POSSIBLE, BLocKING IS APPLIED FLAT To ALLoW INSULATION AT EXTERIOR WALLS.

About the drawings

Подпись: NOTCHING BASE OF 2x6 WALL ALLOWS ELECTRICAL WIRES TO RUN WITHOUT COMPRESSING INSULATION AT CENTER OF WALL (NOT ALLOWED IN 2x4 WALL).About the drawingsrequired AT STAIRS alongside THE STRINGERS; BETWEEN floors & BETWEEN THE TOP FLooR & THE attic IN BALLooN-FRAME buildings (THE PLATES IN platform-frame buildings automatically provide fireblocking BETWEEN floors); between wall cavities & concealed horizontal spaces such as soffits & drop cEILINGS; in tall walls every 10 ft. vertically.

firestopping IS usually 2x FRAMING LuMBER but can also be other materials such as LAYERS of plywood or GYPSuM WALLBoARD WHEN approved BY LocAL coDES.

Подпись: FIRESTOPPING(д) BLOCKING & NOTCHING

it is occasionally difficult or impossible to cantilever the floor framing to support a projection from the building. where loads are not great, it is possible to support the projection with cantilevered walls.


doubled studs at opening in primary WALL; 16D toenails or metal framing ANGLES advisable at top & bottom


double studs at opening in primary

WALL


cantilevered WALL IS supported BY NAILING

through plywood to doubled studs

IN PRIMARY WALL.


roof


cantilevered plywood walls


studs of

cantilevered wall

extend sheathing down to lap floor-system

FRAMING.

sole plate of cantilevered wall

floor-system

FRAMING


FRAMING DETAIL SEE 73D


note

cantilevered WALLS should BE ENGINEERED IF THEY

project more than

2 FT., IF THEY ARE more THAN 6 FT. APART or IF THEY WILL support heavy snow loads.


CANTILEVERED WALLS


About the drawings

About the drawingsAbout the drawings

About the drawings

roof structure

ALIGNED ovER

studs allows for single top

PLATE


REDUCED FRAMING IN STRUCTURAL HEADERS WHERE THEY ARE REQUIRED SEE 76


SINGLE TOP PLATE


balloon-framed

RAKE WALLS SEE 720


intersecting walls see 75B & D


joists aligned over studs allows for single top

PLATE


ELIMINATE

structural

HEADERS AT

openings

WHERE THEY ARE

not required


studs ALIGNED BETWEEN FLooRS


rim joist used as header

ELIMINATING

structural

HEADERS IN

openings below


superinsulated

corner

SEE 75A & c


STANDARD WALL FRAMING SEE 67


About the drawings

Advanced framing—Advanced framing minimizes the amount of framing that extends from the interior to the exterior of a wall, thus lowering the effect of thermal bridging. By limiting the amount of framing, more volume in the wall can be occupied by insulation, which increases thermal performance of the overall assembly. Advanced framing alone can increase the thermal performance of framed walls by only about
7%, but, given that it uses less material than standard framing and also helps to conserve a precious resource, it should be considered for eveiy framed building. Details of advanced framing are illustrated on 75-76. The goal when designing an energy-efficient header is to allow for the most insulation while providing for nailing at both the exterior and interior of the opening.

) ADVANCED WALL FRAMING

SUPERINSULATED 2X6 CORNER

Outside Corner Only at Top Plate


INTERSECTING 2X WALLS

At Top Plate


BACKUP CLIPS AT INSIDE CORNERS OF GYPSUM WALLBOARD ELIMINATE NEED FOR EXTRA STUD, ALLOWING FOR FULL

About the drawings


SUPERINSULATED 2X6 CORNER

Outside Corner Only at Sole Plate


INTERSECTING 2X WALLS

At Sole Plate


About the drawingsAbout the drawingsAbout the drawingsAbout the drawings

About the drawings

About the drawings

SHEATHING


ВАТТ INSULATION FOR TYPICAL WALL COMPRESED AGAINST HEADER


2X HEADER ADEQUATE FOR Most oPENINGs

see 760


king STUD


About the drawings

When a structural header is required over an opening in an exterior wall, the header itself occupies space that could otherwise be filled with insulation. Because a deep (tall) header is more effective structur­ally than a wide one, the header does not usually have to fill the entire width of the wall. In fact, the taller and thinner the header, the more space there will be for insulation. The headers illustrated on this page provide both structure and space for insulation. The box header

(see 69D) also provides space for insulation because it uses sheathing as structure.

The elimination of the trimmer studs that usually support a header at its ends also allows for more insula­tion in the wall. The header can usually be supported by the king stud as illustrated in the two examples below. (Backing may need to be added to the king studs when wide casings are used.)

About the drawingsSUPERINSULATED HEADERS

General

About the drawings

FOR TRIMMER STUD.


About the drawings About the drawings

About the drawings

About the drawingsПодпись:

Most wood buildings are sheathed with plywood, OSB, or other structural panels that provide the neces­sary lateral stability when fastened directly to the stud frame (see 78-80). Where lateral forces on walls are extreme, such as in areas subject to hurricanes or earth­quakes, specially designed shear walls are commonly required to withstand these forces (see 82-87).

When neither structural panels nor shear walls are required, there are two good methods of bracing the building for lateral stability: the let-in wood brace (see 77B) and the kerfed-in metal brace (see 77C).

The old-fashioned method of bracing with diagonal blocking between studs is not recommended because the nails may withdraw under tension and the many joints tend to open up as the blocking shrinks.

Bracing is often referred to as “corner bracing,” and indeed, the International Residential Code begins its discussion of every allowed wall bracing method with the phrase “located at each end…” While it is true that the corners are the most effective location for a limited amount of wall bracing, it is also possible to success­fully brace a building at locations other than the cor­ners. If this were not true, there would be no corner windows. Braces may be located anywhere along a wall, and the bracing effect will be transferred to the rest of the wall through the continuous top and bottom plates. Increased nailing, stronger sheathing, and other methods can also augment bracing. A good structural engineer will be able to design walls of just about any configuration to resist lateral forces.

The methods shown here are located at a corner only for clarity of illustration.

LATERAL BRACING

Notes

NOTE

LET-IN BRACES SHOULD BE MADE OF STRUCTURALLY SOUND 1X4 OR 1X6 LUMBER. THEY SHOULD BE FROM TOP Plate TO SOLE Plate & 45° TO 60°

FROM THE HORIZONTAL.

About the drawings

NOTE

METAL BRACING SET IN A SAW KERF & NAILED TO EACH STUD IS ENGINEERED TO EQUAL THE CODE REQUIREMENTS OF A 1X4 WOOD LET-IN BRACE. SURFACE MOUNTED TYPES (WITHOUT KERF) MUST BE INSTALLED IN OPPOSING DIRECTIONS IN AN "X" OR "V" CONFIGURATION. ALL TYPES MUST BE INSTALLED AT 45° TO 60° FROM THE HORIZONTAL.

KERFED-IN METAL BRACE


About the drawings

Подпись: Notes

Structural sheathing performs two functions—it pro­vides lateral bracing, and it forms a structural backing for siding materials. OSB is currently the most common structural sheathing, but the use of plywood, gypsum board (which also contributes fire resistance) and other panel products is also widespread. OSB and plywood both have a strength axis along the length of the panel because of the orientation of wood fibers, but this axis

is only important in relation to its bending strength between studs. The panel’s shear strength—its ability to resist lateral forces—is not affected by its orientation.

Panels may be installed either vertically or hori­zontally. Vertically applied sheathing does not usually require blocking because all panel edges are aligned with framing members. Horizontally applied panels, if engineered to provide lateral resistance, must have blocking between studs for nailing. Horizontal OSB and plywood panels provide a stronger backing for siding than do panels with a vertical orientation.

дSTRUCTURAL SHEATHING_________

In earthquake or hurricane zones or where walls are very tall or penetrated by many openings, structural sheathing may require engineering, or shear walls (see 82) may be required.

The capacity of panel products such as OSB and ply­wood to span between studs is related to thickness. The following chart applies generally:

r STUD SPACING

PANEL THICKNESS 1

16 in. o. c.

3/8 in.

24 in. o. c.

У2 in.

Nails or other approved fasteners should be sized and spaced according to the following schedule. Verify with manufacturer and local codes.

PANEL

THICKNESS

NAIL

SIZE

PANEL EDGE NAILING

FIELD

NAILING

У2 in. or less

6d

6 in. o. c.

12 in. o. c.

over У2in.

8d

PANEL NAILNG
SCHEDULE

SEE 78A


8-FT. oR 9-FT. PANEL on

second story, depending on CEILING HEIGHT


1/8-IN. SPACING BETWEEN ALL PANEL EDGES –


9-FT. PANEL LAPS RIM joiST & TIES FRAMING To foundation IN HIGH-WIND or earthquake regions.


NOTE

IN CERTAIN CASES, SUCH AS WHEN MOST OF A WALL

is covered with doors & windows, structural sheathing must be professionally engineered

AS BRACING. TYPE of SHEATHING SizE & SPACING oF NAILS

and/or tie-downs should

BE SPECIFIED.


alternative 8-FT. panel

WITH FILLER STRIP AT RIM joiST.


, >№


About the drawings

About the drawings

NOTE

IN REGIONS NOT SUBJECT TO HIGH RISK OF HURRICANE OR EARTHQUAKE, HORIZONTAL PANELS

without blocking & with filler strips at base MAY BE acceptable.

About the drawingsSTRUCTURAL SHEATHING/SINGLE-STORY BUILDING

Подпись:Подпись: L i- h •Подпись: ^ ‘Подпись:About the drawingsПодпись:Подпись:

Подпись: PANEL NAILING ScHEDULE SEE 78A UPPER EDGE OF PANEL ALIGNS WITH LOWER TOP PLATE. LEAVE 1/8-IN. SPAcE AT ALL PANEL EDGES.
Подпись: WHEN NOT ENGINEERED AS BRACING, SHEATHING PANELS MAY PAN BETWEEN STUDS WITHOUT BLOCKING DEPENDING ON STUD SPACING, PANEL THICKNESS & SIDING MATERIAL. 3/8-IN. SHEATHING IS REcOMMENDED FOR STUDS AT 16 IN. O.c. & 1/2-IN. SHEATHING FOR STUDS AT 24 IN. O.c. VERIFY SPAN RATING ON PANELS.
Подпись: BLOCKING BEHIND PANEL JOINTS IS REQUIRED WHEN HORIZONTAL PANELS ARE ENGINEERED FOR LATERAL BRAciNG.
Подпись: NOTE: THIS DETAIL IS APPROPRIATE ONLY IF STUDS ARE PREcUT AT 903/4 IN. OR LESS & THE SUBFLOOR SITS DIRECTLY ON THE MUDSILL, SEE 33c & D, OR IF A SLAB FOUNDATION IS USED, SEE 22
Подпись: NOTE HORIZONTAL PANELS SHOWN IN THIS DETAIL MAY BE REPLAcED WITH VERTICAL PANELS. SEE 79A

Distance from Mudsill to Top Plate over 8 Ft.

STRUCTURAL SHEATHING/SINGLE-STORY BUILDING

Distance from Mudsill to Top Plate 8 Ft. or Less

In single-wall construction, a single panel of plywood or composite board siding provides both structural and weathering functions. This is an inex­pensive, low-quality type of construction most appropriate for garages and sheds, but also used for residential construction. Panels are installed vertically, usually over a moisture barrier.

Подпись:Подпись: SINGLE-PANEL SIDING Подпись: CORNER SEE 112Подпись: BASE DETAILS SEE 80B & CAbout the drawingsПодпись: STUD WALLPrecut studs (from 88Уз in. to 92% in.) allow 8 – ft. panels to cover the framing on the exterior if the subfloor sits directly on the mudsill (see SOB) or if there is a slab floor. Adding trim to the base allows the use of 8 – ft. panels with taller studs and/or different subfloor connections (see 80C).

Taller (9-ft. and 10-ft.) panels are also available.

About the drawings

The hydraulic works of Samos: record achievements in the Greek world

The city of Samos in Ionia is located near the coast of Asia Minor on an island of the same name. A spectacular tunnel more than 1,000 m long was dug for its water supply (Figure 4.15). The tunnel was bored in two sections starting from its extremities (the meeting point of the two bores is shown by an arrow on Figure 4.15). The water supply conduit was laid at the bottom of a trench dug into the floor of the tunnel. Because of this trench, it was possible to dig a horizontal tunnel (a relatively straightforward task); the depth of the trench is zero at the entrance to the tunnel and progressively increases to reach nearly 8.5 m at the tunnel’s exist, assuring the slope necessary to convey the flow.

The hydraulic works of Samos: record achievements in the Greek world

Figure 4.15. Plan view of the aqueduct of Samos and the tunnel of Eupalinos.

Herodotus considered this project, which is still partially visible today,[157] [158] as one of the marvels of the Hellenic world:

“I have dwelt the longer on the affairs of the Samians, because three of the greatest works in

all Greece were made by them. One is a tunnel, under a hill one hundred and fifty fathoms

(265 m) high, carried entirely through the base of the hill, with a mouth at either end. The

length of the cutting is seven furlongs (1,240 m) – the height and width are each eight feet (2.4

m). Along the whole course there is a second cutting, twenty cubits deep (8.5 m!) and three

feet broad (0.9 m), whereby water is brought, through pipes, from an abundant source into the

city. The architect of this tunnel was Eupalinus, son of Naustrophus, a Megarian. Such is the

22

first of their great works; (….)”

Herodotus’ dimensions approximately coincide with those that can be deduced from the remains of the works. The project was very likely undertaken under the reign of the tyrant Polycrates, around 530 BC, before Samos fell under Persian domination.

Herodotus also mentions a mole (breakwater) at the port of Samos, once again a record achievement for the period. Here is the continuation of the passage above:

“the second is a mole in the sea, which goes all round the harbor, near twenty fathoms (35 m) deep, and in length above two furlongs (355 m). The third is a temple (..)”

Step 8-Set Jack Rafters

Set first jack rafter on 16” or 24" spacing with common rafters.

Measure length from common rafter to first jack rafter and then use standard jack rafter differences, as given in framing square table, to measure lengths of remaining jack rafters along the hip rafter.

12

For 17 pitch

Framing Square Segment

Ф|||||П’Т[Ф

ШГТІтїї

JFTFjJ

рттлт

ф|||||ф|ф

TTW

8

|ЇЇЧПТ

ПфП|і

"ІИІ

LENGTH COMMON RAFTERS PER FOOT RUN

21

63

20

81

20

11

HIP OR VALLEY » »

и

24

74

Cs]

CM

О

23

32

DIFF

IN LENGTH OF JACKS 16 INCHES CENTERS

28

%

26 и/le

Water supply for Greek cities

Greek cities develop their water supply using local springs and aqueducts of terra-cotta conduits, following the centuries-old Cretan and Mycenaen traditions. These conduits are set underground, both for their protection and to accommodate irregular topography.

They are assembled from interlocking pre-fabricated elements from 60 cm to 1 m long, and between 11 and 22 cm in diameter.[156] Some of the individual elements have a hole in their crown, normally plugged with clay, very likely intended to provide access for inspection and cleaning of the pipes. The presence of these inspection holes, as well as the thinness of the walls (2 to 4 cm), clearly suggest that these pipes conveyed water through free-surface gravity flow, not under pressure.

Commonly used bolts

Carriage bolt

Commonly used bolts


m


Commonly used bolts

Stove bolt


ішшшиишщшшш


ШШШк


m


Commonly used bolts

Lag bolt


“-‘ч


Commonly used bolts

Commonly used boltsCommonly used boltsCommonly used boltsCommonly used boltsCommonly used bolts

Commonly used bolts

Drywall screws love plywood—they zip through а 3/нп.-thick sheet in nothing flat—so they’re great for attaching sheathing or flooring. But drywall screws are somewhat brittle, so don’t use them in shear walls (which are built to resist the shear forces of earthquakes and high winds) without first getting approval from an engineer or your build­ing department. Drywall screws can also break when being driven into thick stock or hardwoods. I have driven a 3-in. screw through 2×6 decking into a joist
only to hear a snap right before the screw sets. A new, hard-to-break line of interior and exterior drywall screws is now available from Faspac, Inc. (see Sources on p. 198). These screws have self-drilling tips that make them easy to use in thick wood or hardwood.

Deck screws are drywall-type screws that have been coated, galvanized, or made of stainless steel for corrosion resistance. Use these for exterior jobs such as attaching deck boards or fence slats.

Heavy-gauge lag screws (1Л in. dia. and up) are typically used to attach a 2x ledger (a horizontal wood member) to the house framing. They are usually dri­ven into the wood with a wrench. Lag screws are smaller than lag bolts.

Bolts

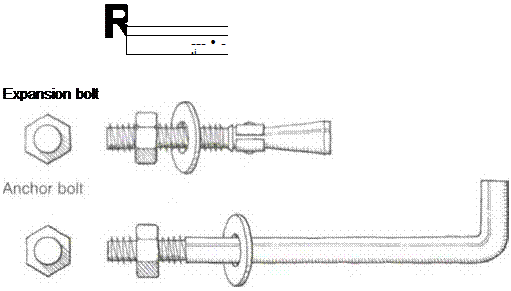
Bolts have many applications, from hold­ing a house to the foundation to securing a deck to a wall to uniting a row of kitchen cabinets. When buying bolts, you have to specify the thickness and length you need (3/s in. thick by б in. long, for example). A carpenter often uses carriage, machine, stove, lag, expansion, and anchor bolts (see the drawing on the facing page).

Carriage bolts have round heads, some­times with a screwdriver slot on top, and are fitted with a washer and nut on the threaded end. I like to use carriage bolts when building deck railings.

Machine bolts have square or hexagonal heads. When using machine bolts to join two pieces of wood, place a washer on both ends before tightening; other­wise, you could tear into the wood. Machine bolts are often used to connect beams in post-and-beam construction and to attach metal plates to the house framing to stabilize it in case of an earthquake or hurricane. Stove bolts are small machine bolts.

Lag bolts are similar to lag screws but go clear through the wood. Lag bolts can be used to fasten a deck ledger to a house (just make sure that you are attaching the ledger to good, solid wood). Because lag bolts are driven into wood like screws, you need to drill pilot holes about Vs in. smaller in diameter than the bolt (a 3/s-in. hole for а Уг-іп. bolt, for example).

Expansion bolts are fitted in holes drilled in existing concrete. They expand in the concrete to ensure a secure hold and are used to attach wood to a foundation or other concrete surface.

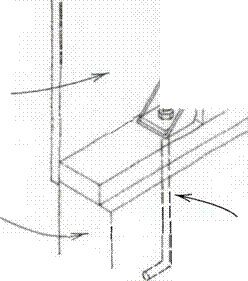
Anchor bolts are shaped like a J. They are normally embedded in a concrete foundation to secure wood sills to the foundation, which helps hold a house in place.

Framing anchors

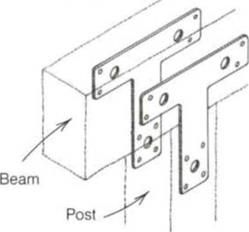
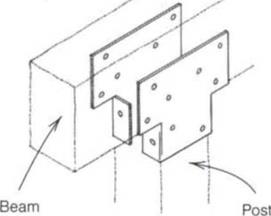
There are a wide range of framing anchors (Simpson Strong-Tie Co. is a good source—see Sources on p. 198) that help increase the structural stability of a house (see the drawing on p. 80). Carpenters use joist hangers, right-angle and hurricane clips, plate straps, hold­downs, post caps, and T-straps. Anchors are often required by local building codes, particularly in areas of seismic activity or high wind. In other cases, they just make framing faster, easier, and more efficient.

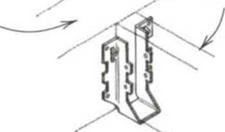
Joist hangers can be nailed to beams or rim joists to support joists for a floor or ceiling. These hangers come in various sizes to fit the joist size and are nailed into the beam through side flanges.

The joist is placed in the hanger and nailed in. A tool made by Ator Tool Works, called a Joister, holds the hanger in place so both your hands can be free for nailing.

Right-angle clips and hurricane clips are widely used to attach one wood member to another. A commonly used right-angle clip is 4У2 in. long with six nail holes in each side. A hurricane clip is a metal device that can be nailed to both rafter and wall plates to hold them securely together. Both types of clips help keep a house in place in earth­quake and hurricane country.

Right-angle
clip


Joist

hanger


Joist


Beam


Hurricane

clip


Rafter


4×4 post


Hold-down


hi

L

p

у X

1 У


Stud


Wall

sheathing


Bottom

plate


Concrete

foundation


Anchor bolt


T-strap

Commonly used bolts


Metal post cap

Commonly used bolts


Commonly used boltsCommonly used boltsCommonly used boltsCommonly used boltsCommonly used bolts

MAKING A PLUMB STICK

To plumb walls, you can make a plumb stick from any 2-ft. level and a straight 2×4 stud. Even a battered, inaccurate level can be used. Select the straightest stud you can find and nail a 16-in. 1×2 strip onto each end, letting the strips overhang the stud ends by about 3 in. Use some duct tape to attach a 2-ft. level to the op­posite edge of the 2×4 (near the center) and your plumb stick is nearly ready to use (see the photo below).

It’s important to check your plumb stick for accuracy. To do so, hold it vertical and flat against a wall. Keep the bottom end fixed in place as you move the top end back and forth until the bubble is exactly centered in the vial. Make pencil marks on the top and bot­tom of the wall along the 1x extensions. Now turn the plumb stick side for side—not end for end—so that the level is flat against the wall on the other side of the lines you marked. Carefully line up the extensions with the marks on the plates. If the bubble returns to the exact center of the vial, the plumb stick is accurate. (By the way, you can check the accuracy of any level with this method.)

If the bubble is not centered in the tube, the level needs to be adjusted. Stick a wooden shim, a folded piece of paper, or an 8d nail under one end of the level (between the level and the 2×4), and then check the plumb stick again. Keep adjusting the shim thickness un­til the bubble is centered both ways.

MAKING A PLUMB STICK

1. Подпись: HAMMERING IN A NAIL CLIP
Once the trimmer is plumb, drive an 8d nail into the edge partway and then bend it over, embedding the shank and head in the king stud.

2. Подпись:Подпись: To create a straight reference line, stretch a string tightly around 2x spacer blocks positioned at op-posite ends of the wall's top plate. Use another 2x scrap to test for straightness along the top plate. Move the top plate in or out to get the wall straight. [Photo © Larry Haun] MAKING A PLUMB STICKMAKING A PLUMB STICKClip the first nail by bending a second nail over it. Hammer the clip until both nails are fully em­bedded in the wood.

Подпись: Walls that need to be moved out slightly can simply be pushed with a stud brace nailed to a wall stud. Nail the brace to the subfloor when the top plate is straight.

This pair of 8d nails clips one piece of wood next to another. Pairs of nails are frequently used to clip a trimmer stud plumb next to a king stud.

move the top plate out until it’s straight, then secure the bottom of the brace to the floor with two 16d nails. If you are framing on a slab, first nail a 4-ft. 2x flat on the bottom plate at a right angle to the wall, then nail a brace to the wall and to the flat 2x.

Moving a wall in is a little trickier. Try this: Nail a long 1x or 2x under the top plate and against the subfloor. Then place a short 2x un­der the center of this diagonal brace and bend the brace upward. As the brace flexes upward, the top plate moves in. This works especially well on a wall that is badly out of line.

Make sure you use enough temporary braces as you plumb and straighten the walls to keep every wall in place. Put braces on straight walls as well. Using plenty of braces ensures that the building will be held plumb and straight. Leave all the braces in place until the roof trusses and sheathing have been installed to prevent any frame movement.

External Sources

To some extent, contaminants occurring on the road surface or in the road area have other sources than the traffic or the road. Such sources may be either local or remote.

mm/day

Fig. 6.2 Estimates of pollution concentrations in snow banks along a highly trafficked city road (AADT 40 000) as a function of the intensity of snowfall (expressed as mm of water) (B^kken, 1994b)

Local sources may include agricultural and industrial activities, dust and runoff water from buildings, e. g. copper-plated roofs, and heating by oil, coal and wood. Pollutants include particles, heavy metals, micro-organic pollutants, pesticides, or­ganic carbon and compounds containing nutrients. At places, excreta from birds and other animals (mainly in built-up areas), as well as animal carcasses, may con­tribute nitrogen, phosphorus, organic compounds and micro-organisms (Murozumi et al., 1969; Elgmork et al., 1973; Wiman et al., 1990; Zereini et al., 2001).

Remote sources of long-range transported pollutants are mainly associated with industry, heating and traffic. These pollutants represent a wide variety of compounds including particles, heavy metals, nitrogen – and sulphur-containing compounds, micro-organic pollutants such as PAH and chloro-organic compounds (e. g. PCB, HCB). An important observation made by Landner & Reuther (2004), in a review study, is that long-range transported contaminants arriving in the road area will be of minor importance compared to the pollution originating from the road and traffic in the immediate vicinity.

With a Frequency Relation

Consider Example 3.2 in which the annual maximum flood peak discharges over a 15-year period on the Boneyard Creek at Urbana, Illinois, were analyzed. Suppose that the annual maximum floods follow the Gumbel distribution. The estimated 25-year flood peak discharge is 656 ft3/s. It is not difficult to imag­ine that if one had a second set of 15 years of record, the estimated 25-year flood based on the second 15-year record likely would be different from the first 15-year record. Also, combining with the second 15 years of record, the esti­mated 25-year flood magnitude based on a total of 30 years of record again would not have the same value as 656 ft3/s. This indicates that the estimated 25-year flood is subject to uncertainty that is due primarily to the use of lim­ited amount of data in frequency analysis. Furthermore, it is intuitive that the reliability of the estimated 25-year flood, based on a 30-year record, is higher than that based on a 15-year record.

From the preceding discussions one can conclude that using a limited amount of data in frequency analysis, the estimated value of a geophysical quantity of a particular return period xT and the derived frequency relation are subject to uncertainty. The degree of uncertainty of the estimated xT depends on the sample size, the extent of data extrapolation (i. e., return period relative to the record length), and the underlying probability distribution from which the data are sampled (i. e., the distribution). Since the estimated design quantity is subject to uncertainty, it is prudent for an engineer to quantify the magnitude of such uncertainty and assess its implications on the engineering design (Tung and Yen, 2005, Sec. 1.5). Further, Benson (1968) noted that the results oftheU. S. Water Resources Council study to determine the “best” distribution indicated that confidence limits always should be computed for flood frequency analysis.

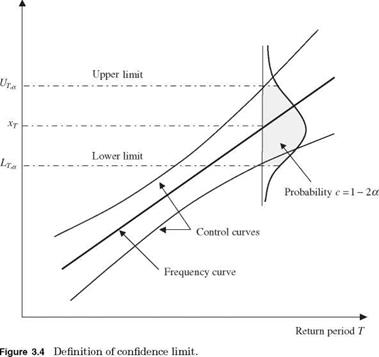
In practice, there are two ways to express the degree of uncertainty of a statis­tical quantity, namely, standard error and confidence interval (confidence limit). Because the estimated geophysical quantities of a particular return period are subject to uncertainty, they can be treated as a random variable associated with a distribution, as shown in Fig. 3.4. Similar to the standard deviation of a

Variate x

With a Frequency Relation


random variable, the standard error of estimate se measures the standard de­viation of an estimated statistical quantity from a sample, such as XT, about the true but unknown event magnitude. On the other hand, the confidence limit of an estimated quantity is an interval that has a specified probability (or confidence) to include the true value.

In the context of frequency analysis, the standard error of XT is a function of the distribution of the data series under consideration and the method of determining the distribution parameters. For example, the asymptotic (that is, as n ^ <x>) standard error of a T-year event se(XT) from a normal distribution can be calculated as (Kite, 1988)

f 2 + zT V/2

se (Xt ) = 2nT sx (3.21)

in which zT is the standard normal variate corresponding to the exceedance probability of 1/T, that is, Ф^т) = 1 – 1/T, n is the sample size, and sx is the sample standard deviation of random variable X. From the Gumbel distribu­tion, the standard error of XT is

Подпись: se(%T )Подпись: (3.22)Г 1 1 1/2

1 + 1.1396 Kt + 1.1 KT sx

n

To construct the confidence interval for XT or for the frequency curve, a con­fidence level c that specifies the desired probability that the specified range will include the unknown true value is predetermined by the engineer. In practice, a confidence level of 95 or 90 percent is used. Corresponding to the confidence level c, the significance level a is defined as a = 1 – c; for example, if the desired confidence level c = 90 percent, the corresponding significance level a = 10 percent. In determining the confidence interval, the common practice is to distribute the significance level a equally on both ends of the distribu­tion describing the uncertainty feature of estimated xT (see Fig. 3.4). In doing so, the boundaries of the confidence interval, called confidence limits, are de­fined. Assuming normality for the asymptotic sample distribution for XT, the approximated 100(1 – a) percent confidence interval for XT is

XT, a = XT – Z1-a/2 X Se(Xt) Xy, a = Xt + Z1-a/2 X Se(Xt) (3.23)

in which XT, a and XU, a are, respectively, the values defining the lower and up­per bounds for the 100(1 – a) percent confidence interval, and z1-a/2 = Ф-1 (1 – a/2). The confidence interval defined by Eq. (3.23) is only approximate and the approximation accuracy increases with sample size.

Similar to the frequency-factor method, the formulas to compute the upper and lower limits of confidence interval for XT has the same form as Eq. (3.6), except that the frequency-factor term is adjusted as

XT, a = X + KTl a X Sx X%a = X + K% a X Sx (3.24)

Подпись: KT,a = ZT ,a/2 With a Frequency Relation Подпись: (3.25)

in which K^ a and KU, a are the confidence-limit factors for the lower and upper limits of the 100(1 – a) percent confidence interval, respectively. For random samples from a normal distribution, the exact confidence-limit factors can be determined using the noncentral-t variates Z (Table 3.5). An approximation for K! p a with reasonable accuracy for n > 15 and a = 1 – c > 5 percent (Chowdhury et al., 1991) is

To compute KU, a, by symmetry, one only has to change za/2 by z1-a/2 inEq. (3.25). As was the case for Eq. (3.20), the confidence intervals defined by Eqs. (3.24) and (3.25) are most appropriate for samples from populations following a nor­mal distribution, and for nonnormal populations, these confidence limits are only approximate, with the approximation accuracy increasing with sample size.

For Pearson type 3 distributions, the values of confidence-limit factors for different return periods and confidence levels given in Eq. (3.24) can be mod­ified by introducing the scaling factor obtained from a first-order asymptotic

Подпись: 132
TABLE 3.5 95 Percent Confidence-Limit Factors for Normal Distribution

Return period (years)

n 2 5 10 25 50 100

KL KT, a

Ku KT, a

KL KT, a

Ku

KT, a

KL KT, a

Ku

KT, a

KL KT, a

Ku

KT, a

KL KT, a

Ku

KT, a

KL KT, a

Ku

KT, a

15

-0.4468

0.4468

0.3992

1.4641

0.7908

2.0464

1.1879

2.6880

1.4373

3.1095

1.6584

3.4919

20

-0.3816

0.3816

0.4544

1.3579

0.8495

1.9101

1.2535

2.5162

1.5085

2.9139

1.7351

3.2743

25

-0.3387

0.3387

0.4925

1.2913

0.8905

1.8257

1.2997

2.4109

1.5586

2.7942

1.7891

3.1415

30

-0.3076

0.3076

0.5209

1.2447

0.9213

1.7672

1.3345

2.3382

1.5965

2.7120

1.8300

3.0504

40

-0.2647

0.2647

0.5613

1.1824

0.9654

1.6898

1.3845

2.2427

1.6510

2.6041

1.8889

2.9310

50

-0.2359

0.2359

0.5892

1.1418

0.9961

1.6398

1.4194

2.1814

1.6892

2.5349

1.9302

2.8546

60

-0.2148

0.2148

0.6100

1.1127

1.0191

1.6042

1.4457

2.1378

1.7179

2.4859

1.9613

2.8006

70

-0.1986

0.1986

0.6263

1.0906

1.0371

1.5772

1.4664

2.1050

1.7406

2.4490

1.9858

2.7599

80

-0.1855

0.1855

0.6396

1.0730

1.0518

1.5559

1.4833

2.0791

1.7591

2.4199

2.0059

2.7279

90

-0.1747

0.1747

0.6506

1.0586

1.0641

1.5385

1.4974

2.0580

1.7746

2.3963

2.0226

2.7019

100

0.1656

0.1656

0.6599

1.0466

1.0746

1.5240

1.5095

2.0404

1.7878

2.3766

2.0370

2.6802

approximation of the Pearson type 3 to normal quantile variance ratio n as (Stedinger et al., 1983)

Kr, a = Kt + n(ZT,1-a/2 — Zt ) and Ky, a = Kt + n(ZT, a/2 — Zt ) (3.26)

Подпись: n = Подпись: 1 + yxKT + 1/2(1 + 3/iYx)KT + n var(yx)(ЭKT /дух)2 1 + (1/2)zT Подпись: (3.27)

where

Подпись: d KT dyx Подпись: 1 (4 — 1) With a Frequency Relation Подпись: (3.28)

in which yx is the estimated skewness coefficient, and

A simulation study by Whitley and Hromadka (1997) showed that the approx­imated formula for the Pearson type 3 distribution is relatively crude and that a better expression could be derived for more accurate confidence-interval de­termination.

Example 3.8 Referring to Example 3.3, determine the 95 percent confidence interval of the 100-year flood assuming that the sample data are from a lognormal distribution.

Solution In this case, with the 95 percent confidence interval c = 0.95, the corre­sponding significance level a = 0.05. Hence Z0.025 = Ф—1(0.025) = —1.960 and г0.975 = Ф—1(0.975) = +1.960. Computation of the 95 percent confidence interval associated with the selected return periods are shown in the table below. Column (4) lists the values ofthe upper tail ofthe standard normal quantiles associated with each return period, that is, Kt = zt = Ф—1(1 — 1/T). Since random floods are assumed to be lognormally distributed, columns (7) and (8) are factors computed by Eq. (3.25) for defining the lower and upper bounds of the 95 percent confidence interval of dif­ferent quantiles in log-space, according to Eq. (3.24), as

yT,0.95 = y + ZT,0.025 x sy yU,0.95 = y + ZT ,0.975 x sy

In the original space, the 95 percent confidence interval can be obtained simply by taking exponentiation as

ЧТ,0.95 = exp (уТ,0.95) and 3r,0.95 = exp (УТ,0.95)

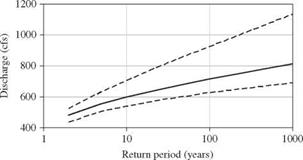
as shown in columns (11) and (12), respectively. The curves defining the 95 percent confidence interval, along with the estimated frequency curve, for a lognormal distri­bution are shown in Fig. 3.5.
95% CL for lognormal

With a Frequency Relation

Figure 3.5 95 percent confidence limits for a lognormal distri­bution applied to the annual maximum discharge for 1961­1975 on the Boneyard Creek at Urbana, IL.

Exceedance

Nonexceedance

Return period

probability

probability

T (years)

1 – p = 1/T

p = 1 – 1/ T

Kt = zt

УТ

qT

(1)

(2)

(3)

(4)

(5)

(6)

2

0.5

0.5

0.0000

6.165

475.9

5

0.2

0.8

0.8416

6.311

550.3

10

0.1

0.9

1.2816

6.386

593.7

25

0.04

0.96

1.7505

6.467

643.8

50

0.02

0.98

2.0537

6.520

678.3

100

0.01

0.99

2.3263

6.567

711.0

Return period

ZT,0.025

ZT,0.975

УТ,0.95

УТ,0.95

qT,0.95

qTU,0.95

T (years)

(7)

(8)

(9)

(10)

(11)

(12)

2

– 0 . 54

0.54

6.071

6.259

433.2

522.8

5

0.32

1.63

6.221

6.446

503.1

630.4

10

0.71

2.26

6.288

6.555

538.1

702.9

25

1.10

2.96

6.355

6.676

575.5

792.8

50

1.34

3.42

6.397

6.755

600.1

858.2

100

1.56

3.83

6.434

6.827

622.8

922.2

In order to define confidence limits properly for the Pearson type 3 distri­bution, the skewness coefficient must be estimated accurately, thus allowing the frequency factor KT to be considered a constant and not a statistic. Un­fortunately, with the Pearson type 3 distribution, no simple, explicit formula is available for the confidence limits. The Interagency Advisory Committee on Water Data (1982) (hereafter referred to as “the Committee”) proposed that the confidence limits for the log-Pearson type 3 distribution could be approxi­mated using a noncentral ^-distribution. The committee’s procedure is similar to that of Eqs. (3.24) and (3.25), except that KT, a and KU a, the confidence-limit factors for the lower and upper limits, are computed with the frequency factor KT replacing ZT in Eq. (3.25).

Example 3.9 Referring to Example 3.3, determine the 95 percent confidence intervals for the 2-, 10-, 25-, 50-, and 100-year floods assuming that the sample data are from a log-Pearson type 3 distribution.

Solution From Example 3.3, the mean and standard deviation of the logarithms of the peak flows were 6.17 and 0.173, and the number of data n is 15. For the 100-year flood, Kt is 1.8164, and for the 95 percent confidence limits, a is 0.05; thus Za/2 is -1.96. Thus KT a is -0.651, and the lower 95 percent confidence bound is 427.2 ft3/s. The upper and lower confidence bounds for all the desired flows are listed in the following table:

Return Period T (years)

Kt Eq. (3.8)

KT,0.025

Eq. (3.26)

KT,0.975 Eq. (3.26)

qT,0.95

(ft3/s)

au

4t,0.95 (ft3/s)

2

-0.0907

-0.6513

0.4411

427.2

516.1

10

1.0683

0.5260

1.9503

523.7

670.1

25

1.4248

0.8322

2.4705

552.2

733.2

50

1.6371

1.0082

2.7867

569.3

774.4

100

1.8164

1.1540

3.0565

583.8

811.4

Snow and Ice

In regions with a cold climate, snow and ice may cover the road surface for a period. Various machinery is used to clear roads of snow. On icy surfaces, sand or grit may be used to increase the friction. For de-icing purposes, road salt is used, mostly NaCl. The salt makes the road wet, thus keeping more of the pollutants on the road surface with potential to leak into cracks in the road surface and along the road shoulder.

If let lying for an extended period of time, snow deposited along roads often becomes heavily loaded with traffic pollutants via splash and spray. The deposition rates of pollutants to the snow banks along heavily trafficked roads may be high (Table 6.4). The resulting concentrations in the snow banks may also be high but depend on the amount of snowfall (Fig. 6.2). Many heavy metals increase their solubility in the presence of ions, e. g. resulting from de-icing with NaCl. Often occurring without a coinciding heavy rainfall which would have diluted the solution, the first flush following the snow melt has high concentrations of most water-soluble pollutants. This flush mobilises considerable amounts of pollutants, often over a short period of time.
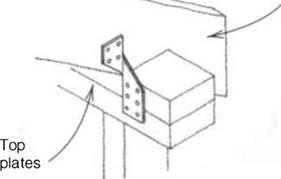
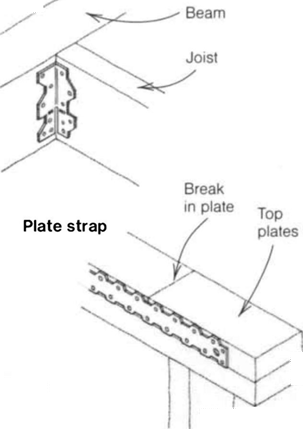
Table 6.4 Rates of deposition on snow banks for a selection of traffic pollutants from streets in two cities of Norway (B^kken, 1994b; B^kken & Tjomsland, 2001)

AADT

2,000

6,000-7,000

15,000-38,000

88,000

Cd

mg/m2/week

0.002-0.03

0.03-0.06

0.10

0.09

Cr

mg/m2/week

0.15-2.2

0.52

3.06

1.10

Cu

mg/m2/week

0.1-9

0.7-25

4.82-20

2.78

Fe

mg/m2/week

11

188

672

485

Ni

mg/m2/week

0.02-1.4

0.2-5.8

0.9-4.9

0.60

Pb

mg/m2/week

0.2-1.1

1.3-1.4

4.9-8.1

5.40

Zn

mg/m2/week

0.3-6

2.6-34

16-31

14

Sum PAH16

pg/m2/week

165-242

293-1,940

1,390-1,680

5,520

Sum cPAH

pg/m2/week

20-34

46-263

98-172

166

HCB

pg/m2/week

0.007-2.6

0.9-7.8

3.00

1.00

AADT = annual average daily traffic. PAH16 = a selection of 16 internationally agreed standard polyaromatic hydrocarbons (PAH) congeners. cPAH = potentially carcinogenic PAH congeners. HCB = hexachlorobenzene.