Coatings Improve Performance

Energy-efficient windows were developed during the previous energy crisis. When Jimmy Carter was installing solar panels on the White House and making conserva­tion a priority, the Department of Energy’s Lawrence Berkeley National Laboratory was charged with finding ways to conserve energy. Windows were among their targets. The insulating windows of that era allowed an inordinate amount of heat to escape. The lab’s scientists concluded that by using exist­ing technologies to deposit a virtually invis­ible metal or metal-oxide coating on the glass, insulating windows could be dramati­cally more efficient. This coating is trans­parent to visible light, but blocks long – and short-wave radiation by reflecting it. Known as a low-e (for low-emissivity) coating, it’s common today even on low-cost windows.

Depending on the nature of this thin coating and which window surface it is applied to, the coating can reflect heat back into the room to conserve it or filter sunlight to keep heat out. Using a coating on two dif­ferent glass panes can fine-tune the amount of heat that’s retained in each direction.

The measure of the amount of the sun’s heat a window lets through is the solar heat gain coefficient. SHGC in shorthand, it ranges from 0 to 1, where 1 is uninterrupted heat gain. A clear-glass, two-pane insulated window has an SHGC between 0.56 and 0.68, depending on the frame material and construction. The size of the air gap, which is influenced by frame design, and the amount of light blocked by the frame and grille affect the SHGC.

A double-pane IG with two low-e coatings can achieve an SHGC of 0.33 (glass-only value). As the SHGC is minimized, the U – factor declines, which has implications for selecting windows in climates with heating and cooling seasons.

Choosing

Energy-Saving

Windows

REGiONAL: A GOOD APPROACH

If you’re interested in efficient windows, the starting point is an Energy Star rating. The greatest chunk of energy savings comes from good insulating properties. Energy Star per­formance prescriptions dictate that the colder the climate, the lower the U-factor you’ll want. In southern climates, where air­conditioning dominates energy consump­tion, Energy Star ratings shift focus to a lower SHGC to reduce the impact of the sun.

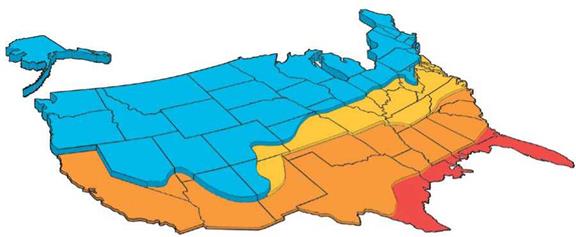
The Department of Energy divides the United States into four climate regions (see the map on p. 98). Under the Energy Star program, each region is assigned threshold U-factor and SHGC ratings for a qualifying window (see the chart on p. 98). A double – hung vinyl window that’s Energy Star quali­fied in all four zones might start at around $14 per sq. ft., with a clad frame starting at around $28 per sq. ft.

Coatings Improve Performance

North


< 0.35


О»


North/Central


< 0.4


< 0.55


South/Central


< 0.4


< 0.4


South


< 0.65


< 0.4


Coatings Improve Performance

Coatings Improve Performance

< less than or equal to

Coatings Improve PerformanceCoatings Improve Performance

DULUTH, MINN.

Insulated fiberglass frame, double pane with three films

U-factor = 0.09 (R-11)

SHGC = 0.26 Price = $280/sq. ft.

LoCAL: a Better APPRoACH

In the United States, the performance characteristics on an NFRC label (see the sidebar on p. 95) provide a moment-in-time snapshot of performance, but don’t relate anything about the long-term energy conse­quences and peak load demands of window choices.

To get a better-performing window than the Energy Star minimum, you need to take energy costs into account. A quick-and-dirty tool from the Efficient Windows Collabora­tive (www. efficientwindows. org/selection .cfm) compares the energy costs for a range of windows with different performance char­acteristics. The cost figures are generated us­ing RESFEN software (see "Site Specific: The

san francisco, calif.

insulated vinyl frame, double pane with one film

U-factor = 0.27 (R-3.8)

SHGC = 0.47 Price = $50/sq. ft.

Best Approach" on p. 100) and are based on a benchmark house.

Their modeling recommends low U-factor, high-SHGC windows in the north region, the north/central zone, and the upper half of the south/central area; and low U-factor, low-SHGC windows in the south­ern reaches of the south/central area and in the south region.

The most energy-efficient windows in all locations, except San Francisco and Flagstaff, Ariz., are at least triple-glazed with insulated vinyl or fiberglass frames. These windows are hard to find and expensive. The nice thing about the collaborative’s website is that it shows how much annual energy expenditures rise if you opt for a readily

Coatings Improve Performance Coatings Improve Performance

LOUiSViLLE, KY. insulated fiberglass frame, triple pane

U-factor = 0.23 (R-4.3)

SHGC = 0.39 Price = $80/sq. ft.

available double-glazed window with two low-e coatings and an uninsulated vinyl or clad-wood frame. Exceeding Energy Star minimums saves money over the life of the window. (Examples shown are options ex­ceeding Energy Star thresholds. Consult the collaborative’s website or RESFEN for energy performance for your location. Prices are ap­proximate window cost.)

Critics of Energy Star argue that in heat­ing climates, the emphasis on insulating- value performance to the exclusion of solar heat gain misses an opportunity. By omit­ting an SHGC requirement in the north region, window companies can market a single low U-factor, low-SHGC glass pack­age that meets Energy Star requirements in all regions. An Energy Star label on low U-factor, low-SHGC windows in cold north­ern regions of the United States means homeowners who think they are buying energy-efficient windows are actually pay­ing more in heating costs and adding more carbon emissions to the atmosphere than if they had purchased windows that accounted for passive solar-heating opportunities. (For some sites, a very low U-factor, such as the Duluth, Minn., example, is the best option.) The Department of Energy is reportedly re­evaluating the standard.

While insulating properties may not seem as important in the South, where Energy Star thresholds are fairly high, a low U-factor helps to keep indoor temperatures cool. This reduces peak cooling loads and saves money in two ways: It reduces energy consumption
new orleans, la.

Clad-wood frame, double pane

U-factor = 0.3 (R-3.3)

SHGC = 0.21 Price = $52/sq. ft.

in peak demand periods with higher rates, and by reducing peak loads saves on mechanical costs with a smaller air­conditioning system.

Window glass isn’t the only or even the best way to block summer sun. Deciduous trees on the south, east, and west sides of a house work very well. Another strategy is the use of overhangs and shading devices.

If you need to rely on window glass to control solar gain in the South, you’ll need low-SHGC, or spectrally selective, windows. They reflect short – and long-wave infrared radiation to filter out 40% to 70% of incom­ing heat. Sometimes known as low-e2 or low-e3, the second – and third-generation low-emissivity coatings on these windows not only reduce solar gain, but also filter more than 99% of the UV-light that causes color fading.

Generally, you want a window to block solar gain but let in visible light. The win­dow’s light-to-solar-gain ratio (VT/SHGC) provides a gauge of its relative efficiency in transmitting light while blocking heat gain. The higher the number, the more light transmitted without adding excessive amounts of heat. In a cooling-dominated cli­mate, a ratio above 1.0 is better because light transmittance is higher than heat gain.

If glare is a problem, windows tinted bronze, green, or blue limit visible light and are spectrally selective with a low SHGC. However, because they absorb infrared radia­tion rather than reflect it, tinted windows radiate heat.

CANADIANS HAVE iT EASY

Windows sold in Canada have an energy rat­ing (E. R.) that makes it easy to evaluate the trade-offs in heating-dominated climates.

By weighing the amount of solar-heat gain against interior-heat loss through the win­dow and heat loss through air leakage, the E. R. indicates whether a window is a net source of energy (positive E. R. value), en­ergy neutral (E. R. equals 0), or a net loss of energy (negative E. R. value). If you live in a north or north/central zone in the United States or Canada and you’re buying a win­dow from a Canadian manufacturer, simply choose the highest E. R. possible.

SITE SPECIFIC: THE BEST APPROACH

Engineers and efficient-house designers use complex modeling software to evalu­ate the effect of window options on energy consumption. Rather than buying the same window for an entire house (as you would using Energy Star guidelines or the Efficient Windows Cooperative website), they tune the windows to optimize glass performance for each orientation.

The average homeowner or contractor can model the energy performance of a house and compare the effects of different windows with RESFEN, a free software pack­age from the Department of Energy’s Law­rence Berkeley National Laboratory (http:// windows. lbl. gov/software/resfen/resfen .html). Unfortunately, to get the most out of the program, you’ll have to slog through the manual.

Generally, in heating climates, south­facing windows have a high SHGC (greater than 0.5), and east – and west-facing win­dows have a low SHGC (less than 0.3) to prevent solar gain in the summer.

Until recently, common wisdom was that the SHGC on north-facing windows should match east – and west-facing windows, but software modeling has shown that high – SHGC north-facing windows don’t lose any energy.

STRUCTURAL DESIGN OF DRAINAGE PIPES

5.8.1 General Considerations

The structural capacity of an underground structure and the methods of determining that capacity are dependent upon the material properties of the structure and its physical configuration. In this context, the structure is the composite structure comprised of the pipe and the surrounding soil. The surrounding soil is generally referred to as the soil envelope, and buried structures rely upon the soil envelope for their ability to with­stand loads.

Under load, the pipe will deflect laterally and mobilize the passive resistance of the surrounding soil. Also, the pipe and surrounding soil will settle and the pipe will deflect to varying degrees. The relative movement of the pipe and soil results in the stiffer component attracting load and the less stiff component shedding load. This phe­nomenon is called soil-arching and is a fundamental consideration in the pipe-soil system. A study of the soil-structure interaction is necessary for an adequate solution to the buried structure problem.

Pipes are generally classified as either rigid or flexible, depending on their bending stiffness. For a round pipe under load without the benefit of the soil envelope, deflec­tion due to bending is proportional to D^/EI, where D is the diameter, E is the modulus of elasticity, and I is the moment of inertia of the wall cross-section. EI is the wall­bending stiffness. Concrete and clay pipe usually have a relatively thick wall and a high bending stiffness, and are referred to as rigid pipe. Corrugated metal pipe and plastic pipe have much thinner walls and lower bending stiffness, and are referred to as flexible pipe. Any discussion of the structural capacity of the pipe must also discuss whether the pipe is flexible or rigid (these are the only two options), since the design methods for each vary significantly.

Rigid pipe, unless designed by the empirical D-load method, is designed for moment, thrust, and shear. Corrugated metal pipes can generally be designed for thrust alone. Plastic pipes are designed for thrust, deflection, and bending stress and strain.

The combination of dead and live loads causes variable pressures on the installed pipe. As illustrated in Fig. 5.29, the dead load pressure increases with an increase in cover height, whereas the live load decreases with an increase in cover height. For highway loads, this results in a minimum load on the structure when there is approxi­mately 4 to 5 ft (1.22 to 1.52 m) of cover. Standard designs for underground structures may be found in industry publications with minimum and maximum cover heights indi­cated. However, when a structure is designed for a site-specific cover height, the designer should be aware that future changes in roadway elevation may cause increased loading conditions.

Figure 5.30 shows the nomenclature generally used for culvert design and installa­tion. The supporting soil beneath the culvert is the foundation, and the bedding is that

STRUCTURAL DESIGN OF DRAINAGE PIPES

FIGURE 5.29 Design pressures for metal culverts under earth dead load and

H 20 highway live load. Conversions: 1 ft = 0.305 m, 1 lb/ft2 = 0.0479 kPa. (From Handbook of Steel Drainage and Highway Construction Products, American Iron and Steel Institute, 1994, with permission)

STRUCTURAL DESIGN OF DRAINAGE PIPES

FIGURE 5.30 Pipe installation terminology. (From Design Data 40, American Concrete Pipe Association, 1992, with permission)

portion of the foundation in contact with the bottom of the pipe. The springline of the pipe is located at the location of maximum span. For a circular or elliptical pipe, this occurs at midheight. The haunch is the zone between the springline and the invert. The soil placed and compacted around the culvert is known as the backfill, or sometimes as the sidefill. The bedding and backfill are collectively referred to as the embedment.

In 1997 AASHTO published the first edition of the LRFD Bridge Design Specifications, and in 2007 the fourth edition. The goal of AASHTO is to use only the LRFD design code for new construction. However, the more traditional methods are currently more widely used for pipe design.

Sampling of Soil and Soil Water

Having entered the soil environment near roads, contaminants will either be retained in the soil or transported through the soil. Depending on soil characteristics and other environmental conditions, different contaminants are transported with the soil
water through the soil at varying rate. Mobile compounds (such as chloride) move rapidly whereas many heavy metals and organic contaminants move much slower. Often, contaminant concentrations are much higher in the upper soil layers than further down the soil profile.

Sampling of soil water gives a picture of the rate of transportation of contami­nants down a soil profile whereas sampling of soil gives a picture of the contaminant quantities having accumulated in the various soil layers over a long period of time.

Seepage and soil water (pore-retained water) can be sampled, although with less ease than groundwater below the water table. There, suction lysimeters (also called tension lysimeters) may be used. In principle, the soil water is sucked out of the soil through a lysimeter body that acts as a membrane or filter (Fig. 7.7). These devices include a high air-entry porous tip inside which a partial vacuum may be applied via a flexible pipe connected to an external vacuum pump. By this means water is pulled into the tip and, after collection, is sampled by gravity when possible or by gas displacement. For heavy-metal sampling, lysimeters should be made of Teflon, glass, PET or other material unable to sorb the metals. The flux of contaminants down the soil profile is often of interest. Since tension lysimeters give information on concentrations only, water volumes have to be measured separately or modelled so as to make calculations of pollutant fluxes possible.

Besides the more classical methods of soil water sampling, alternative road sur­face infiltration samplers have been designed in which water seeps from the road surface down and goes through separate layers of pavement and embankment to­wards a circular “funnel” (Sytchev, 1988). The device is installed during pavement construction with the layers of pavement being placed over the top of the sampling inlet. Two layers of siliceous sand of different grain sizes are situated there on fine – mesh screens to prevent entrance of solids to a sampling bottle where the seeping water is collected. The water amount in the sampling bottle is detected by measur­ing resistance (conduction sensor). There are two small metal pieces in the bottle; resistance between them is different when there is air or water. When a sufficient

amount of water has been collected in the sampling bottle, a gas (commonly N2) is injected into the bottle so as to close the valve under the funnel. The water specimen is then forced back to the surface and runs into the sampling bottle (Fig. 7.8a, b).

I = bore hole in road pavement and embankment

2=cement bed 3=sampling bottle (glass)

4 = plug (plastic)

5 = pipe for gas

6 = pipe for water sample 7=sand filter

8=electrical conduction sensor 9=quick-acting coupling (blue for water)

10 = quick-acting coupling (black for gas)

II = connector for conduction sensor

Soil sampling can be performed in any season, except in periods of frost. Sam­pling from consecutive soil depths gives information on the displacement of ac­cumulated pollutants down the soil profile. Natural upper soil profiles are usually richer in organic matter content favouring the retention of several pollutants, namely heavy metals and organic pollutants. This pattern should be analysed in order to observe differences in contaminant content and behaviour across a soil profile. Usu­ally, soil samples are taken out using a steel cylinder of a given volume so as to allow volume-related physical and chemical analyses. Just as for water, soil samples should be transported without delay and kept cool.

To collect samples beneath pavements, a core hole will usually be required in the pavement surface. Drilling conventionally uses a water-cooled core cutter, but these should not be used when abstracting samples for chemical assessments as the water will be likely to change the chemical conditions in the underlying ground by introducing contaminants and/or diluting what was already there.

Seasoning the Timbers

How long to air-dry or season the timbers before use is a much-debated question. The best answer I have encountered is from contemporary timber framer and colleague Steve Chappell in his book A Timber Framers Workshop, listed in the Bibliography. Steve uses the term “curing” to describe the early stages of the seasoning process. He describes this initial phase:

Once the tree dies and is milled, the wood fibers begin to relax and take on their natural shape. There is usually an immediate reaction to being milled in the form of crowning, warping, or twisting, resulting from the inherent tension in the wood, but no shrinkage will occur until all of the free water (moisture in the cell cavities), and the bound water (moisture in the cell walls) begins to leave. (Chappell, 1998, p. 139)

Chappell says that 90 percent of these deformations due to natural stresses being relaxed will take place in the first six months, but adds that “the first eight to twelve weeks is the most rapid curing stage” and that “it is during these early stages that the most dramatic changes will take place.” (Chappell, pp. 139-140) My own experience with the new heavy timbers we used for our new Earthwood addition (Chapter 5) bears this out. I paid a little more for early delivery of the timbers, and the heaviest ones managed to get ten to twelve weeks of excellent drying conditions, a big plus. The white pine timbers were lighter to handle, kept their straightness, and shrunk only marginally on their breadth and width.

I used to think — I suppose I read it somewhere — that the old-time timber merchants would store wood for years to supply builders with dry timbers. Chappell says otherwise, that builders were “more concerned with properly curing their timbers and allowing them to season for as long as was practicable.” Emphasis mine.

To minimize twisting and other seasoning defects, get your timbers home from the sawmill as soon as possible after they are cut, and stack them in good parallel courses, with one-inch wooden stickers between the courses. Choose a flat, well-drained site without vegetation. (Mow the grass as needed.) If the timbers are already showing signs of mold when you get them to your site, you should lay them out individually in the sun for a few days to kill the fungus.

Wood rot, incidentally, is caused by fungi, which use the cellulose in wood as a food. But fungi also need a constant damp condition. If moisture content in wood is below about 18 percent, the fungi will not flourish, although the spores might remain alive, just waiting for more favorable times. This is why proper stacking of wood is so dependent on good ventilation, which is an excellent preventative to rot. This is also why exposed beams in a building are so resistant to fungi and rot: they enjoy superb ventilation. But back to the stacking.

Have a good quantity of dry stickers, which are lengths of regularly – dimensioned scrap wood, to place laterally between courses. They should be at least an inch thick to prevent mold, and at least three stickers should be used per course of wood with timbers up to ten feet long, and four or more with longer timbers. Each course in the stack should be made with timbers of the same vertical dimension. A tall stack is preferable to a wide stack, because the extra weight of the wood acts as a clamp to help minimize any twisting of the wood during the curing process. And put the timbers that you are going to use first on the top of the pile, not the bottom!

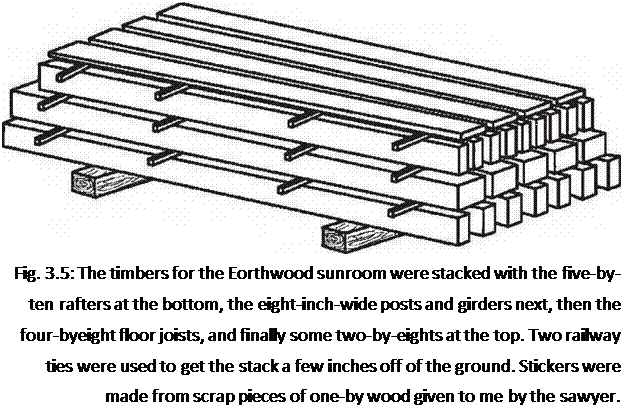
Подпись: Fig. 3.5: The timbers for the Eorthwood sunroom were stacked with the five-by-ten rafters at the bottom, the eight-inch-wide posts and girders next, then the four-byeight floor joists, and finally some two-by-eights at the top. Two railway ties were used to get the stack a few inches off of the ground. Stickers were made from scrap pieces of one-by wood given to me by the sawyer. “Sticker burn” or discoloration can occur where the stickers are placed. If you care about this, get a friend to help you restack the pile, top to bottom, twice during the curing, which, again, puts the first needed timbers on top. Move the stickers a few inches so as not to exacerbate the sticker burn. If you are planning on sanding all the timbers anyway, sticker burn is of less consequence.
I conclude this chapter with a picture of the way I stacked my timbers for our Earthwood sunroom project.

Thermal Protection

Moisture Problems Associated with Building Insulation

The addition of thermal insulation into wall cavities has had a major impact on moisture control in buildings. As buildings have become tighter and better insulated, the opportunity for water vapor to dry out from wall and roof

assemblies has been reduced. Trapped water leads to wall assembly failures.

Buildings in cold winter climates will tend to dry to the outside since moisture flows from the warm interior towards the cold exterior. Under these conditions, water vapor passing through insulated building assemblies will reach a temperature where it will begin to condense. If this condensation occurs before the vapor reaches the exterior of the building, the insulation will become wet. Most insula­tion acts like a sponge, collecting moisture that is unable to escape. If an adverse moisture condition persists, mold and rot will affect the structure even when inorganic fiberglass in­sulation has been used.

In hot, humid conditions the situation is
reversed but equally problematic. When hot, moist air is allowed to enter the wall from the outside, it may condense in the insulation as it approaches the colder, air-conditioned space.

The insulation alone does not create the problem, but because of its absorbent nature it will often augment the problem. The type of vapor retardant barrier and its position in re­lation to the insulation are critical in prevent­ing mold and rot from developing. The general principle is to install the vapor retardant bar­rier so that it prevents the travel of moisture into the insulated cavity without impeding the ability of the moisture to escape. The dilemma is that climatic conditions may vary widely on a daily and seasonal basis, creating mixed con­ditions. This makes insulation and moisture

HOISTING MATERIALS TO THE ROOF

HOISTING MATERIALS TO THE ROOFHere in the West, we try to order shingles the day before they will be installed. Suppliers arrive with a hoist and stack both shingles and felt paper directly onto the roof. An experienced delivery per­son knows to stack bundles of shingles about 6 ft. apart on both sides of the roof.
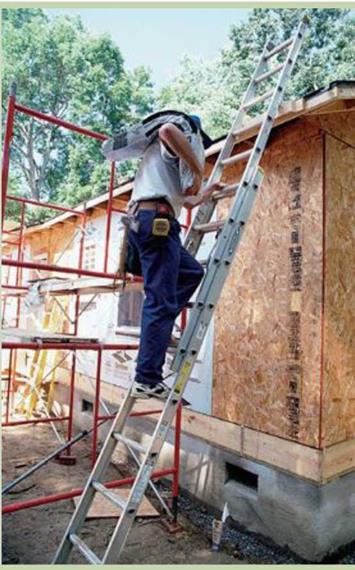
The other way to get shingles onto the roof is the hard way— hoisting one bundle at a time. If you must haul roofing shingles up to the roof yourself, make sure you have a secure ladder that is positioned properly and is 2 ft. to 3 ft. taller than the roof. It’s a good idea to nail a temporary 2x tread at the spot on the roof where you will step off the ladder. This tread provides a solid foothold where you need it most.

BUST THE BUNDLE. Shingles are much easier to carry if you “bust" the bundle first. Pick up a bundle and lay it across a sawhorse. Push down on both ends until the bundle curves downward. A curved bundle is easier and safer to carry on your shoulder than a straight, stiff one (see the photo at right).

Pick up the bundle by bending your knees and draping the bun­dle over your shoulder. This is not always easy, because a bundle of shingles can weigh as much as 80 lb. Ascend the ladder slowly and watch your balance. Don’t throw down bundles between rafters, or you could break the OSB sheathing. Just set them on the roof with­out a lot of force, and space the bundles so that they’re easy to grab while you’re shingling.

when the wind blows. Run these shingles up the gable ends, too. Remember to use shorter nails around the perimeter of the roof if the house has open eaves. Butt the starter shingles tightly to each other.

If you live in a very windy area, you can make the starter course even more secure with just a little extra effort. For the bottom layer of the starter course, cut off the three tabs on each shingle just below the tar strip. Snap a line the width of this narrower shingle around the roof’s perimeter. When you install the narrow shin­gles, the tar strip will be very close to the edge of the roof. Nail the narrow shingles 2 in. or so
from the roof’s edge with their tar strips down. When the sun heats up the tar strip, this layer of shingles will be sealed to the roofing felt below. STARTER COURSE, SECOND LAYER.

This shingle layer, and every subsequent course, is installed right side up (tabs down). Position the first row of regular shingles of this top layer flush with the lower edge of the bottom layer, with one of its short edges on the second vertical offset line. It doesn’t make any difference whether you go to the right or the left of the second vertical line—all that matters is that the tabs of this top layer are offset from the tabs of the bottom layer by 6 in. Nail each and every

shingle the same way. Use four ^-in. roofing nails and drive one nail about 1 in. from each edge and one nail above each slot. Drive all nails just below the tar strip and above the cutout. REMAINING COURSES. Start several courses of shingles, offsetting each by 6 in. This allows other shinglers to work in both directions. Hold each new course of shingles to the 5-in. horizontal mark above the last course, alternating shingle ends on the vertical marks. This establishes a pattern with a 6-in. offset on each shingle.

At vent pipes, install a roof jack, or metal flashing, over the vent to keep out water. Install shingles below the pipe’s centerline beneath the flashing. Install those above the centerline on top of the flashing (see the photo at right). The flashing can be nailed near the top corners of the tin, before shingles are laid on top of it. Don’t nail the bottom corners down, though, as this could cause the flashing to leak.

At the gable ends, cut the shingles to length before nailing them in position. Mark the length and cut them from the back with a utility knife. Rather than carrying a square, I use another shingle as a straightedge to guide the cut and a third shingle as a protective base below the cut. At the top, cut the shingles flush with the sheathing that was cut back to accom­modate the ridge vent.

WALLS AN! CE I..IN SS

The first house I helped build was in 1948, on the high plains of western Nebraska. It was a precut house, shipped by rail and brought to the job site on a large wagon pulled by a team of horses. Every piece of wood—wall plates, studs, headers, cripple studs, sills, braces, and joists—was wrapped and labeled in color-coded bundles. Putting the house together was like putting together a three-dimensional jigsaw puzzle.

Houses are still puzzles. All the different pieces have to be laid out, cut, and nailed together to create the frame. The sheathed floor or concrete slab acts as the "table" on which all the puzzle pieces are assembled. But puzzles go together easier when you have an idea of what the finished product will look like. So before pounding the first nail, study the plans thoroughly and develop a picture of the house in your mind.

LAYING OUT WALLS

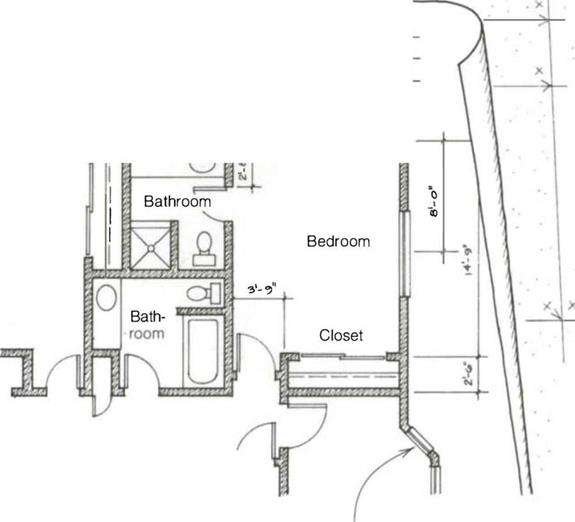
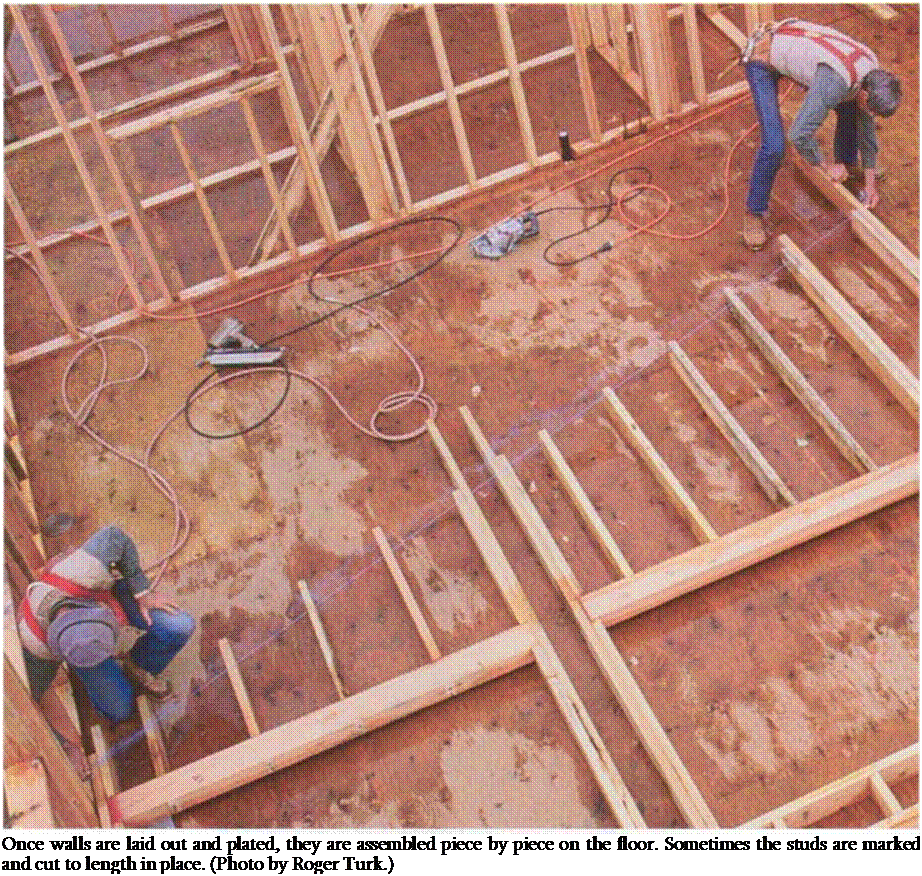
Framing walls is a challenging task for a beginning carpenter (see the photo on the facing page). The first steps—laying out the location of every wall and snap­ping chalklines to transfer the floor-plan dimensions to the slab or subfloor—are critical (see the drawing on p. 104). Once the house is framed, these wall – layout lines become bedrooms, bath­rooms, and kitchens. If walls are out of square or not parallel, cabinets won’t fit properly, floor tiles will have to be cut, and even the roof ridge may run downhill. At this point, accuracy is more important than speed.

Exterior walls

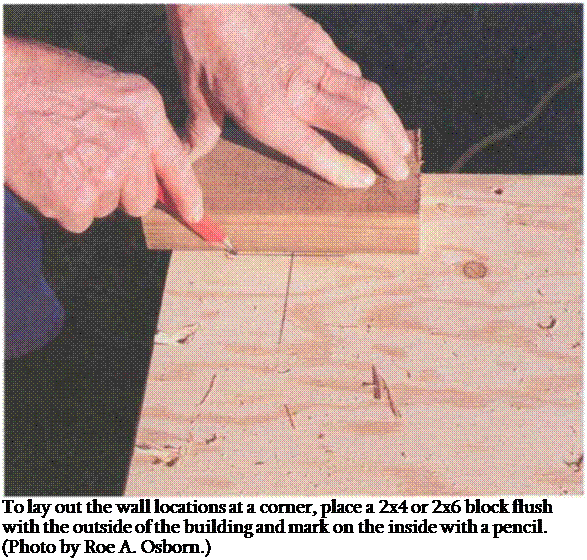
Before you get out your tape measure or chalkline, sweep the floor to get the deck clean for the layout. Start by snap­ping the location of two long exterior walls that are at right angles to each other. Get these two long walls laid out right, and you can measure the location of all the other walls off them. Once you pick a wall, measure in ЗУ2 in. for 2×4 construction or 5У2 in. for 2×6 construc­tion. Then mark the slab or subfloor with a carpenter’s pencil or keel exactly where the wall will stand. Or you can lay a short piece of 2×4 or 2×6 at both ends and mark the inside (see the photo on p. 105). Connect these two marks with a chalkline. Keep it all clear and simple; don’t complicate the puzzle.

After snapping a chalkline for the first wall, lay out the perpendicular wall.

Be sure to check that the walls are perpendicular, especially if you’re work­ing on concrete. Don’t trust that a slab is square. Instead, use the 6-8-10 method (see p. 87) to check for accuracy.

Подпись: Once walls are laid out and plated, they are assembled piece by piece on the floor. Sometimes the studs are marked and cut to length in place. (Photo by Roger Turk.)
As you lay out the remaining exterior walls, note that their dimensions are often given from outside to outside. Look closely to see whether a measure­ment is from outside to outside, outside to center, center to center, or wall to wall.

You don’t have to strive for total perfec­tion when building the house frame. It’s okay to leave walls a tiny bit out of par­allel (like A in. in 12 ft.). But walls out of parallel by V2 in. in 12 ft., for example, need adjusting. To do this, go to one end of the floor or slab and measure in

Bathroom

xI ‘

/

Jf— X –

2*C, Я

Exterior wall


/


Bedroom


7


/


X I A


– Bathroom


Closet


WALLS AN! CE I..IN SS

Подпись: </Подпись: <=,4-'- о1Подпись: уПодпись: Plan drawingПодпись: Exterior wallWALLS AN! CE I..IN SSWalls laid out
on. deck

Keep a close eye on the plan as you lay out first exterior walls and then interior walls. For instance, if the plan shows an interior wall is 12 ft. 7 in. from the outside of an exterior wall, remember to add 13/4 in. to the dimen­sion of the interior walls, which will be 12 ft. 8% in. from outside to outside.

Подпись:

35/s in. at both corners. This increases the width by Va in. Then go to the other end and measure in 33/s in. at each cor­ner. This narrows the width by Va in. The walls are now parallel. At this point, there is no need to pay attention to door or window locations.

Guidelines for Culvert Selection

The following general guidelines from the Federal Lands Highway (FLH) manual should assist in determining appropriate culvert material types and necessary coatings. Other methods are available. Many state departments of transportation and local governmental agencies have published durability criteria, and this information should be used where available. A materials engineer should be consulted for important applications. Of course, the final selection must provide for structural requirements as discussed in Art. 5.8.

Concrete Pipe. Where the pH is less than 3.0 and the resistivity is less than 300 U • cm, reinforced concrete pipe should not be specified. If the sulfate concentration exceeds 0.2 percent in the soil or water, type V cement should be specified. If the sulfate con­centration exceeds 1.5 percent in the soil or water, an increased cement ratio using type V cement should be specified. The concrete cover over the reinforcement or the cement factor should be increased where there is severe abrasion.

Table 5.11 gives the minimum water side pH permitted for a concrete pipe culvert to obtain either a 50- or 75-year design service life. The table is based on research con­ducted by the Ohio Department of Transportation. Pipe size, barrel slope, and water side pH are statistically significant variables. It is interesting to note that the Ohio study found resistivity to not be a statistically significant variable.

Steel Pipe. Figure 5.28 shows a chart for determining the service life of a galvanized steel culvert under nonabrasive and low abrasive conditions. The average service life of

Minimum pH to attain
design service life*

TABLE 5.11 Requirements for Concrete Pipe Protection

Pipe slope

Pipe rise, in

Pipe rise, mm

50 yr

75 yr

Less

<42

<1050

3.0

3.3

than 1%

42-72

1050-1800

3.8

4.1

>72

> 1800

4.2

4.5

1-3%

<42

<1050

3.2

3.5

42-72

1050-1800

4.1

4.4

>72

> 1800

4.6

5.0

3-10%

<42

<1050

3.6

3.9

42-72

1050-1800

4.5

4.9

>72

> 1800

5.0

5.4

Greater

<42

<1050

4.0

4.5

than 10%

42-72

1050-1800

5.0

5.5

>72

> 1800

5.5

6.0

*Based on Eq. (4) from Transportation Research Record 1008 Article “Field Performance of Concrete Pipe Culverts at Acidic Flow Sites in Ohio.” For stream flow with a pH less than the minimums listed above, epoxy-coated concrete pipe is required.

Source: From Location and Design Manual, Vol. 2: Drainage Design, Ohio Department of Transportation, with permission.

Подпись: 416Guidelines for Culvert Selection

Specified thickness, in (mm)

0.052 (1.32)

0.064 (1.63)

0.079 (2.01)

0.109 (2.77)

0.138 (3.51)

0.168 (4.27)

Factor

0.8

1.0

1.2

1.7

2.2

2.6

(b)

FIGURE 5.28 Method for estimating service life of plain galvanized steel culverts, (a) Service life chart for 0.064-in (1.63 mm) thickness based on invert performance, (b) Conversion factors for other thicknesses. (From Project Development and Design Manual, FHWA, with permission)

culvert with a wall thickness of 0.064 in (1.62 mm) is displayed in terms of pH and resistivity in Fig. 5.28a. For culverts with other wall thicknesses, obtain the service life from the chart and multiply by the factors in Fig. 5.28b. Use the chart for both the out­side conditions and the inside (water side) conditions and base the design on the worst case. Generally, the inside condition controls.

For steel with a type 2 aluminum coating, the FLH manual assigns a greater service life under certain conditions. For nonabrasive and low abrasive flow, where the resis­tivity is equal to or greater than 1500 П • cm and the pH is between 5 and 9, alu­minized steel is considered to provide a service life twice that of galvanized steel as determined from Fig. 5.28.

Protective Coatings on Steel Pipe. Under nonabrasive and low abrasive conditions, the service life of galvanized steel culvert can be extended by application of protective coatings. For example, when the water side environment controls the pipe thickness, application of an asphaltic coating (a postfabrication coating by the pipe manufacturer) can add 10 years of service life to the culvert, and an application of an asphaltic paved invert in addition to the coating will add a total of 25 years. If the soil side controls, application of the asphaltic coating will add 25 years of life. Concrete lining will add 25 years of service life. Ethylene acrylic acid film coatings (a polymer precoat on the galvanized coil) with a 10-mil (0.25-mm) thickness can be expected to provide an additional 30 years of service life. Currently, there are insufficient data to predict the performance of ploymer precoated pipe under severely abrasive conditions. Concrete pavings can be designed to add service life.

Aluminum Pipe. Under nonabrasive and low abrasive conditions, where the resistiv­ity is equal to or greater than 500 H • cm and the pH is between 4 and 9, aluminum culverts can be assumed to have a service life of 50 years when the metal thickness is appropriately sized for structural adequacy.

Design for Abrasion. In moderate abrasive environments, the sheet thickness for both steel and aluminum pipes should be increased by one nominal thickness, or the invert should be protected. In severe abrasive conditions, the sheet thickness should be increased by one nominal thickness and the invert should be protected. Invert protection under severe abrasive conditions may consist of metal rails or energy-dissipating devices at the inlet. Under moderate abrasive conditions, invert protection may consist of (1) paving with port­land cement concrete or (2) asphaltic coating and invert paving with bituminous concrete.

Plastic Pipe. Under most environmental and abrasive conditions, polyethylene and polyvinyl chloride plastic pipes may be specified without regard to the pH and resis­tivity of the site. Invert protection may be required under some abrasive conditions.

Example: Minimum Thickness of Galvanized Steel Culvert. The design service life for the culvert has been set at 50 years. A site investigation of a potential location shows that the soil has a pH of 7.2 and a resistivity of 5000 П • cm. The water flow shows a pH of 6.8 and a resistivity of 4000 П • cm. Determine the minimum sheet thickness for durability.

Outside condition. In Fig. 5.28a, find the intersection of the vertical line for

5000 П • cm with the inclined line for 7.2 pH, and read the average service life of

52 years from the vertical scale at the left.

Inside condition. In like manner, for a resistivity of 4000 П • cm and a pH of 6.8,

find the average service life of 42 years.

In this example, the inside conditions control the design, and the thickness must be increased. For the 0.064-in (1.63-mm) sheet thickness, the ratio of the design service life to the anticipated service life is 50/42 = 1.2. From Fig. 5.28b, the multiplying factor is 1.2 for a thickness of 0.079 in (2.01 mm). Therefore, a thickness of 0.079 in (2.01 mm) should provide the desired service life of 50 years.

An alternative is the application of an asphaltic coating, which can add 10 years of service life when the inside condition controls. For the 0.064-in (1.63-mm) sheet thickness, 42 + 10 = 52 years. Therefore, consider an 0.064-in (1.63-mm) sheet thickness with an asphaltic coating.

Circular Stairs

Circular stairs are not as difficult as they seem the first time you think about doing them. They do, however, take some planning and careful work. There is no one way that curved stairs need to be built, as long as they are strong enough to bear the traffic. The method that follows is commonly used.

First of all, unlike straight stairs, we will not use stringers. Instead, each tread will be supported independently, by either a wall or a header. The header method allows for space to be usable under the stairs. The system outlined here uses a header to create what are called tread walls.

• It is not uncommon for a set of plans to be drawn up with the stair headroom less than the 6′-8" that the code requires. To check the headroom before you frame the stairs, you need to find the point that is plumb, down from the lowest point above the stairs, and then measure to the line in a plane with the nosing of your stair treads.

• Since the stairs are not built yet, the hardest part is finding that nosing plane. You can either work off the plans, if framing has not started, or work with the framing if the frame is ready for the stairs. To find this plumb point on the nosing plane, start from the first nosing, count the number of risers, and multiply that number by the riser height; then add the partial riser.

• To get the partial riser height, you just multiply the partial tread length by the riser percent, which is the riser height, divided by the tread length. Once you have found this length, you can measure either up or down, depending on which direction you used, to see if you have enough headroom.

8 Steps for Building Circular Stairs

1) Find Riser Height

To get started, you first need to find your riser height. Quite often it is given on the plans, in which case you want to check it to make sure it works with the actual floor heights. If the height is not given on the plans, consider the following points when figuring the riser height.

• As with straight stairs, you want the steps to feel comfortable, so remember:

— Make sure all risers are equal, so the stairs
will not cause people to trip and fall.

Drawing the circumference lines

— The lower the riser, the longer the tread needs to be to feel comfortable.

• Common dimensions for riser and tread on straight stairs are 7" for the riser, and 10%" for the tread.

• For circular stairs, the tread width varies, so it is more difficult to figure the riser and tread dimensions.

• The comfortable range for circular stairs is harder to determine than the range for straight stairs because of the varying tread width.

The code for residential buildings requires a minimum of 6" at the narrow end and 11" at a point 12" out from the narrow end. For other buildings, the code requires a minimum of 10" at the narrow end and 11" at a point 12" out from the narrow end. Because most of the length of the tread is greater than 11", the rise will typically feel more comfortable if it is less than it would be for a comparable straight stair.


2) Mark the Circumference Lines

With the rise figured out and the number of treads known, you can start marking your circumference lines. The best way to start is by making the stair footprint on the floor in the position where the stairs are going to be built. If the plans show a radius dimension and location, then you can use the plans to locate the radius center point. To make your circumference lines (which represent your stairs and the walls on the sides of the stairs), set a nail part­way at the located radius center point. Then hook your tape to the nail and mark your circumference lines by swinging your tape around the nail and holding your pencil on the required dimension.

(See photo.) Most tape measures have a slot in the hooking end for a nail head. (See illustration later in this section.)

If the radius or the radius center point is not given, you will need to find it. You can vary the radius length, but make sure you can maintain the following four requirements:

• 6" minimum tread width at the narrow end of the tread (10" in non-residential).

• 11" tread width at a point 12" in from the narrow end.

• A minimum stair width of 36" in the clear to finish.

• In non-residential buildings, the smaller radius should not be less than twice the width of the stairway.

ohod

osytodicvu

End of tape hooked to a partially set nail

The first thing you need to do to find your radius is to establish two points on the circumference opposite each other. They can be any two points. Look on the plans for points that are already established. If there are no established points, then select points that fit with the location of the stairs. Once you have established two points, it is merely a matter of bisecting the line between these points, finding the radius origin, and drawing your circumference lines from the radius origin. (See the “Bisecting a Line to Establish the Radius Origin" illustration.)

3) Marking the Tread on the Footprint

Now that you have your circumference lines, you need your tread lines. Since you have figured your riser height, you know the number of treads that you will have. Knowing the number of treads, you can find the exact tread point along your stair circumference. To do this, divide the stair circumference in half, and then divide those halves in half again and again until you are down to single treads. (See “Divide Circumference for Treads" illustration.)

If your stair has an uneven number of treads, then you have to subtract one tread before you begin dividing into halves. To subtract one tread, you first have to know the width. The width will be equal to the total stair circumference length divided by the number of treads.

It is difficult to measure the stair circumference, and so your one tread will probably not be exact. Therefore, when you are done marking all the other treads, re-mark the tread you measured first.

Once you have all your division points for the treads, then chalk lines from the radius center point through the division points to the longest circumference line, and those lines will make your tread footprint. (See “Tread Footprint" illustration.)

4) Cut Bottom Plate

The bottom plate of the tread walls will not be parallel to the top plate, as it would be in a straight stair. The bottom plate will follow the circumference and serve as the bottom plate for all the tread walls. A good way to make the bottom plate is to use two pieces of %” plywood. If the radius is not too small, you can cut the plywood with a circular saw. To mark on the plywood, set a nail anywhere and mark the plywood with a pencil and a tape measure. Use the dimensions from the stair footprint to get the radius length.

5) Nail Bottom Plate in Place

To build the stairs, start by nailing the bottom plates in place. (See “Bottom Plate Nailed in Place" illustration.)

6) Build the Tread Walls

The walls supporting the treads will be built as header walls. Built this way, they will provide the riser and allow space for storage below the stairs.

The wall will consist of a 2 x 12 single header that will serve as the riser, a top plate, a double plate, trimmers for under the 2 x 12 header, and king studs next to the trimmer. A ledger to support the tread below will be nailed onto the header. (See “Section of Tread Wall from End" illustration.)

Each tread wall should be higher than the one below it by the riser height. The height of the first step will have to be figured separately to equal one riser height, adjusted for any difference in floor covering. The top step might also have to be adjusted for a difference in floor height.

7) Install the Tread Walls

Nail the tread walls in place using the footprint lines. The bottom of the studs will be toenailed into the bottom plate already in place. (See “Tread Walls Nailed in Place" illustration.)


8) Cut and Nail Treads

The treads should all be the same. They will be nailed onto the top of the tread walls and the ledgers. An equal nosing should be maintained the full length of the tread. Make sure the walls stay plumb both ways. Glue each tread to prevent squeaks. (See “Treads Halfway Up Stairs" illustration.)

Abrasion

Abrasion causes a loss of section thickness due to impacts by the aggregate carried by stream flow. Protection from abrasion generally takes the form of providing a sacrifi­cial thickness of the structural material, whether it be a thicker sheet of steel or con­crete paved invert for metal pipe, or more concrete cover over the reinforcement for reinforced concrete pipe. Alternatives to providing for a thicker section include using debris control structures to prevent the abrasive material from reaching the culvert, and providing metal planking longitudinally along the invert as a separation between the bed load and the bottom of the culvert.

Abrasion can be considered in four levels of severity as categorized by streambed velocity and general aggregate size. Protective measures, particularly in the invert, should increase with increasing levels of abrasion as discussed subsequently. (See Project Development and Design Manual, Federal Lands Highway, FHWA.)

Level 1, termed nonabrasive, has very low flow velocities and no bed load.

Level 2, low abrasive, has flow velocities of 5 ft/s (1.5 m/s) or less and light bed load consisting of sand.

Level 3, moderately abrasive, has flow velocities of between 5 and 15 ft/s (1.5 and 4.5 m/s) and moderate bed loads consisting of sand and gravel.

Level 4, severely abrasive, has flow velocities exceeding 15 ft/s (4.5 m/s) and heavy bed loads consisting of sand, gravel, and rock.

The projected velocities should be based upon a typical flow and not upon the design flood for which the culvert has been designed. The bed load size may be determined by visual inspection of the surrounding environment and the upstream channel. Sampling of the aggregate for a gradation analysis is not necessary.