Inspection of Flexible Structures

A flexible structure should be checked to ensure that the cross-sectional shape it was designed for is intact. If the flexible culvert, whether it is a round pipe, a pipe arch, an arch, a horizontal ellipse, or any other structural shape, deflects from its design shape, it is not receiving the required support from the backfill. It is assumed in the design of flexible structures that moment in the structure is negligible and that due to the thrust forces, the structure is in compression throughout. If the deflection is large enough to cause a flattening of the structure, these assumptions will not hold true and the struc­ture may collapse. Larger structures with large top radii, such as long-span structures, can withstand a smaller percentage of deflection before reverse curvature occurs than can round structures.

Visual observations of the culvert shape may reveal only large distortions and deflections; deformations may not be readily apparent until they reach approximately 10 percent. For this reason, if excessive deflections in the cross-sectional shape are sus­pected, physical measurements should be taken and documented with changes over time. Reference points should be permanently marked, and for a corrugated structure, measurements should be taken to inside corrugations for consistency. General deflec­tions of round pipe greater than 5 percent should be investigated and monitored; reversal of curvature is expected at 20 percent for a metal culvert, but it may occur at a lesser value for a large structure. Localized flat spots or reversals of curvature are matters of special concern. It is necessary to determine, over time, if the structure deflection has stabilized. This information is critical in determining how serious the deflection is, if rehabilitation is necessary, and in determining if the rehabilitiation method needs to offer additional structural support to the culvert. A computer program is available to aid in the investigation and evaluation of multiple-radius metal structures. (See D. C. Cowherd et al., “Application of the Program MULTSPAN/SOILEVAL to Analyze Problem Structures,” Proceedings of the Second Conference on Structural Performance of Pipes, Ohio University, Athens, Ohio, 1993, A. A. Balkema, Rotterdam, 1993.)

All metal culverts should be investigated for evidence of corrosion and erosion. With a general loss of section there will be an accompanying loss of structural capacity. Wear will first be noted by a loss of the galvanized or other coating. If this occurs, then the unprotected metal may be expected to deteriorate more rapidly because of the erosive effects of the bedload. Corrugated metal pipe should be checked to ensure joint integrity (see Art. 5.11.4).

Bolted longitudinal seams of structural-plate culverts should be inspected for cocking, cracking, and bolt tipping. Cocking occurs where the structure deflects inward at the seam, causing a significant change in the structure’s shape or appearance. This may be caused by improper erection or fabrication of the plates and can result in loss of back­fill due to piping and a reduced allowable compression strength of the structure due to the distortion. Cracking may occur where there is excessive deflection at the seam. This could ultimately lead to a disjointing, which would result in loss of ring thrust.

Bolt tipping is rare; it occurs where the plates slip because of high compressive forces. However, if the structure is under high fill and the plates slip, the bolt holes could become elongated, with the result that the bolt is eventually pulled through the plate.

Plastic pipe should be inspected for excessive deflection, joint integrity (see Art. 5.11.4), and cracking.

Failure Characteristics

Any system will fail eventually; it is just a matter of time. Owing to the presence of many uncertainties that affect the operation of a physical system, the time the system fails to perform its intended function satisfactorily is random.

5.1.1 Failure density function

The probability distribution governing the time occurrence of failure is called the failure density function. This failure density function serves as the common thread in the reliability assessments by TTF analysis. Referring to Fig. 5.1, the reliability of a system or a component within a specified time interval (0, t], can be expressed, assuming that the system is operational initially at t = 0, as

/

TO

ft (t ) dr (5.1a)

in which the TTF is a random variable having ft(t) as the failure density func­tion. The reliability ps (t) represents the probability that the system experiences

Подпись: Figure 5.1 Schematic diagram of reliability and unreliability in the time-to-failure analysis.

no failure within (0, t]. The failure probability, or unreliability, can be ex­pressed as

Pf (t) = P(TTF < t) = 1 – pa(t) = ft(t) dr (5.1b)

0

Подпись: ft (t) Подпись: d [ps (t)] d [pf (t)] dt dt Подпись: (5.2)

Note that unreliability pf (t) is the probability that a component or a system would experience its first failure within the time interval (0, t]. As can be seen from Fig. 5.1, as the age of system t increases, the reliability ps(t) decreases, whereas the unreliability pf (t) increases. Conversely, the failure density func­tion can be obtained from the reliability or unreliability as

The TTF is a continuous, nonnegative random variable by nature. Many contin­uous univariate distribution functions described in Sec. 2.6 are appropriate for modeling the stochastic nature of the TTF. Among them, the exponential distri­bution, Eq. (2.79), perhaps is the most widely used. Besides its mathematical simplicity, the exponential distribution has been found, both phenomenolog­ically and empirically, to describe the TTF distribution adequately for com­ponents, equipment, and systems involving components with a mixture of life distributions. Table 5.1 lists some frequently used failure density functions and their distributional properties.

Time-to-Failure Analysis

5.1 Basic Concept

In preceding chapters, evaluations of reliability were based on analysis of the interaction between loads on the system and the resistance of the system. A system would perform its intended function satisfactorily within a specified time period if its capacity exceeds the load. Instead of considering detailed in­teractions of resistance and load over time, in a time-to-failure (TTF) analysis, a system or its components can be treated as a black box or a lumped-parameter system, and their performances are observed over time. This reduces the relia­bility analysis to a one-dimensional problem involving time as the only variable describable by the TTF of a system or a component of the system. The time – to-failure is an important parameter in reliability analysis, representing the length of time during which a component or system under consideration re­mains operational. The TTF generally is affected by inherent, environmental, and operational factors. The inherent factors involve the strength of the materi­als, manufacturing process, and the quality control. The environmental factors include such things as temperature, humidity, air quality, and others. The operational factors include external load conditions, intensity and frequency of use, and technical capability of users. In a real-life setting, the elements of the factors affecting the TTF of a component are often subject to uncertainty. Therefore, the TTF is a random variable.

In some situations, other physical scale measures, such as distance or length, may be appropriate for system performance evaluation. For example, the reli­ability of an automobile could be evaluated over its traveling distance, or the pipe break probability owing to the internal pressure or external loads from gravity or soil could be evaluated based on the length of the pipe. Therefore, the notion of “time” should be regarded in a more general sense.

TTF analysis is particularly suitable for assessing the reliability of systems and/or components that are repairable. The primary objectives of the reliability analysis techniques described in the preceding chapters were the probability of

Copyright © 2006 by The McGraw-Hill Companies, Inc. Click here for terms of use.

the first failure of a system subject to external loads. In case the system fails, how and when the system is repaired or restored are of little importance. Hence such techniques are often used to evaluate the reliability of nonrepairable systems or the failure probability when systems are subject to extraordinary events. For a system that is repairable after its failure, the time period it would take to have it repaired back to the operational state, called the time-to-repair or restore (TTR), is uncertain.

Several factors affect the value of the TTR and include personal, conditional, and environmental factors (Knezevic, 1993). Personal factors are those repre­sented by the skill, experience, training, physical ability, responsibility, and other similar characteristics of the personnel involved in the repair. The con­ditional factors include the operating environment and the extent of the fail­ure. The environmental factors are humidity, temperature, lighting, noise, time of day, and similar factors affecting the maintenance crew during the repair. Again, owing to the inherently uncertain nature of the many elements, the TTR is a random variable.

For a repairable system or component, its service life can be extended indefi­nitely if repair work can restore the system like new. Intuitively, the probability of a repairable system available for service is greater than that of a nonre­pairable system. Consider two identical systems: One is to be repaired after its failure, and the other is not to be repaired. The difference in probability that a system would be found in operating condition at a given instance would become wider as the age of the two systems increased. This chapter focuses on the characteristics of failure, repair, and availability of repairable systems by TTF analysis.

Gram-Schmid Ortho-normalization

Consider a vector x 1 in an K-dimensional space to be used as one of the basis vectors. It is desirable to find the additional vectors, along with x 1, so that they would form K orthonormal basis vectors for the K-dimensional space. To do that, one can arbitrarily select K – 1 vectors in the K-dimensional space as x 2, x3, …, xK.

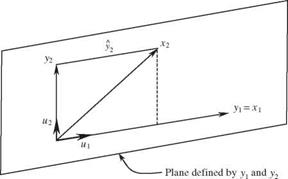
The first basis vector can be obtained as u1 = x 1/|x1|. Referring to Fig. 4D.1, a second basis vector (not necessarily normalized) that will be orthogonal to the first basis vector u1 can be derived as

У 2 = x2 – У2 = x2 – (x2«0«1

Therefore, the second normalized basis vector u2, that is perpendicular to u2 can be determined as u2 = y2/|y2|.

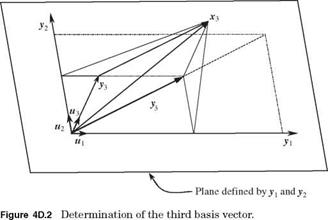
Note that the third basis vector must be orthogonal to the previously deter­mined basis vectors (u1, u2) or (y 1, y 2). Referring to Fig. 4D.2, the projection of x 3 onto the plane defined by y1 and y 2 is

Уз = (x 3u1) u1 + (x 3u2) u2

Gram-Schmid Ortho-normalization

Figure 4D.1 Determination of the second basis vector.

Gram-Schmid Ortho-normalization

Therefore, the third basis vector У3 that is orthogonal to both y1 and y2 can be determined as

Уз = xз – Уз = xз – [(x“1 + (x3^)“2]

and the corresponding normalized basis vector u3 can be determined as u3 = У3/ІУ3І-

Подпись: Ук = xk -
Подпись: ~ k xk №i) i=1 Подпись: for k = 2,3,..., k Подпись: (4D.1)

From the preceding derivation, the kth basis vector yk can be computed as

In the case that x2, x3,…, xK are unit vectors, the basis vectors У2, У3,…, УК obtained by Eq. (4D.1) are orthonormal vectors. It should be noted that the results Gram-Schmid orthogonalization is dependent on the order of vectors x2,x3,…,xK selected in the computation. Therefore, the orthonormal basis from the Gram-Schmid method is not unique.

The preceding Gram-Schmid method has poor numerical properties in that there is a severe loss of orthogonality among the generated yk (Golub and Van Loan, 1989). The modified Gram-Schmid algorithm has the following steps:

1. k = 0.

2. Let k = k + 1 and yk = xk, for k = 1. Normalize vector yk as uk = yk/|yk |.

3. For k + 1 < j < К, compute the vector of xj projected on uk:

У] = (x j uk)uk and the component of xj orthogonal to ui as

У j = xj – yj = xj – (xj – uk) uk

4. Go to step 2 until k = К.

4.1 Refer to Sec. 1.6 for the central safety factor. Assuming that both R and L are independent normal random variables, show that the reliability index в is related to the central safety factor as

MSF – 1

mSf QR + QL

in which Qx represents the coefficient of variation of random variable X.

4.2 Referring to Problem 4.1, the central safety factor can be expressed in terms of reliability index в as

Подпись: MSF1 + в Qr + Q – в2qR QL 1 – e2oR

4.3 Referring to Problem 4.1, how should the equation be modified if the resistance and load are correlated?

4.4

Подпись: SFc Подпись: 1 + zp QR 1 - Zq QL Подпись: MSF

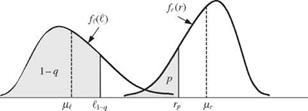
Refer to Sec. 1.6 for the characteristic safety factor. Let Ro be defined on the lower side of resistance distribution as Ro = rp with P(R < rp) = p (see Fig. 4P.1). Similarly, let Lo be defined on the upper side of load distribution with Lo = t1-q. Consider that R and L are independent normal random variables. Show that characteristic safety factor SFc is related to the central safety factor as

in which Zp = Ф 1(p).

4.5 Define the characteristic safety factor as the ratio of the median resistance to the median load as

SF = Г05 = Г

^0.5 t
Gram-Schmid Ortho-normalization
where Г = r0.5 = F_-1(0.5)and t = to.5 = F_-1(0.5), with Fr(■) and Fl(-) being the CDFs of the resistance and load, respectively. Suppose that the resistance R

and load L are independent lognormal random variables. Show that the central safety factor hsf = HR/HL is related to SF as

Подпись: HSF = SF x1 + QR 1 + Q

4.6

Подпись: SFc = HSF x , (Note: For small Qx, ojnx & Qx.) Gram-Schmid Ortho-normalization

Referring to Problem 4.4, show that for independent lognormal resistance and load, the following relation holds:

Подпись: 4.7Let W(X) = X1 + X2 — c, in which X1 and X2 are independent stochastic vari­ables with PDFs, f 1(x1) and f 2(X2), respectively. Show that the reliability can be computed as

/* TO

Подпись: Ps =Подпись: orf 1(X1)[1 — F2(c — X1)]dx1

f 2(X2)[1 — F1(c — X2)]dX2

4.7 Suppose that the load and resistance are independent random variables and that each has an exponential PDF as

fX(x) = XX exp(— Xxx) for X > 0

in which x can be the resistance R and load L. Show that the reliability is

bL HR

Ps = 1—T1— = —г—

Xl + Xr hr + HL

Подпись: 4.9

Подпись: Ps = 1 — Ф ( — — ) — exp OR Подпись: -^(2HRXL —XLOR) Gram-Schmid Ortho-normalization

Show that the reliability for independently normally distributed resistance (with mean hr and standard deviation or ) and exponentially distributed load (with the mean 1/Xl) is

4.10 Suppose that the annual maximum flood in a given river reach has Gumbel dis­tribution [Eq. (2.85a)] with mean hl and coefficient of variation Ql. Let the levee system be designed to have the mean capacity of hR = SFc x It, with SFc being the characteristic safety factor and T-year flow, respectively. For simplic­ity, assume that the levee conveyance capacity has a symmetric PDF, as shown in Fig. 4P.2. Derive the expression for the levee reliability assuming that flood magnitude and levee capacity are independent random variables.

4.11 Numerically solve Problem 4.10 using the following data:

HL = 6000 ft3/s Ql = 0.5 T = 100 years a = 0.15

for SFc = 1.0 and 1.5.

fr (r)

О

ON

0.2

0.2

————- ►

(l – a)Vr Vr (i + a)m

Figure 4P.2

4.12 Consider that load and resistance are independent uniform random variables with PDFs as

Load: fb(0 = 1/(^ – Р ^ < I < ^

Resistance: fR (r) = 1/(r2 — r 1) r 1 < r < Г2

Furthermore, I1 < r 1 < I2 < r2, as shown in Fig. 4P.3. Derive the expression for the failure probability.

4.13 Consider that load and resistance are independent random variables. The load has an extreme type I (max) distribution [Eq. (2.85a)], with the mean 1.0 and standard deviation of 0.3, whereas the resistance has a Weibull distribution [Eq. (2.89)], with mean 1.5 and standard deviation 0.5. Compute the failure prob­ability using appropriate numerical integration technique.

4.14 Consider that the annual maximum flood has an extreme type I (max) distribu­tion with the mean 1000 m3/s and coefficient of 0.3. On the other hand, the levee capacity has a lognormal distribution with a mean of 1500 m3/s and coefficient of variation of 0.2. Assume that flood and levee capacity are two independent random variables. Compute the failure probability that the levee will be over­topped using appropriate numerical integration technique.

4.15 Resolve Example 4.6 taking into account the fact that stochastic variables n and D are correlated with a correlation coefficient —0.75.

fR(r)7

1

1

1

1

1

_______________ 1_____

1

1

1

1

1

fd-O

z

ri Є

€1

4.16 The annual benefit and cost of a small hydropower project are random variables, and each has a Weibull distribution [see Eq. (2.89)] with the following distribu­tional parameter values:

a

$

в

Benefit

4.5422

60,000

266,000

Cost

3.7138

100,000

110,000

(a) Compute the mean and standard deviation of the annual benefit and cost.

(b) Assume that the annual benefit and cost are statistically independent. Find out the probability that the project is economically feasible, i. e., the annual benefit exceeds the annual cost.

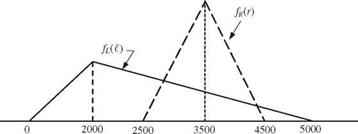
4.17 Suppose that at a given dam site the flood flows and the spillway capacity follow triangular distributions, as shown in Fig. 4P.4. Use the direct integration method to calculate the reliability of the spillway to convey the flood flow (Mays and Tung, 1992).

Подпись: 4.18The Hazen-Williams equation is used commonly to compute the head losses in a water distribution system, and it is written as
Gram-Schmid Ortho-normalization

€ , r


Gram-Schmid Ortho-normalization

Gram-Schmid Ortho-normalization

Figure 4P.5 (After Mays and Tung, 1992).

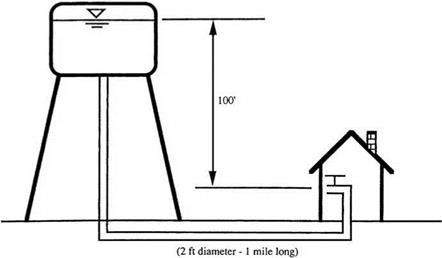
the uncertainty in pipe roughness and pipe diameter, the supply to the user is not certain. We know that the pipe has been installed for about 3 years. Therefore, our estimation of the pipe roughness in the Hazen-Williams equation is about 130 with some error of ±20. Furthermore, knowing the manufacturing tolerance, the 1-ft pipe has an error of ±0.05 ft. Assume that both the pipe diameter and Hazen – Williams’ Chw coefficient have lognormal distributions with means of 1 ft and 130 and standard deviations of 0.05 ft and 20, respectively. Using the MFOSM method, determine the reliability that the demand of the user can be satisfied (Mays and Tung, 1992).

4.19 In the design of storm sewer systems, the rational formula

Ql = CiA

is used frequently, in which Ql is the surface inflow resulting from a rainfall event of intensity i falling on the contributing drainage area of A, and C is the runoff coefficient. On the other hand, Manning’s formula for full pipe flow, that is,

Qc = 0.463n-1 S1/2 D8/3

is used commonly to compute the flow-carrying capacity of storm sewers, in which D is the pipe diameter, n is the Manning’s roughness, and S is pipe slope.

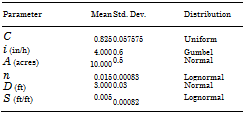
Consider that all the parameters in the rational formula and Manning’s equa­tion are independent random variables with their mean and standard deviation given below. Compute the reliability of a 36-in pipe using the MFOSM method (Mays and Tung, 1992).

In most locations, the point rainfall intensity can be expressed by the following empirical rainfall intensity-duration-frequency (IDF) formula:

Подпись: 4.20Подпись: 4.21

Подпись: Parameter Mean Std. Dev. Distribution C 0.825 0.057575 Uniform i (in/h) 4.000 0.6 Gumbel A (acres) 10.000 0.5 Normal n 0.015 0.00083 Lognormal D (ft) 3.000 0.03 Normal S (ft/ft) 0.005 0.00082 Lognormal

. aTm

i = 1———

b + tc

where i is the rainfall intensity (in in/h or mm/h), t is the storm duration (in minutes), T is the return period (in years), and a, m, b, and c are constants.

At Urbana, Illinois, the data analysis results in the following information about the coefficients in the preceding rainfall IDF equation:

Variable

Mean, і

Coef. ofVar. ^

Distribution

a

120

0.10

Normal

b

27

0.10

Normal

c

1.00

0.05

Normal

m

0.175

0.08

Normal

Assuming independence among the IDF coefficients, analyze the uncertainty of the rainfall intensity for a 10-year, 24-minute storm. Furthermore, incorporate the derived information herein to Problem 4.19 to evaluate the sewer reliability.

The storm duration used in the IDF equation (see Problem 4.20) in general is equal to the time of concentration. One of the most commonly used in the Kirpich (Chow, 1964):

tc = C (^ У

where tc is the time of concentration (in minutes), L is the length of travel (in feet) from the most remote point on the drainage basin along the drainage channel to the basin outlet, S is the slope (in ft/ft) determined by the difference in elevation of the most remote point and that of the outlet divided by L, and c1 and c2 are coefficients.

Assume that c1 and c2 are the only random variables in the Kirpich formula with the following statistical features:

Parameter

Mean

Coeff. ofVar.

Distribution

c1

0.0078

0.3

Normal

c1

0.77

0.2

Normal

(a) Determine the mean and standard deviation of tc for the basin with L = 1080 ft and S = 0.001.

(b) Подпись: 4.22

Gram-Schmid Ortho-normalization

Incorporate the uncertainty feature of tc obtained in (a), and resolve the sewer reliability as Problem 4.20.

(c) Compare the computed reliability with those from Problems 4.19 and 4.20.

Gram-Schmid Ortho-normalization Gram-Schmid Ortho-normalization

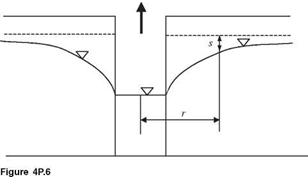
Referring to Fig. 4P.6, the drawdown of a confined aquifer table owing to pumping can be estimated by the well-known Copper-Jacob equation:

in which § is the model correction factor accounting for the error of approximation, s is the drawdown (in meters), S is the storage coefficient, T is the transmissiv­ity (in m2/day), Qp is the pumping rate (in m3/day), and t is the elapse time (in days). Owing to the nonhomogeneity of geologic formation, the storage coef­ficient and transmissivity are in fact random variables. Furthermore, the model correction factor can be treated as a random variable. Given the following in­formation about the stochastic variables in the Copper-Jacob equation, estimate the probability that the total drawdown will exceed 1.5 m under the condition of Qp = 1000 m3/day, r = 200 m, and t = 7 days by the MFOSM method.

Variable

Mean n

Coeff. ofVar.

Distribution

§

1.000

0.10

Normal

T (m2/day)

1000.0

0.15

Lognormal

S

0.0001

0.10

Lognormal

NOTE: p(T, S) = -0.70; p(§, T) = 0.0; p(§, S) = 0.0.

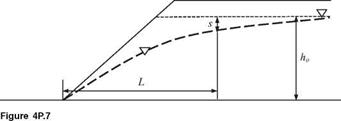
4.23 Referring to Fig. 4P.7, the time required for the original phreatic surface at ho to have a drawdown s at a distance L from the toe of a cut slope can be approximated by (Nguyen and Chowdhury, 1985)

s = 1 – erf =

ho 2 у/Khot /S

where erf(x) is the error function, which is related to the standard normal CDF as erf(x) = 2^/2[Ф(x) — 0.5], K is the conductivity of the aquifer, S is the storage coefficient, and t is the drawdown time. From the slope stability viewpoint, it is

Gram-Schmid Ortho-normalization

required that further excavation can be made safely only when the drawdowns reach at least half the original phreatic head. Therefore, the drawdown time to reach sfho = 0.5 can be determined from the preceding equation as

*=(I)2 Kb

where § = erf 1(0.5) = 0.477.

Consider that K and S are random variables having the following statistical properties:

Variable

Mean і

Std. Dev. a

Distribution

K (m/day)

0.1

0.01

Lognormal

S

0.05

0.005

Lognormal

NOTE: p(K, S) = 0.5.

Estimate the probability by the MFOSM method that the drawdown time td will be less than 40 days under the condition L = 50 m and ho = 30 m.

4.24 The one-dimensional convective contaminant transport in steady flow through porous media can be expressed as (Ogata, 1970):

C(x, t) 1 x — (q/n)t

erfc

Co 2 2 V ai(q/n)t

in which C(x, t) is the concentration at point x and time t, Co is the concentration of the incoming solute, x is the location along a one-dimensional line, q is the specific discharge, n is the porosity, ai is the longitudinal dispersivity, erfc is the complimentary error function, erfc(x) = 1 — erf(x), and t is the time.

Assume that the specific discharge q, longitudinal dispersivity ai, and porosity n are random variables with the following statistical properties:

Variable

Mean і

Std. Dev. a

Distribution

q (m/day)

1.0

0.10

Lognormal

n

0.2

0.02

Normal

ai(m)

10.0

1.00

Lognormal

NOTE: p(n, ai) = 0.75; zero for other pairs.

Estimate P [C(x, t)/Co > 0.5] for x = 525 m and t = 100 days by the MFOSM method.

4.25

Gram-Schmid Ortho-normalization Подпись: Kd L0 , ка—Kd{e Gram-Schmid Ortho-normalization Подпись: + D0e_KaX/U

Referring to the following Streeter-Phelps equation:

consider that the deoxygenation coefficient Kd, the reaeration coefficient Ka, the average stream velocity U, the initial dissolved oxygen DO, deficit concentrations D0, and the initial in-stream BOD concentration L0 are random variables. As­suming a saturated DO concentration of 8.48 mg/L, use the MFOSM method to estimate the probability that the in-stream DO concentration will be less than 4.0 mg/L at x = 10 miles downstream of the waste discharge point by adopting a lognormal distribution for the DO concentration with the following statistical properties for the involved random variables:

Variable

Mean u

Std. Dev. a

Distribution

Kd

0.60 L/day

0.060 L/day

Lognormal

Ka

0.76 L/day

0.076 L/day

Lognormal

U

1.2 ft/sec

0.012 ft/sec

Normal

D0

1.60 mg/L

0.160 mg/L

Normal

L0

6.75 mg/L

0.0675 mg/L

Normal

NOTE: p(Ka, U) = 0.8 and zero for all other pairs.

4.26 Referring to the Steeter-Phelps equation in Problem 4.25, determine the criti­cal location associated with the maximum probability that the DO concentration is less than 4.0 mg/L using the statistical properties of involved random vari­ables given in Problem 4.25. At any trial location, use the MFOSM method, along with the lognormal distribution for the random DO concentration, to compute the probability.

4.27 Develop a computer program for the Hasofer-Lind algorithm that can be used for problems involving correlated nonnormal random variables.

4.28 Develop a computer program for the Ang-Tang algorithm that can be used for problems involving correlated nonnormal random variables.

4.29 Solve Problem 4.18 by the AFOSM method. Also compute the sensitivity of the failure probability with respect to the stochastic variables. Compare the results with those obtained in Problem 4.18.

4.30 Solve Problem 4.21 by the AFOSM method considering all stochastic basic vari­ables involved, and compare the results with those obtained in Problem 4.21.

4.31 Solve Problem 4.22 by the AFOSM method considering all stochastic basic vari­ables involved, and compare the results with those obtained in Problem 4.22.

4.32 Solve Problem 4.23 by the AFOSM method considering all stochastic basic vari­ables involved, and compare the results with those obtained in Problem 4.23.

4.33 Solve Problem 4.24 by the AFOSM method considering all stochastic basic vari­ables involved, and compare the results with those obtained in Problem 4.24.

4.34 Solve Problem 4.25 by the AFOSM method considering all stochastic basic vari­ables involved, and compare the results with those obtained in Problem 4.25.

4.35 Solve Problem 4.26 by the AFOSM method considering all stochastic basic vari­ables involved, and compare the results with those obtained in Problem 4.26.

4.36 Prove that Eq. (4.107) is true.

Подпись: 4.37

Gram-Schmid Ortho-normalization Gram-Schmid Ortho-normalization Подпись: [1 - FR(IT )]

Show that under the condition of independent resistance and load, P1 in Eq. (4.113) can be written as

Подпись: 4.38

Подпись: P2 = Подпись: 0 Подпись: Fb(r) fR (r )dr + Подпись: [1 - FR (IT )]

Show that under the condition of independent resistance and load, P2 in Eq. (4.114) can be written as

4.39 Assume that the annual maximum load and resistance are statistically indepen­dent normal random variables with the following properties:

Variable

Mean

Coefficient of variation

Load

1.0

0.25

Resistance

sF x It =10-yr

0.15

Derive the reliability-safety factor-service life curves based on Eqs. (4.115) and (4.116).

4.40 Repeat Problem 4.39 by assuming that the annual maximum load and resistance are independent lognormal random variables.

4.41 Подпись: References
Resolve Problem 4.39 by assuming that the resistance is a constant, that is, r* = SF x It =10-yr. Compare the reliability-safety factor-service life curves with those obtained in Problem 4.39.

Abramowitz, M., and Stegun, I. A. (eds.) (1972). Handbook of Mathematical Functions with Formulas, Graphs, and Mathematical Tables, 9th ed., Dover Publications, New York.

Elements of Inspection

An inspection of the culvert should include the approach roadway, the embankment, the headwalls and wingwalls, the waterway, and the culvert barrel.

Roadway. The roadway over the culvert should be inspected for sags and cracks in the pavement that are the result of settlement. These may be evident in both the road­way itself and adjacent guiderail. The settlement may be the result of poorly compacted material adjacent to the culvert piping (infiltration or transportation of fines by water flowing through the backfill), or settlement of the culvert itself. The structural integrity of the culvert itself may or may not have been compromised. An inspection of the culvert must be made.

Embankment, Headwalls, and Wingwalls. The embankment, headwalls, and wing – walls at the inlet and outlet ends of the culvert should be inspected for signs of erosion, undermining, and settlement. If there is erosion at the ends, the structural integrity of the culvert will not necessarily be immediately compromised, but the hydraulic capacity will be affected. Any erosion or undermining will only worsen, and corrective action should be scheduled. If there is separation between the culvert and the endwalls, there could be a loss of supporting soil somewhere along the length of the culvert, which would affect structural capacity.

Waterway. The waterway should be inspected directly upstream and downstream for changes in the drainage. The culvert may have effected the changes in this drainage, and conversely, the changes in the drainage may have an effect on the culvert. An example of the former is where the velocity of the water is increased because of the channeling effect of the culvert. This velocity change could then cause either scour or accretion downstream. An example of the latter is accretion affecting the backwater up to the culvert, which can alter the subsequent performance of the culvert. In addi­tion, the waterway should be inspected for accumulations of debris and sediment at both the inlet and the outlet and within the culvert itself.

Culvert Barrel. The barrel or structure of the culvert should be inspected for defects, distortions, and deflections. The nature of these will depend upon the type of culvert being inspected.

INSPECTION

Many storm drains and highway culvert systems have in the past been and are presently designed for a 50-year life span. The local roadway and state highway and interstate systems have in large part reached this age or soon will. Consequently, rehabilitation and repair of existing storm sewers and highway drainage culverts are presently requiring more and more attention and resources from the responsible agencies. It is generally less expensive to rehabilitate or repair an existing underground structure than to replace it. In addition, the cost of repair to the facility after a catastrophic failure

greatly exceeds the cost of rehabilitating the structure and preventing that failure. The key, of course, is being able to identify those structures that are in jeopardy of failing.

5.11.1 General Considerations

Failure of a culvert can be defined as any condition that could reasonably lead to the collapse of the roadway above or the inability of the culvert to carry the design flow. Failure of the roadway above may be a direct result of the collapse of the structure, or may be caused by a loss of the fill due to piping and the infiltration of fines. Excessive seepage through open joints can cause loss of the backfill material as illustrated in Fig. 5.45.

Fortunately, the complete collapse of a culvert is a rare occurrence. Culverts that are overstressed, either because of loss of the surrounding soil support or because of over­loads, tend to redistribute those stresses in many cases. For example, the loss of support or the effect of excessive live loads may not occur over the complete length of the struc­ture. Consequently, as one section becomes overstressed, it may deflect more than the adjacent sections and transfer loads to those stiffer sections. In addition, underground structures that show distress, such as a concrete pipe that cracks excessively or a flexible pipe that deflects excessively, may reduce the loads upon themselves by the very act of deflecting. For instance, flexible pipe that overdeflects may have a reduced over­burden load on it because the complete prism of earth above the structure may not necessarily move downward with the deflection; competent soils will have a tendency to arch over the pipe and support some of the load. The concrete pipe that cracks may form hinges and redistribute loads within the structure; the concrete pipe may now have more of a tendency to act as a flexible structure with reduced moments and increased compression forces. However, this discussion should not give the false impression that structural distress can be ignored. Catastrophic failures have occurred and caused fatalities when vehicles plunged into the void left by the collapse. Large structures with low covers are probably the most susceptible to structural failures and should be evaluated carefully.

Even if complete collapse does not occur, structural distress can affect the adjacent soil and accelerate failure. Piping and infiltration that cause loss of adjacent soil support may proceed at an increasing rate and cause failure of the roadway above. In some cases, enough fill may be lost through piping to create a sinkhole with the structure below showing no signs of severe structural distress.

The National Bridge Inspection Program requires that all structures with span greater than 20 ft (6 m) be inspected every 2 years. That is, all structures with spans

INSPECTION

greater than 20 ft (6000 mm) when measured along the centerline of the roadway are classified as bridges for purposes of inspection. Two important points should be mentioned here. First, the measured distance is along the centerline of the roadway. That means a structural-plate pipe or a reinforced concrete box culvert with a 15-ft (4500-mm) span on a 42° skew will be classified as a bridge for inspection purposes and included in the bridge inspection program, even though the span is 15 ft (4500 mm) for hydraulic and structural design purposes. The second point is that multiple pipes are considered to be a bridge for inspection purposes when the out-to-out distance between the first and last pipes is 20 ft (6000 mm) or greater and there is a maximum of one-half diameter of the smaller pipe between them. For example, two 102-in­diameter (2550-mm) pipes separated by 51 in (1290 mm) would qualify as a bridge (102 + 51 + 102 = 255 in, or 21.25 ft, or 6375 mm).

Culverts that do not qualify for inspection under the bridge program should never­theless be given consideration for inclusion in a regular inspection program. To avoid repetition of inspections, some coordination between the engineers responsible for the two programs is necessary. Although the ideal would be to inspect all culverts, obvi­ous constraints, with regard to both physically inspecting the culverts and the costs of doing so, place limits on any program of culvert inspection. It may be less expensive to replace small culverts that are located beneath lightly traveled roads and have little fill on them than it would be to maintain them in an inspection program with rehabili­tation prior to failure as a goal. Conversely, where some culverts may not warrant inspections absent obvious signs of distress, others may require frequent inspections. Large structures that carry high flows during major storms or have a history of structural deficiencies, such as cracking (in concrete) or corrosion (in metal), should be inspected more frequently and especially after periods of storms.

Camber Requirements

Where high embankments are placed on original ground, the fill may compress and consolidate the foundation soil. Thus, culverts constructed on or near the original ground surface tend to undergo some settlement. The amount of settlement varies with fill height and the consolidation characteristics of the foundation soil. Because the amount of settlement varies with the fill height, the culvert will tend to settle more toward the center than at the ends. If the culvert is built upon a straight grade between the inlet and outlet elevations, a sag will develop. The sag may create a low point in the culvert, or may cause accumulation of debris and silt and opening and leaking of joints. These in turn may lead to a reduced waterway capacity and the possibility of loss of stability to the embankment through piping of fines at the joint. As illustrated in Fig. 5.44, these dangers may be avoided by cambering the culvert so that after settle­ment occurs, the culvert grade line will be at or close to that desired. Almost any type of culvert that is not cast in place may be cambered. These include precast concrete pipes and box culverts, corrugated metal pipes, structural-plate steel or aluminum pipes, and plastic pipes. The amount of camber required can be determined by a soils engineer.

5.10.2 Jacking and Tunneling

Should open-trench construction prove uneconomical or the disruption to the traveling public too great, either jacking or tunneling may prove to be more efficient. Either

Camber RequirementsCambered Pipe

Camber

Final grade after settlement

FIGURE 5.44 Illustration of camber to allow for settlement of culvert under high fill.

(From Handbook of Steel Drainage and Highway Construction Products, American Iron and

Steel Institute, 1994, with permission)

method removes from consideration the possible disruption of traffic. In addition, for deep fills, these methods can be economically competitive with the open-trench method. The designer should be cautioned that when jacking or tunneling is used, small differences in anticipated geologic conditions may lead to large changes in the method by which the contractor solves the problem. For example, the difference between “running” and “flowing” ground can be not only very costly, but disastrous as well. If unanticipated geologic conditions are encountered by the tunneling or jacking contractor, the cost of the contract could increase dramatically. For this reason, if geo­logic conditions are in doubt, the designer is advised to obtain adequate geotechnical information through borings.

Jacking. Jacking of underground structures requires that the structure being jacked be able to withstand the large compressive forces acting on it. This generally limits the possibilities to reinforced concrete pipe, reinforced concrete boxes, and solid wall steel pipes. The first step is to adequately provide for a jacking pit, or to design a thrust wall if the jacking is to take place above ground. The jacking force and the ade­quacy of the structure itself to withstand that force are often left to the contractor. The jacking force required is dependent upon the type and diameter or span of the structure, the type of soil, the amount of overfill, and the jacking distance. Table 5.28 provides values of frictional resistance on reinforced concrete pipe determined from past jacking projects. These values may be reduced if a lubricant such as bentonite slurry is injected into the void created by the overcut. If the frictional resistance is too high for the thrust blocks or the jacks, intermediate jacking stations may be necessary.

TABLE 5.28 Frictional Resistance of Reinforced Concrete Pipe for Jacking Projects

Soil condition

Frictional resistance, lb/ft2

Frictional resistance, kN/m2

Rock

040-60

02-3

Firm clay, silt

100-400

5-20

Wet sand

200-300

10-15

Dry loose sand

500-900

24-45

Source: From S. J. Klein, “Geotechnical Aspects of Pipe Jacking Projects,”

Pipeline Crossing Proceedings, Special Conference, Pipeline Division, American Society of Civil Engineers, Denver, March 25-27, 1991, with permission.

Tunneling. Tunneling through soft ground is accomplished by pushing a shield forward and erecting a liner inside of it. The shield is then pushed off the liner as the tunneling progresses, so that there is no limit to the length that may be tunneled. The initial liner may consist of precast concrete sections, steel tunnel liner plates, or steel ribs with either wood or steel lagging. After the liner is erected within the shield and the shield is jacked forward, the void created between the liner and the ground due to overcut may or may not need to be grouted. The grouting of this area depends upon the judgment of the engineer and the type of liner. Tunnel liner plates may not be expanded once they are erected. Because of this, the void caused by the overcut is generally grouted. Precast concrete sections and steel ribs may be expanded to contact the earth once the shield is jacked forward. In this case it is left to the judgment of the engineer whether or not grouting is necessary. After the tunnel is completed, the carrier pipe is placed inside the liner and the void between the two is generally filled with either sand or grout.

Microtunneling. Microtunneling is a term used to describe a method of horizon­tally boring pipes approximately 36 in (900 mm) in diameter and smaller, using highly sophisticated remotely controlled equipment. The use of lasers allows for extremely accurate placement of the pipe in both grade and alignment. The pipe is jacked from a jacking pit as the tunnel is being bored and the spoils are removed.

Directional Drilling. Directional drilling is similar to microtunneling except that where microtunneling is a one-stage process, the directional drilling method consists of first drilling a pilot hole, reaming it to the proper diameter, and then pulling the pipe through. Because of this methodology, no jacking pit is required. This method has a high degree of precision in location of grade and may be used where the pipe diameter is 42 in (1050 mm) or smaller and the length to be placed is less then 5000 ft (1.5 km).

Stabilization Methods for Tunneling. As previously stated, tunneling may be required where it is necessary to keep a roadway or rail line open. This may occur where there is little fill over the crown of the excavation, or where there is adequate fill but it is lacking in stiffness or cohesive strength. When this happens, the soil above the excavation cannot, by itself, develop an arching effect that will adequately support the roadway. This situation necessitates unusual solutions such as chemical grouting, compaction grouting, ground freezing, and the use of spiles. The applicable method of increasing the support depends upon the site and soil conditions. Chemical grouting, compaction grouting, and ground freezing are all methods of stabilizing the soil. Spiles are horizontally drilled small-diameter holes extending from one side of the proposed tunnel to the other and surrounding the tunnel, generally in an arch shape. The holes, after being drilled, have a steel pipe placed in them, which is subse­quently filled with concrete. The spile diameter is commensurate with the size of opening to be excavated, and the spacing is reliant upon the amount of coverage and cohesiveness of the soil. After the spiles are in place, the tunnel excavation may begin with steel arch supports placed as necessary.

Reading a Cable

Cables provide a lot of information in the abbreviations stamped into their sheathing; for example, NM indicates nonmetallic sheathing, and UF (underground feeder) can be buried. The size and number of individual conductors inside a cable are also noted: 12/2 w/grd or 12-2 W/G, for example, indicates two insulated 12AWG wires plus a ground wire. Cable stamped 14/3 W/G has three 14AWG wires plus a ground wire. (The higher the number, the smaller the wire diameter.) The maximum voltage, as in 600V, may also be indicated.

Individual wires within cable have codes, too. T (thermoplastic) wire is intended for dry, indoor use, and W means "wet"; thus TW wire can be used in dry and wet locations. H stands for heat-resistant. N, for nylon jacketed, indi­cates a tough wire than can be drawn through conduit without being damaged.

Finally, make sure the cable is marked NM-B. Cable without the final "-B" has an old-style insu­lation that is not as heat resistant as NM-B cable.

CABLE, CONDUIT, AND WIRING

Most house wiring is flexible cable, but you may find any—or all—of the wiring types described here. Inside cables or conduits are individual wires, or conductors, that vary in thickness according to the amperage of the current.

► Nonmetallic sheathed cable (NM or Romex) is by far the most common flexible cable. Covered with a flexible thermoplastic sheathing, Romex is easy to route, cut, and attach.

► Metal-clad cable (MC) is often specified where wiring is exposed. Note: Some codes still allow armored cable (AC), but that’s increasingly rare.

► Conduit may be specified to protect exposed wiring; it is commonly thin-wall steel (EMT), aluminum, or PVC plastic. Metal conduit serves as its own ground. Apart from service entrances, conduit is seldom used in home wiring. When connected with weather – tight fittings and boxes, conduit can be installed outdoors.

► Knob-and-tube wiring (see the top photo on p. 15) is no longer installed, but there’s still plenty of it in older houses. If its sheathing is

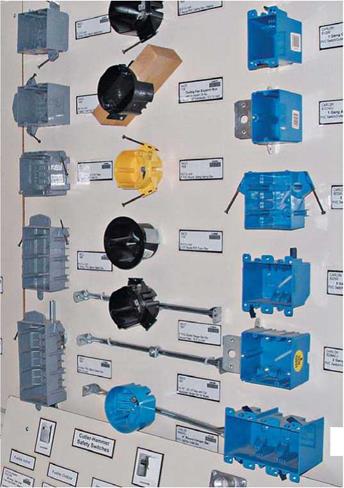
Подпись: There are hundreds of options for outlet boxes. The sample of blue plastic boxes at right shows [from top) one-gang cut-in, one-gang adjustable, two-gang nail-on, two-gang cut-in, two-gang adjustable, and three-gang boxes. The multicolored boxes in the middle are ceiling boxes. Подпись: Г~Iimage478

intact and not cracked, it may still be serviceable. You may even be able to extend it, but have an electrician do the work. Knob-and – tube is eccen­tric, requiring experience and a skilled hand.

Install ridge shingles and the ridge vent

At the ridge, many builders install ridge shin­gles on the roof ends with a ridge vent between them. An alternative is to install the ridge vent across the entire roof, even though the ends of the vent (located over the gable-end overhangs) are not functional. Some ridge vents do not require a cap of roof shingles, but others do. No matter which type of ridge vent you use, follow the manufacturer’s instructions regarding its installation (see the top right photo on p. 143).

Ridge shingles are easy to make—simply cut regular three-tab shingles into three pieces, as shown in the bottom right photo on p. 143. Lay the shingle upside-down on a piece of ply­wood and cut it with a utility knife. Start at the top of a slot and angle inward slightly in both directions toward the top of the shingle, cutting out a small triangle of waste. These shingles cover the ridge at both ends of the roof and are overlapped to show a 5-in. reveal, just like regular shingles. The angled portion of each ridge shingle is covered by the exposed part of the next shingle.

To ensure that both the ridge shingles and the ridge vent are installed straight, I like to snap a blue chalkline about 5 in. to 6 in. down one side of the ridge. No one but the eagles may see this, but it only takes a couple of minutes to do it correctly, and it’s important to develop good habits. Fasten the ridge shingles securely with L/2-in. roofing nails. Some ridge vents must also be installed with long nails. Cover exposed nail heads with a good-size dab of roofing tar.

Nice work! This peak experience gives the house its most important protection from the elements. When a roof is installed properly, you don’t have to worry about it for a long time.

Подпись: Photo cour tesy HFHI Подпись: Photo courtesy HFHIInstall ridge shingles and the ridge ventHabitat

"111 for Humanity®

PLAY US A TUNE

Before Katrina hit, Habitat affiliates in the Gulf were building 60 houses a year. After the storm, those same groups were building that many houses in a month! Mobilizing some 70,000 volunteers in the storm’s aftermath, Habitat for Humanity has completed or begun construction on more than 1,200 homes as of this writing in the Gulf Coast, and there’s no end in sight.

In New Orleans, hit hard by the hurricane, the New Orleans Area Habitat for Humanity is playing a key role in rebuilding their city. It has expanded its operations in many parishes outside the city, including St. Bernard parish, which sustained damage to nearly every structure within its limits,
and is also committed to the development of the celebrated Musicians’ Village.

Seeing hundreds of Crescent City musicians lose their homes and livelihoods because of the storm’s devastation, singer Harry Connick Jr. and jazz saxophonist Branford Marsalis teamed up with Habitat to do something about it.

Designed to foster the sounds and songs that make New Orleans unique, the Musicians’ Village consists of single-family homes and duplexes that will house musicians as well as residents who want to be part of this musically inclined neigh­borhood. To top it off, the Ellis Marsalis Center for Music is being built in the heart of the community. Part performance hall, part teaching facility, the center’s goal is to bring musicians young and old together to celebrate the rich musical heritage of New Orleans.

After so much devastation and upheaval, restoring New Orleans will not happen overnight. But if the joint efforts of Habitat and the city’s citizens are any indication, the spirit of the city is alive and singing. —Dave Culpepper

Install ridge shingles and the ridge vent

і

Mechanical Spreading

Nowadays, mechanical placement is the only reliable method of executing an SMA layer. Requirements for pavers can very rarely be found in the specifications.

Basically, selection, setting, and operation of a paver are the responsibilities of the paving contractor. Most road-engineering companies, after gaining experience with SMA pavements, work out their own procedures for spreading, compacting, and achieving the required parameters. The following information might help to establish or improve such procedures.