Category HIGHWAY ENGINEERING HANDBOOK

Estimation of Time of Concentration

The time of concentration or rainfall duration is equivalent to the length of time it takes for the runoff to travel from the most remote point of the watershed to the point of solution. This assumes that there is a uniform rate of rainfall over the entire water­shed resulting in the maximum flow at the point being investigated. The total time of concentration is comprised of three distinct components: overland flow time, shallow concentrated flow time, and concentrated flow time.

Overland flow is thought to occur for no more than 300 ft (91 m) and perhaps even less. The overland flow time may be approximated by the curves in Fig 5.2. It is based on the following equation:

Подпись: (5.4)T = 1.8(1.1 – C)(L)1/2 o [N(100)]1/3

where To = overland flow travel time, min C = runoff coefficient L = overland travel distance, ft (m X 3.28)

S = slope

Подпись: 364 Estimation of Time of Concentration

Given: An undeveloped watershed consisting of (1) rolling terrain with average slopes of 5%, (2) clay-type soils, (3) good grassland area, and (4) normal surface depressions.

Подпись:Find: The runoff coefficient C for the above watershed.

Source: From Highway Design Manual, California Department of Transportation, with permission.

Подпись: TABLE 5.2 Runoff Coefficients for Developed Areas Type of drainage area Runoff coefficient Business: Downtown areas 0.70-0.95 Neighborhood areas 0.50-0.70 Residential: Single-family areas 0.30-0.50 Multiunits, detached 0.40-0.60 Multiunits, attached 0.60-0.75 Suburban 0.25-0.40 Apartment dwelling areas 0.50-0.70 Industrial: Light areas 0.50-0.80 Heavy areas 0.60-0.90 Parks, cemeteries 0.10-0.25 Playgrounds 0.20-0.40 Railroad yard areas 0.20-0.40 Unimproved areas 0.10-0.30 Lawns: Sandy soil, flat, 2% 0.05-0.10 Sandy soil, average 2-7% 0.10-0.15 Sandy soil, steep, 7% 0.15-0.20 Heavy soil, flat, 2% 0.13-0.17 Heavy soil, average, 2-7% 0.18-0.25 Heavy soil, steep, 7% 0.25-0.35 Streets: Asphaltic 0.70-0.95 Concrete 0.80-0.95 Brick 0.70-0.85 Drives and walks 0.75-0.85 Roofs 0.75-0.95 Source: From Highway Design Manual, California Department of Transportation, with permission.

The overland flow time can also be calculated by the kinematic wave equation:

Подпись: (5.5)T = K(L06)(n06) o (i°’4)(S03)

Подпись: where To K L S n ioverland flow travel time, min

0.93 for U. S. Customary units (6.98 for SI units)

length of overland flow path, ft (m)

slope of overland flow

Manning’s roughness coefficient

rainfall intensity, in/h (mm/h)

The solution of the kinematic wave equation is an iterative procedure since the overland flow time is a function of the rainfall intensity and the rainfall intensity is a function of the time of concentration.

Estimation of Time of Concentration

FIGURE 5.1 Typical rainfall intensity-duration-frequency curves. (From Design and Construction of Storm and Sanitary Sewers, ASCE, 1986, with permission)

Caution is urged in the application of this equation. Manning’s roughness coeffi­cient n varies with the depth of flow. Therefore, n values suitable for open-channel flow should not be used in the kinematic wave equation. Table 5.3 lists roughness coefficient values appropriate for use.

After 200 to 300 ft (61 to 91 m) of overland flow, water tends to concentrate into rills and gullies. This type of flow is termed shallow concentrated flow. The velocity of shallow concentrated flow can be estimated using the following relationship:

V = KCkVl00S (5.6)

where V = velocity, ft/s (m/s)

K = 3.28 (1.0 in SI units)

Ck = intercept coefficient (see Table 5.4)

S = slope, ft/ft (m/m)

The final type of overland flow to investigate is flow that is captured in a stream, ditch, or closed conduit. This type of flow is referred to as concentrated flow.

Manning’s equation is used to estimate the velocity of concentrated flow (see Art. 5.3.3). It should be noted that the use of Manning’s equation is an iterative process and the assumed hydraulic radius must be checked for convergence.

The shallow concentrated flow time and the concentrated flow time can be determined by using the velocities obtained from the investigation of the shallow concentrated flow and the concentrated flow. The appropriate equation is as follows:

Подпись: (5.7)

Подпись: FIGURE 5.2 Overland time of concentration curves. Conversion: 1 ft = 0.3048 m. (From Highway Design Manual, California Department of Transportation, with permission)

L

60V

where Tf = time of shallow concentrated flow or concentrated flow, min L = overland length of flow, ft (m)

V = velocity, ft/s (m/s)

The total time of concentration is then the summation of the times of concentration for each of the distinct flow types.

As an alternative to the above procedure, where the channels are well defined and the overland flow is generally over bare ground, the total time of concentration may be estimated from the Kirpich equation[6]:

TABLE 5.3 Manning’s Roughness Coefficient, n, for Overland Sheet Flow

Surface description

n

Smooth asphalt

0.011

Smooth concrete

0.012

Ordinary concrete lining

0.013

Good wood

0.014

Brick with cement mortar

0.014

Vitrified clay

0.015

Cast iron

0.015

Corrugated metal pipe

0.024

Cement rubble surface

0.024

Fallow (no residue)

0.05

Cultivated soils

Residue cover < 20%

0.06

Residue cover > 20%

0.17

Range (natural)

0.13

Grass

Short grass prairie

0.15

Dense grasses

0.24

Bermuda grass

0.41

Woods[7]

Light underbrush

0.40

Dense underbrush

0.80

*When selecting n, consider cover to a height of about 1 in. This is the only part of the plant cover that will obstruct sheet flow.

Source: From Urban Drainage Design Manual, HEC

Подпись: T c Подпись: K Подпись: L �'77 S05 I Подпись: (5.8)

22, FHWA, with permission.

Подпись: where Tc K L Stime of concentration, min

0.0078 for U. S. Customary units (3.97 for SI units)

maximum flow length, ft (km)

total slope = total change in elevation divided by L

The value of Tc should be multiplied by 2 where the surfaces are grassy, by 0.4 where they are asphalt or concrete, or 0.2 for concrete channels. (See Modern Sewer Design, AISI.)

The total time of concentration may also be calculated from the following modified form of the Williams equation*:

TABLE 5.4 Intercept Coefficients

Types of surface

Intercept coefficient Ck

Forest with heavy ground litter

0.076

Min. tillage cultivated; woodland

0.152

Short grass pasture

0.213

Cultivated straight row

0.274

Poor grass; untilled

0.305

Grassed waterways

0.457

Unpaved area; bare soil

0.491

Paved area

0.619

Source: Adapted from Location and Design Manual, Vol. 2:

Drainage Design, Ohio Department of Transportation, with permission.

Tc = KLA-0lS-02 (5.9)

where Tc = time of concentration, min

K = 21.3 for U. S. Customary units (14.6 for SI units)

L = maximum flow length, mi (km)

A = total watershed area, mi2 (km2)

S = slope

A minimum time of concentration of 5 min is recommended by the FHWA. (See D. R. Maidment, Handbook of Hydrology, McGraw-Hill, 1993.)

Another common and simple method for determining the runoff is the NRCS method. The determination of the peak discharge is dependent upon the time of con­centration, the cumulative rainfall, and the soil and cover classifications. (See the fol­lowing from the NRCS: National Engineering Handbook, 1985; and “Urban Hydrology for Small Watersheds,” TR-55, 1986.)

Estimation of Runoff by Peak Flow Equations

Where there are no or insufficient stream-gauging records available, peak-flow methods such as the “rational method” and the Natural Resources Conservation Service (NRCS) method may be used. The rational method is the most common procedure for determin­ing the quantity of flow for the design of minor hydraulic structures. Its use in the United States dates back to the late 1800s. One of the basic design assumptions for its use is that
the rainfall intensity is uniform throughout the watershed. This assumption limits its use to relatively small watershed areas (in the neighborhood of 200 to 300 acres, or 1 km2).

The rational method is based on the simple intensity-runoff equation

Q = KCiA (5.2)

where Q = design discharge, ft3/s (m3/s)

C = runoff coefficient

i = average rainfall intensity, in/h (mm/h) for selected frequency and duration equal to time of concentration A = drainage area, acres (km2)

K = 1.0 for U. S. Customary units (0.278 for SI units)

Подпись: C Подпись: CA + C2 A+~ A1 + A2 +■" Подпись: (5.3)

After precipitation falls to the earth, it either is infiltrated into the earth, is evaporated back into the atmosphere, is subjected to depression or detention storage, or becomes runoff. The runoff coefficient C in Eq. (5.2) depicts the percent of precipitation that will run off the ground from the storm. Representative values of C for undeveloped and developed areas, respectively, are given in Tables 5.1 and 5.2. Also, if the watershed is made up of various surfaces, a weighted average should be used for C. This may be determined for surfaces with coefficients C1, C2, etc., and areas A1, A2, etc., as follows:

The intensity value i in Eq. (5.2) is dependent upon the time of concentration of the storm and the frequency of the design storm selected. Once these two parameters are selected, the rainfall intensity may be determined from an intensity-duration-frequency (IDF) curve. Such curves, which are derived from an accumulation of rainfall data recorded over the years, are available from both local and regional public agencies. (See, for example, U. S. Weather Bureau Technical Paper No. 25, “Rainfall Intensity – Duration-Frequency Curves for Selected Stations in the U. S.”) A method for developing rainfall intensity curves and equations is shown in FHWA publication HEC 12, “Drainage of Highway Pavements.” A typical IDF curve is shown in Fig. 5.1.

Estimation of Runoff by Statistical Methods

Estimating the peak discharge for which highway drainage structures are to be designed is one of the most common problems and biggest challenges faced by the highway engineer. The problem may be separated into two categories: (1) watersheds for which historical runoff data are available, those with gauged sites, and (2) areas for which no data are available. Gauged sites lend themselves to analysis of runoff by statistical methods, whereas ungauged sites rely upon hydrologic equations based on the hydrologic and physiographic characteristics of the watershed.

The runoff data necessary to utilize statistical methods are available through the USGS, which is the primary collector of such data. Additional data sources are given in Chapter 3 of FHWA publication HDS 2 “Highway Hydrology.” Provided that suffi­cient data are available for a specific site, a statistical analysis may be made that will result in a reasonable determination of the peak discharge. Water Resources Council Bulletin 17B, 1981, suggested that a minimum of 10 years of historic data are necessary to make an accurate estimation based on statistical methods. The USGS has no specific time requirements for historical hydrologic data collection. In the past, however, the rec­ommended time period varied between 10 years for a 10-year design flood to 25 years for a 100-year design flood. HDS 2 should be referenced for different techniques avail­able for determining the inferences of population characteristics from statistics.

Data collection can be categorized and arranged in groups that lend themselves to statistical analysis. The common groupings are by magnitude of peak annual discharge, by time of occurrence, and by geographic location. Of the three, magnitude of peak annual discharge is the most useful in determining peak discharge. Time of occurrence is the most useful in trend analysis or determining the effects of changing land use on runoff. Grouping by geographic location is the most useful when looking at sites that
have insufficient flood data either because they are ungauged or because the historical time frame of the collected data is too short.

There are several standard frequency distributions that have been extensively studied in the statistical analysis of hydrologic data. Three of the most useful are (1) log-Pearson type III distribution, (2) lognormal distribution, and (3) Gumbel extreme value distrib­ution. The log-Pearson type III distribution is popular largely because the distribution very often fits the available data closely and it is flexible enough to be used with many other types of distributions. Because of this flexibility, the U. S. Water Resources Council has recommended that it be used by all governmental agencies as the standard distribution for flood frequency studies. The characteristics of the lognormal distribu­tion are the same as those of the classical normal or Gaussian mathematical distribution except that the flood flow at a specified frequency is replaced with its logarithm and has a positive skew. Positive skew means that the distribution is skewed toward the high flows or extreme values. The characteristics of the Gumbel extreme value distribution (also known as the double exponential distribution of extreme values) are that the mean flood occurs at the return period Tr of 2.33 years and that it has a positive skew.

If runoff data are unavailable for a specific watershed area, one method that may be used to determine the peak stream discharge is a regional flood-frequency analysis. By using historical runoff records from similar drainage basins in the immediate area, estimates of peak discharges may be developed. The USGS is continuously updating the methodology by which the agency performs regional flood-frequency analyses. Recent advances include the use of the “ordinary least squares” and “region of influence” methods for regionalizing historic stream flow data.

Подпись: Y Подпись: aXb1 Xbf Xb3 ••• Xb Подпись: (5.1)

The statistical distributions commonly used for regional flood-frequency analysis result in an equation of the general form:

where Y = dependent variable

a = intercept coefficient Xj, X2,…, Xn = independent variables b1, b2,…, bn = regression coefficients

In practice, the dependent variable is the estimated stream flow for a given return period. The intercept coefficient is a constant used to differentiate the regions used in the analysis and the required return periods. The independent variables are drainage basin characteris­tics such as drainage area, basin or channel slope, and types of land cover; meteorological characteristics such as annual rainfall; and channel characteristics such as cross-sectional area, active channel width and depth, and flood-plain width and depth.

It is important to note the limitations of regional flood-frequency analyses and the resulting regression equations. In general, independent variables should be determined using the same techniques as were used during the regression analyses. For example, if USGS 7.5-minute quadrangles were used to determine basin characteristics for the regression analysis, then basin characteristics should also be obtained from 7.5-minute quadrangles for peak discharge estimations.

Flood Frequency

There are two accepted alternatives for determining the design flood frequency at a specific site: (1) by policy and (2) by economic assessment. An example of an estab­lishment of a design flood frequency by policy is the Code of Federal Regulations, which specifies that the design flood for encroachment onto through lanes of interstate highways shall not be less than the 50-year discharge. Most state and local agencies have established guidelines for policy requirements of design flood frequencies. For example, whereas bridges are designed to convey a 50-year discharge with a specified freeboard and to convey the 100-year discharge with no freeboard, California has adopted the policy that culverts may be designed for a 10-year flood without headwa­ter or to convey the base flood without damage to the facility or adjacent property. The base flood is defined as the flood or tide having a 1 percent chance of being exceeded in any given year, which is also defined as the 100-year flood. A design flood is a flood that will not inundate the highway—that is, will not cause the through lanes to be overtopped. An overtopping flood is a flood that will overtop the roadway, culvert, or bridge.

Blind adherence to the policy guideline to determine the design storm should be avoided. As a minimum, a range of peak flows should be considered and their poten­tial effects on the traveling public, the potential damage to upstream and downstream properties, and the possibility of loss of life should be analyzed. This preliminary assessment will indicate whether the policy determination for the design flood fre­quency was applicable or whether further analysis is required. Additional studies could take the form of providing the greatest flood hazard avoidance at the least total expected cost, as recommended in Federal Highway Administration (FHWA) Hydraulic Design Series (HDS) 6, “River Engineering for Highway Encroachments.”

Watershed Characteristics

Characteristics of the watershed area directly affect the hydrologic analysis. Basic fea­tures of the watershed basin include size, shape, slope, land use, soil type, storage, and orientation.

The size of the watershed basin is the most important characteristic affecting the determination of the total runoff. It is generally measured in acres, square miles, or square kilometers and is defined by the limits of the topographic divide. A topographic divide is a line that separates water flow between basins, thus causing the rainfall that falls on one or the other side to flow into a particular watershed. The location of this divide, and thus the perimeter of the basin, may be determined from aerial photographs, topographic maps available from the U. S. Geological Survey (USGS), and field surveys.

The shape of the watershed primarily affects the rate of water flow to the main channel. Because the rainfall in narrow watersheds reaches the main stream relatively quickly, a narrow basin generally has a low peak discharge compared with a fan – or pear-shaped basin of otherwise similar characteristics.

The main effect the slope has on water flow is on the time of concentration, or the time it takes the rainfall to flow from the farthest point in the watershed to the point under consideration. Everything else being equal, steeper slopes cause a shorter time of concentration, and thus a higher peak discharge, than do flatter slopes.

The use of the land and the type of surface the precipitation falls upon have an obvious impact on the flow of water. Developed areas covered by asphalt or concrete will allow a much greater percentage of the rainfall to flow to the point under deliber­ation than will an undeveloped vegetated area.

Peak flows may be reduced by the effective storage of drainage water. Of the three main types of storage—interception, depression, and detention—detention storage has the major impact in determining runoff. Interception refers to storage on aboveground fixtures such as plants, and depression refers to storage in depressions in the ground surface. Interception storage will eventually evaporate, and depression storage will either evaporate or infiltrate into the ground. Detention storage is runoff that is either in transit to the main channel or in storage in a pond, swamp, basin, or constructed detention chamber prior to transmission.

The final characteristic of the watershed basin is orientation. Taking into account the slope of the basin, if it is north – or south-facing, the runoff may be affected. If the basin accumulates snow and faces north, the snow may not melt until the late spring. If the snow melt is caused by a spring rain, the total runoff will be increased. On the other hand, if the basin faces south, the snow melt may come much earlier in the year, and with evaporation and infiltration, it may not contribute as greatly to the runoff. Basin orientation for small, steep basins also affects the peak rates of runoff. Where these basin types are in line with prevailing storm movements, the watershed responds with higher, shorter peak discharges.

HYDROLOGY

The science of hydrology is concerned with the estimation of the intensity of rainfall, the
distribution of the flow of the rainwater over the land, and the determination of the flow quan-
tity (peak and total) that eventually reaches some specified point, the “point of solution.”

Of primary concern to the highway engineer is the frequency of occurrence of the peak discharge. Although many methods for determining runoff have been proposed over the years, making an accurate prediction is difficult, because of the many and varying para­meters that contribute to the complexity of the problem. These parameters include the affected drainage area, the rainfall intensity, the time of concentration of the rainfall, and the percent of the rainfall that will actually reach the point of solution. In addition to the difficulty in forecasting flows due to the inaccuracies in measuring and predicting the above parameters, different techniques that are commonly used to predict flows may pro­duce significantly different results for a specific site and situation.

The objective of hydrologic analysis is to estimate the quantity of runoff for which a specific hydraulic structure must be designed. The magnitude of the study must be propor­tional to the risks involved. Those risks include the potential for damage to the roadway and adjacent property and the importance of the roadway in the transportation system.

Kevin E. White, P. E

Principal Hydraulic Engineer
E. L. Robinson Engineering
Columbus, Ohio

A properly designed highway requires a well-designed drainage system. This requires a determination of the quantity of runoff reaching the drainage structures and an accurate analysis of water flow through the structures in order to properly size them. Also, a working knowledge of structural characteristics of buried pipe systems and effects of environmental factors is necessary to provide for long-term performance. Timely inspection and maintenance of drainage facilities will ensure satisfactory service life. If all of these issues are properly addressed, an efficient drainage system can be devel­oped. Because a large percentage of highway funds is spent on culverts, storm drains, and other drainage facilities, it is incumbent upon the engineer to use funds wisely and create an efficient drainage system. Thus, the roadway and adjacent property will be protected without wasting taxpayers’ money.

This chapter includes a review of fundamental hydrology considerations and runoff estimation, fundamentals of the hydraulics of open-channel flow, and design considera­tions and methods for the various components of highway drainage. The design, construc­tion, and service life of both flexible and rigid pipe are addressed, as well as rehabilitation and maintenance. The range of products is broad, extending from small-diameter drainage pipe to long-span structures that may be used for the replacement of short-span bridges. Article 5.6 may be referred to for a general description of the major products available.

SEISMIC DESIGN

In recognition of the serious potential destructive effects of earthquakes, AASHTO specifications contain comprehensive provisions for seismic design. Although earlier speci­fications contained some provisions, the more comprehensive provisions were not adopted until the 1980s. They were based on a detailed study by consultants who were specialists in that field, with review and participation by bridge engineers and design firms. The standards developed apply to conventional steel and concrete girder and box girder construction with spans up to 500 ft, but do not cover suspension, cable – stayed, arch-type, and movable bridges.

Bridges and components designed to the AASHTO seismic provisions may suffer damage under severe seismic events, but should have a low probability of collapse due to ground shaking. The general philosophy adopted in the development was

• Small to moderate events should be resisted elastically without significant damage.

• Realistic seismic ground motion intensities should be used in design.

• Large events should not cause bridge collapse, and damage that occurs should be

readily detectable and repairable.

Seismic performance categories are assigned on the basis of a ground acceleration coefficient for the site determined from a contour map of the United States, and an importance classification of “critical,” “essential,” or “other.” Different degrees of design complexity are specified, depending on the seismic performance category. Each bridge is assigned to one of four seismic zones, and one of four different site coefficients is applied to approximate the effects of the site conditions (soil profile) on the response. Lateral forces and displacements may be determined from a single-mode spectral analysis, a multimode spectral analysis, or more rigorous procedures. Elastic response is assumed in the analysis, but forces are adjusted with response modification factors. The lateral forces are applied in orthogonal directions in combination to account for the directional uncertainty of earthquake motions. An important require­ment specifies the minimum length of the bearing seat supporting the expansion ends of girders, determined as a function of the span length and the height of the supporting columns. Foundation design is also treated.

Seismic retrofit is a major consideration for older structures, particularly in the western United States. Serious distress and collapse of some bridges in California during the Loma Prieta (1989) and Northridge (1994) earthquakes received wide publicity. However, the problem structures were generally those designed and constructed to earlier standards. Where bridges were built according to modern methods, problems were minimal. Problems included failure of reinforced-concrete rigid-frame supports, failure of reinforced-concrete columns, columns punching through decks, and collapse of a structural steel span where the longitudinal displacement was excessive.

Active programs are in place to retrofit older structures to current criteria, but it is a massive undertaking that requires several years to accomplish. Some of the tech­niques being applied include (1) increasing the length of the seats for the bearings to provide a greater tolerance for longitudinal displacements, (2) adding cable restraints and hold-down devices at supports and hinges to restrict excessive movement and keep members in place, (3) adding spiral reinforcing steel and steel jackets or composite overwraps to strengthen concrete column piers, (4) replacing obsolete bearings with energy-dissipating types having lead cores or shock absorbers, and (5) adding founda­tion tie-down rods inserted into holes drilled into the soil. In the Northridge earthquake, several structures that had recently been retrofitted survived intact, giving confidence to the retrofit program. Retrofitting is not limited to the west but is under way in other parts of the United States as well.

PROVISION FOR INSPECTION OF NEW BRIDGES

In the design of a new bridge, provision must be made for maintenance inspection. For example, plate girders can be provided with safety handrails, safety railings can be specified on top of wide piers for inspectors to check bearings, and safety ladders can be installed to provide access to elements of the bridge otherwise difficult to reach. For deck-type bridges of moderate span and width, it will be possible to access the superstructure from special bridge inspection vehicles operating on the deck. For longer spans where the depth of girder exceeds the vertical capacity of a boom, and for wider bridges where the horizontal reach of the boom is not adequate, it may be necessary to provide catwalks or permanent movable inspection platforms. These devices are becoming increasingly popular as inspection and maintenance require­ments are given the attention they deserve in the design process.

4.16 SCOUR

Stream scour can undermine bridge piers or abutments, resulting in collapse of spans and loss of life. Several such incidents, including collapses in Alabama, New York (Schoharie Creek bridge on the New York Thruway, 1987), and Tennessee, caused FHWA to mandate the evaluation of all highway bridges for scour vulnerability by 1997.

An insidious aspect of scour is that soil around a foundation can be removed and rede­posited during a flood without leaving clear evidence that this has occurred, so that material may be present but may not provide the required support. Beyond surveying the stream bot­tom for local lowering of the flow line and inspecting around the pier by visual, manual, and remote means, current techniques for determining whether a loss of support has occurred are limited. They include physical probing and use of ground-penetrating radar.

Bridge scour evaluation requires input from hydraulic engineers as well as from structural and geotechnical engineers. Following the determination of a total scour prism, all three disciplines should be involved in providing structural stability.

Scour Study. A scour study at an existing bridge will include some or all of the following:

• A channel bottom physical inspection

• A channel bottom topographic inspection

• A localized scour evaluation conducted around each substructure element

• Photographic or video recording of observations

• Hydraulic analysis

• Soils investigation including laboratory testing

Hydraulic Analysis. In the hydraulic analysis, depth of scour is calculated for 100-year and 500-year floods. Inclusion of the 500-year flood calculation reflects a change of thinking in regard to bridge hydraulics that has taken place in the last 20 or 30 years. Previously, it was thought acceptable to have a very small percentage of bridges wash out in a severe flood, and if this did not occur the hydraulic design requirements were considered excessive. The current thinking is that a complete washout should be avoid­ed, even in very extreme floods because total cost of a bridge failure would be more than design for scour. A difficulty in implementing this policy, as in earthquake engi­neering, is that the hydrologic database has been developed over a relatively short period of time in the United States.

AASHTO LRFD specifications require the bridge foundations to be investigated for the following two conditions:

• 100-year design flood for scour or an overtopping flood of lesser recurrence interval

at strength and service limit states

• 500-year check flood for scour or an overtopping flood of lesser recurrence interval

at extreme event limit state

AASHTO Model Drainage Manual contains guidance on design procedures and computer software for hydrologic and hydraulic design.

A series of hydraulic analysis computer programs are available to assist in scour analysis. They include HEC-18, Evaluating Scour at Bridges; HEC-20, Stream Stability at Highway Structures; HEC-23, Bridge Scour and Stream Instability Countermeasures; HEC-RAS, River Analysis System; HY-8, Culvert Hydraulics Analysis; and FHWA’s water surface modeling program, WSPRO. These programs are primarily for inland streams. In coastal areas, tidal velocities and hurricane surge velocities may also cause scour. To perform the hydraulic analyses for these condi­tions, it may be necessary to obtain data from the Federal Emergency Management Agency (FEMA) and the National Oceanic and Atmospheric Administration (NOAA) and to use other analysis techniques.

Soils Investigation. The objective of the soils investigation is to determine whether and to what degree the soils are subject to being eroded. Grain size is of particular interest.

Countermeasures. Where a potential for undermining is found, countermeasures will be required to ensure the stability of the bridge. Countermeasures include riprap, poured-concrete protective aprons with keyed edges, cabled-concrete sections, pre­cast-concrete units, rock-filled basket mattresses, and protective piles or sheet-piling. In the case of new bridges, where more opportunities for preventing scour exist, some of the available options are a larger waterway opening that reduces stream velocity, location of piers out of the scour-vulnerable zone, use of deeper piles, and selection of a different pier shape.

Design Information on Plans for New Bridges. Information from the scour analysis for a new bridge should be placed on the construction drawings so that a permanent record of scour estimates, and their effect on design, is readily available for future inspections and for improvement of this design process.

BRIDGE BEARINGS

For concrete-slab bridges where expansion is not provided, the slab is normally sup­ported directly on the substructure, concrete on concrete. A “centerline of bearing (singular)” is denoted on plans at each support. (Some states do not identify a centerline of bearing at the end bent of a slab bridge. Instead, they measure the end span to the end of the slab.)

In other types of bridges, individual bearings are used to support the superstructure. The centerline of these devices is denoted as the “centerline of bearings (plural).” AASHTO requires that steel bridges with spans of 50 ft (15 m) or greater have a type of bearing employing a hinge, curved bearing plates, elastomeric pads, or pin arrangements for deflection (rotation) purposes. (This specification does not distin­guish between simple and continuous spans. Presumably, it was written for simple spans, and so it would make sense that a span greater than 50 ft (15 m) be allowed for pier bearings not providing for rotation when spans are continuous.)

Bearings consist of some or all of the following components:

• Masonry plate resting on the substructure bridge seat

• Rotation device

• Sliding device

• Movement-restraining devices, or “keepers”

• Sole plate attached to the superstructure

Bearings may be fixed bearings, providing for rotation only and preventing differential movement between superstructure and substructure, or expansion bearings. Sliding expansion bearings have a finite capacity depending on the length of the contact surface, or may employ keepers to limit the movement. The range of movement accommodated by the bearing should be greater than the calculated movement.

The type of bearing is typically denoted on the elevation view of the general plan and elevation sheet in the project plans, using “E” for expansion and “F” for fixed.

The main types of bearings are

• Sliding plates

• Rockers and bolsters

• Pins

• Rollers

• Elastomeric bearings

• Disk bearings

• Pot bearings

• Seismic isolation bearings

Sliding Bearings. Sliding bearings will generally have a component made from a material that has a lower coefficient of friction than steel, and that is more corrosion-resistant. Bronze has been used in the past, but has not always maintained sliding capability over the life of the structure. When bearings “freeze,” that is, lose their sliding capability, forces much greater than those anticipated in the design can be exerted on the substructure and ends of beams, doing great damage to both. To reduce friction and prolong the life span of bronze bearings, long-lasting lubrication can be forced under great pressure into trepanned rings on the surface of the bronze. These bearings are known by the brand name Lubrite.

Low friction can be achieved by use of polytetrafluoroethylene (PTFE) sheets mated with stainless steel. This combination is included in many current bearing types to provide for expansion, while other components are used to accommodate rotation. The TFE can be in solid sheet form or woven fabric. During shipping and storage at the job site, the assembly should be banded to prevent dirt from contaminating the sliding
surface. The configuration of the bearing should be such that the sliding surface will not easily become dirty in service.
BRIDGE BEARINGS

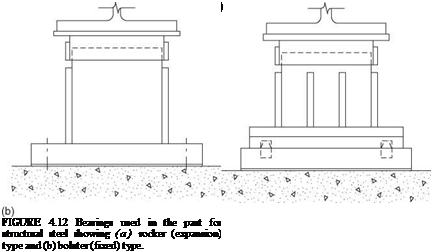
Rockers and Bolsters. Another means of allowing the superstructure to move, without sliding, is by use of rockers. Rockers, as the name implies, permit the superstructure to rock, like a person in a rocking chair, on the substructure. Rockers (Fig. 4.12a) consist of a masonry plate that is bolted to the concrete bridge seat; a rocker element, which is a heavy steel fabrication with a large-radius curved bottom surface and a small-radius semicircular convex pintle on top; and a sole plate, which has a mating concave surface. The height of the rocker is made proportional to the anticipated movement. Within the design range of movement, as the superstructure translates, the rocker tips, but the reaction

to the base plate is maintained within the geometric limits of the rocker, so that the rocker does not tip over. To help prevent the rocker from tipping over, the space between the shoulder of the rocker and the bottom of the sole plate is limited, so that the assembly will bind as its capacity is reached.

Compared with sliding plates, rockers use more massive plates and are therefore less susceptible to severe corrosion and freezing. Because their inclination is readily visible, inspectors can easily determine whether they are functioning properly. Assuming that the rockers were properly installed to be vertical at a given average temperature, one can easily see whether they are inclined excessively or in the wrong direction. In cold weather, when the tops of the rockers should be tipped toward the center of the bridge, an opposite inclination indicates either that unexpected move­ment of the superstructure has occurred, or that the substructure has moved. Sliding plates can give similar indications, but they require closer observation.

Generally, when rockers are used for expansion bearings, bolsters are used for fixed bearings. The bolster (Fig. 4.12b) is a large steel fabrication consisting of a base plate, which is bolted to the concrete bridge seat; a pintle, which extends upward from the base plate and has at its top a machined convex semicircular shape that fits into a mating con­cave shape in the sole plate; and reinforcing plates on the sides of the pintle. These side plates are tapered, being wider at the base. This configuration of the mating surfaces allows the beam or girder to rotate, but fixes the superstructure against translation.

Rockers and bolsters, being taller than sliding plates, place the superstructure higher above the substructure. This is desirable for inspection and maintenance, including painting, and in fact is in line with AASHTO requirements that beams, girders, and trusses on masonry be so supported that the bottom flanges or chords will preferably be 6 in minimum above the bridge seat. However, if rockers or bolsters are tall and narrow, they may be aesthetically undesirable for overpass structures, giving the appearance of placing the superstructure on stilts. Because of their susceptibility to seismic loads and other problems, most states have discontinued use of steel bearings of this kind.

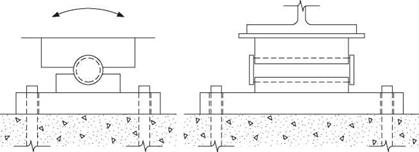
Pins. The pin bearing is used where a fixed condition is desired but rotation needs to be accommodated. As illustrated in Fig. 4.13, it consists simply of a masonry plate, a bottom plate welded to the masonry plate and machined to receive a pin, the pin, and a sole plate that is machined to bear on the pin. The pin is fabricated with shoulders to restrain it laterally within the plates. Clearance is provided between the ends of the plates and the inside faces of the shoulders to allow for lateral expansion of the bridge. For wide bridges, a greater clearance should be provided. A smooth finish is machined onto the pin and the mating surfaces. To prevent corrosion, all parts should be galvanized or metal­lized. Use of pin bearings, like rockers and bolsters, has widely been discontinued.

BRIDGE BEARINGS

Rollers. For long-span bridges with large reactions, rollers have been used, sometimes in combination with a geared rocker mechanism that is used to transmit the superstructure reaction to the rollers. Several rollers are usually installed in a roller nest, which is a box having (1) a bottom plate, on which the rollers bear, (2) end plates, and (3) substantial side bars by which the relative position of the rollers is maintained. Grease is placed in the box, and a skirt is added to shield the rollers from water and dirt. Unfortunately, the measures taken to prevent corrosion have often not been successful, and the rollers end up being piles of rusted steel, with all expansion capability lost.

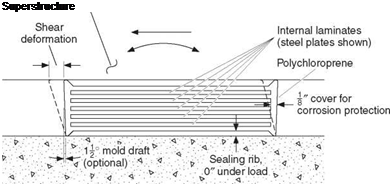
Elastomeric Bearings. The elastomeric bearing, in which superstructure translation can be accommodated by shear, is often the most economical type for both steel and concrete bridges. As shown in Fig. 4.14, this bearing consists of an elastomer such as natural or synthetic rubber (polychloroprene, or neoprene), with or without internal reinforcement, which may be steel plates or glass fiber fabric laminates. A steel-reinforced elastomeric bearing is cast as a unit in a mold and is bonded and vulcanized under heat and pressure; fabric-reinforced elastomeric bearings, popular in California, may be vulcanized in sheets and cut to size. Elastomeric bearings may have external steel load plates bonded to the upper or lower elastomer layer, or both. Natural rubber has better low-temperature properties than neoprene but is not as resistant to surface decay.
Подпись: Superstructure

In addition to accommodating horizontal movement by deforming in shear, elastomeric bearings can accommodate superstructure rotation. AASHTO design specifications provide methods for properly designing elastomeric bearings, taking into account both translation and rotation requirements. Another desirable attribute of elastomeric bearings is that they can tolerate movements or rotations in directions other than longitudinal. This is not true of sliding plates, rockers and bolsters, and pin bearings. For structures with large skew or curvature, where it is known either qualitatively or quantitatively that such out – of-plane rotations exist, this is a desirable quality. Elastomeric bearings can be fixed bearings (shear prevented), in which case the allowable average compressive stress may be increased 10 percent over that permitted for bearings allowed to deform in shear. Shear is prevented by placing anchor bolts through holes in the bearing, the holes being only slightly larger than the anchor bolts. Steel reinforcement of elastomeric bearings is protected against corrosion by being contained in the elastomer. A minimum cover of 1/8 in is maintained at the edges of the bearing, except at laminate-restraining devices and around holes that are entirely closed in the finished structure.

Under load, elastomeric bearings will undergo a compressive deflection that is determined by the shape factor (loaded plan area divided by the perimeter area free to bulge) and the hardness of the elastomer. Where the dead load compressive strain is significant, allowance should be made for it when establishing bridge seat elevations. The compressibility of elastomeric bearings should also be considered in the design of expansion joints. Joints with overlapping steel elements should be avoided.

A significant shear force can be induced in an elastomeric bearing by movement of the superstructure. This force should be calculated and used in design of the substructure, taking into account also the flexibility of the substructure. For large-movement bearings, a tall and uneconomical elastomeric bearing would be required if the movement were taken entirely by shear. As an alternative, a sliding surface can be combined with an elas­tomeric bearing so that the bearing initially deforms in shear until the shear force exceeds the frictional resistance of the sliding surface, at which point the bearing slides.

Disk Bearings. Disk bearings are used where rotations occur in different planes. They consist of a polyether urethane disk confined by upper and lower steel bearing plates. Fixed-disk bearings provide for rotations in all directions but do not provide for longitudinal or transverse movements.

To permit expansion, a polytetrafluoroethylene to stainless steel sliding surface is pro­vided above the upper bearing plate. Expansion disk bearings may be guided or nonguided. In a guided bearing, a guide bar or keyway system is used to restrict trans­verse movement, with the sliding surfaces being PTFE and stainless steel. Nonguided bearings allow rotation and longitudinal and transverse movement.

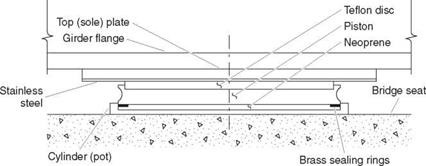
Pot Bearings. Pot bearings, like disk bearings, are used in curved or sharply skewed bridges or other complex structures where rotations occur in different planes. In a pot bearing, the rotational motion is accommodated by compression of elastomeric materi­al in a shallow steel base cylinder, or pot. The load is transmitted to the elastomer through a circular plate or piston, which is part of the upper load plate and which is just slightly smaller in diameter than the inner circumference of the pot. The surface of the elastomeric rotational element is lubricated or has PTFE attached to it to facili­tate rotation. Brass sealing rings are used between the steel piston and the elastomeric rotational element to prevent the elastomeric material from being squeezed out. This type of bearing is illustrated in Fig. 4.15. The elements of pot bearings that provide for

BRIDGE BEARINGS

guided or nonguided expansion are like those described for disk bearings. As can be concluded from the discussion of disk and pot bearings, these devices require expen­sive machining and demand high-quality materials. They are therefore expensive and will not likely be used where other, less costly bearings can serve adequately.

Seismic Isolation Bearings. Sometimes referred to as base isolation bearings, they generally perform two principal functions, namely, motion isolation and restoring, to achieve seismic isolation by shifting the period of the structure or cutting-off the load transmission path to the structure. Lead-core rubber bearings are developed based on the energy-dissipating properties of lead coupled with high-damping properties of elastomer to dampen the seismic forces. In friction pendulum systems, a concave sur­face allows pendulum motion of the slider or a cylindrical roller of the bearing to lengthen the natural period of the structure to reduce the lateral forces acting on the substructure. Eradiquake™ bearings are another type of friction isolation bearings in which the restoring mechanism consists of cylindrical rubber or MER (mass energy regulator) springs. Springs are positioned in orthogonal directions within the walls of the bearing box and the PTFE/stainless bearing in the center, to help dissipating the energy generated during a seismic event.