Category WATER IN ROAD STRUCTURES

Oedometer Test

The coefficient of permeability can be determined as a function of vertical strain in an oedometer test (see Fig. 3.9). The method is normally used for fine-grained (frictionless) soils to estimate their consolidation characteristics. The oedometer test is usually performed either as a constant stress or constant-rate-of-strain test. In a one-dimensional constant stress test a cylindrical specimen of soil enclosed in a stiff metal ring is subjected to a series of increasing static loads, while changes in thickness are recorded against time. The coefficient of permeability is given as:


(3.11)


K — cv ■ m v ■ Vw cv ■ m v ■ Pwg


where cv is the coefficient of consolidation, mv is the coefficient of volume com­pressibility, yw is the unit weight of water and g is the acceleration due to gravity.


^ Load

Oedometer Test


Fig. 3.9 Constant stress oedometer test


3.3.1.4 Pumping Tests

In the field, the average coefficient of permeability of a soil deposit can be de­termined by performing a pumping test where water is pumped from a well at a constant rate over a certain period of time. With time the drawdown of the water


Oedometer Test Подпись: (3.12)

table or the piezometric head will reach a steady state. The rate of discharge, q, from pumping is equal to the rate of flow of groundwater into the well, or

where h is the piezometric head at the radial distance, r, from the centre of the well.

By separating the two variables r and h and integrating between the two obser­vation wells at distances rj and r2 respectively from the test well, the permeability coefficient can easily be determined (see Fig. 3.10) as:

Подпись: (3.13)q ln(r2/rQ n (h2 — h 2)

Подпись: Fig. 3.10 Pumping test from a well with two observation wells in an unconfined permeable soil layer with an impermeable stratum underneath

q

3.3.1.5 Injection Tests

Injection tests, which are the reciprocal of pumping tests, are normally conducted by pumping water or air into a test section of a borehole and measuring the flow rate. By performing tests at intervals along the entire length of a borehole, a permeability profile can be obtained. Air (or another gas) is used as the “fluid” when testing areas of high permeability, as water cannot be provided at a high enough flow rate for such conditions.

Falling Head Test

In the falling head test the head is a function of time during testing while water from a standpipe flows through the soil. The falling head test is preferably used for soils with low permeability, i. e. silty or clayey soils (see Fig. 3.8). For such soils the problem of excessively high hydraulic gradients (Fig. 3.7) is avoided as well as the practical issue that, otherwise, the head would fall too rapidly.

Equating the instantaneous flow due flow of water through the specimen accord­ing to Darcy’s law with the flow necessary for continuity gives:

Подпись: VПодпись: *Falling Head TestFig. 3.8 Falling head permeability test

h dh

q = K A = —a 4 L dt


(3.9)


where q is the flow rate (L3/T), h — h (t) is the head difference (L) at time t, L is the length of the specimen (L), and a and A are the cross sections (L2) of the standpipe and the soil specimen, respectively. Integration of the left side with limits of time from t1 to t2 and on the right side for the corresponding limits of head in the standpipe, h1 and h2, and rearranging results in


aL h 1 ln.

A (t2 — t1) h 2


(3.10)


Permeability Tests of Saturated Soils and Aggregates

Traditionally in geotechnical engineering, the saturated permeability is estimated in the laboratory in a constant head test for coarse grained soils whereas a falling head test is used for fine grained soils. An oedometer test can also provide a measure of the saturated permeability for fine grained soils in the laboratory. Field tests which provide a measure of the saturated permeability are usually a kind of pumping well test, or injection test.

3.3.1.1 Constant Head Permeability Test

A constant head permeability test is usually used for coarse grained soils. The sam­ple is placed in the permeameter where a constant head drop is applied to the sample and the resulting seepage quantity is measured (see Fig. 3.5).

Подпись: Fig. 3.5 Constant head permeability test Permeability Tests of Saturated Soils and Aggregates

By rearranging and substituting into Eq. 2.15, the permeability K is given as:

where q is the discharge (L3/T), L is the specimen length (L), A is the cross section area of the specimen (L2) and h is the constant head difference (L).

There are limitations to the use of a permeameter test for pavement materials. Sub-bases or drainage layers normally contain particles with a maximum nominal size between about 20 and 80 mm. It has been suggested that to obtain reliable per­meability measurements that the value of the ratio of the permeameter diameter to the maximum particle diameter should be between 8 and 12. However, standard permeameters are generally too small and too fragile to allow the largest particles to be included and to achieve correct compaction. Head (1982) describes a 406 mm diameter permeability cell suitable for gravel containing particles up to 75 mm.

To help overcome this limitation, the UK Department of Transport (1990) intro­duced a large, purpose-designed, permeameter for testing road construction aggre­gates (Fig. 3.6). It measures horizontal permeability at low hydraulic gradients as these are the hydraulic conditions that might be anticipated in granular pavement layers.

Normally, Darcy flow is assumed to be the regime of permeating water in the soil or aggregate layers under a road, i. e. the water percolates at sub-critical velocities and without eddy-flow when moving from small to large pore spaces. This means that energy losses are only due to friction between the water and the surrounding solids and that a constant value of coefficient of permeability, K, can be defined. When coarse materials, with large pores, are tested for permeability in equipment such as that illustrated in Fig. 3.6, care must be taken to ensure that Darcy conditions are maintained throughout the test. Under many conventional test conditions, high hydraulic gradients are applied (much larger than in-situ) in order to obtain results in a convenient time scale. If such hydraulic gradients are applied to materials with large pores, eddy flows may develop in the large pores and more energy will be lost than Darcy conditions would predict. If the user is unaware of these conditions, the value of coefficient of permeability, K, will be under-estimated (see Fig. 3.7).

water supply

Permeability Tests of Saturated Soils and Aggregates

Ra"ge, of Darcy flow.

Подпись:Подпись: Hydraulic gradient, iPermeability Tests of Saturated Soils and Aggregatesgradients in Constant 9radient

Measured A response

Wrong interpretation of data point A using Darcy assumptions, leading to an underestimation of K

For this reason, tests should be performed at variable hydraulic gradients on coarse materials. Hydraulic gradients less than 0.1 may be required to achieve Darcy con­ditions. Alternatively, more advanced permeability formulations may be used such as those given in Eq. 2.21.

Permeability Testing

The permeability of soils is a material parameter that relates the rate of water flow to the hydraulic gradient in the soil and, therefore, determines the material’s suitabil­ity for drainage layers. An embankment usually consists of compacted materials. The compaction often results in anisotropy such that the vertical and the horizontal permeability properties are not equal. For road construction layers, water move­ments below the ground water table are almost entirely horizontal and thus it is the horizontal permeability that should be measured. Above the groundwater table in the unsaturated zone the movement of water is much more complex, involving vertical as well as horizontal components depending on material parameters such as temperature, water content and matric suction.

Some typical values of the coefficient of permeability for saturated soils are shown in Table 3.1.

The permeability of soils can either be estimated in saturated conditions or for par­tially saturated conditions. If the permeability of soils is estimated from saturated

Soil

Coefficient of perm. K (m/s)

Degree of permeability

Gravel

> 10-3

Very high

Sandy gravel, clean sand, fine sand

10-3 > K > 10-5

High to medium

Sand, dirty sand, silty sand

10-5 > K > 10-7

Low

Silt, silty clay

10-7 > K > 10-9

Very low

Clay

< 10-9

Virtually impermeable

Table 3.1 Typical values of the coefficient of permeability of saturated soils

samples and the unsaturated permeability is sought, the Soil Water Characteristic Curve (SWCC – see Chapter 2) can be used to predict the permeability for a speci­fied volumetric water content (Fredlund & Rahardjo, 1993).

Other Methods

A number of other methods exist for estimating soil water content such as nuclear magnetic resonance (NMR), which can detect nuclear species that have a magnetic moment or spin. As hydrogen has a nuclear spin of 1/2 the NMR technique can be used to estimate water content in soils. This is a fast and non-destructive method with high accuracy in uniform samples. However the method is costly, not suitable for field use and highly dependent upon sample calibration and is therefore not used in soil studies or in applications related to roads (Veenstra et al., 2005).

Near infrared reflectance spectroscopy (NIRS), seismic methods and thermal properties are all methods that can be used for estimation of soil water content. Although they are in many respects good and accurate methods, they all have some drawbacks making them non-suitable as routine methods to be used in the pavement environment. In the first two methods the calibration process is complex or difficult to perform due to the influence of other factors, and assessing the thermal properties of the soil is costly and needs a long measurement time relative to other methods (Veenstra et al., 2005).

Capacitance Measurements

Capacitive sensors measure the resonant frequency of an inductance-capacitance (LC) tuned circuit where the soil located in between two flat waveguides is the dielectric material. The inductance is kept constant and the resonant frequency f measured and therefore the capacitance can be calculated from

2n ^ e

where Le is the inductance and Ce is the capacitance. The capacitance Ce is a measure of the relative bulk dielectric constant of the soil and is a function of the water content of the soil (Veenstra et al., 2005). As with all dielectric moisture-based sensors, calibration is necessary for an accurate determination of the water content. Starr and Paltineanu (2002) give an overview of the current capacitance methods, their instrumentation and procedures.

Ground Penetrating Radar

In Ground Penetrating Radar (GPR), electromagnetic waves are sent out from a transmitter on or above the ground surface and picked up by a receiver after pene­trating and returning from the soil. The velocity of the electromagnetic wave propa­gation in soils is dependent on the soil bulk permittivity modulus (Grote et al., 2003). Thus the underlying principles of the GPR soil moisture measurements are the same as those of Time Domain Reflectometry except that in TDR the electromagnetic waves travel along a waveguide whereas with GPR the propagated electromagnetic waves are unconstrained. GPR therefore has the potential to cover a much larger soil volume than does TDR. GPR can be air launched or surface launched or used in boreholes and is completely non-invasive, whereas TDR requires the penetration of rods (waveguides) into the pavement structure.

GPR is primarily used to estimate material thickness but can also detect cables, culverts, steel wire net, the water table and frost depth, but as mentioned it can also be used to measure the dielectric value and therefore water content.

The resolution and depth range of the electromagnetic wave depends on the fre­quency used and the properties of the medium. Low frequency antennas 100… 500 MHz have good penetration and depth range but lower resolution, whereas high frequency antennas 500… 1000 MHz have a lower depth range, but they give better resolution. With a 400MHz antenna the depth range is typically 3.5-5 m and the resolution 8-10 cm. With a 1000 MHz antenna the depth range is below 1 m, but the minimum resolution is 3-4 cm.

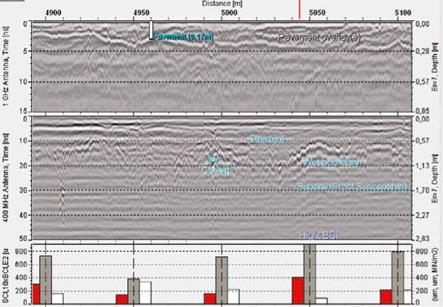
Figure 3.4 shows results from a GPR survey from Finland for a low-volume road structure. In the figure only the overlays can be clearly identified as the underlying layers are an old “unconstructed” local road. The figure allows comparison of GPR data with the results of a Falling Weight Deflectometer (FWD) assessment[5]. FWD testing can give an indication of weak subsoil in the form of a high BCI-index value as seen in Fig. 3.4 at station 5050 m (middle histogram). The figure also shows a high Surface Curvature Index (SCI) and a low stiffness (E2). At the same location, the 400 MHz ground radar image shows a strong reflection on the (wet?) boundary

Ground Penetrating Radar

Fig. 3.4 Ground penetrating radar images using a 1 GHz antenna (top) and 400 MHz antenna (mid­dle) along with FWD parameters (SCI, 10xBCI, E2) (bottom) from a 200 m long section on a low volume road in Finland. SCI and BCI are the Surface and Base Curvature Indices, respectively, and E2 is the stiffness of the pavement structure. See text for explanation

of the subsoil at a depth of 0.6-1 m. Elsewhere the boundary is not clear, which may then indicate mixing of subsoil and structure material by frost. The 1 GHz GPR image (top) shows that attempts to compensate for the weak road conditions have been made by adding new surface pavement layers, one after another, up to a thickness of 13-25 cm. Perhaps a better drainage system is the proper solution. The 400 MHz image also shows a culvert at 1m depth close to station 5000 m and that the very wet zone due to a frost susceptible layer continues between stations 5030 and 5100 m.

Radar images can give information on the appropriate depth and location for such a solution. The information is even more clear after the radar image is transferred onto a true longitudinal profile. What can be seen from ground radar images partly depends on the conditions (e. g. wet season and more clear wet boundaries; ground water level) or time of the year (e. g frost boundary or its absence at rock).

Time Domain Reflectometry Techniques

Time Domain Reflectometry (TDR) is a non-destructive electromagnetic technology that utilises the relationship between the relative permittivity (usually known as the dielectric constant, кг) of porous materials and their water content. Dry soils have values of dielectric constant of around 2-6 but water about 79-82 depending on wave frequency and water temperature. As the water content of the soil increases the dielectric constant also increases and is therefore an indirect indicator of the soil water content (Topp et al., 1980; Topp & Davis 1985; Svensson, 1997; Hillel, 1998; O’Connor & Dowding, 1999).

Time Domain Reflectometry Techniques Подпись: 2L t Подпись: (3.2)

Time Domain Reflectometry is nowadays the most common technique for mon­itoring water content in pavement structures and subgrades. Topp et al. (1980) used TDR to measure permittivity of a wide range of agricultural soils and developed an empirical relationship between the permittivity and the volumetric water content which made it possible to use TDR in monitoring the water content of a given soil. A schema of a TDR probe is shown in Fig. 3.2 (Ekblad, 2004). Usually the probes have 2 or 3 rods of length, L (normally approximately 300 mm in length). They act as a wave guide while a transmitter inside the probe generates a pulse of frequencies up to 1 GHz which propagates along the metal conductors of the sensors. An electro­magnetic field is therefore established around the probe. The pulse is reflected back to the source at the end of the conductors. The transit time of the pulse is therefore estimated according to

where ce is the velocity of the electromagnetic pulse, L is the probe length and t is the transit time.

The determination of the dielectric constant is thereafter achieved from the basic equation

Подпись: (3.3)c0

ce = Г ——–

Kr ■ —r

Подпись: Fig. 3.2 Schema of a TDR-probe. Dimensions are in mm (Ekblad, 2004). Reproduced by permission of Jonas Ekblad Time Domain Reflectometry Techniques

in which c0 is velocity of light, кг is the dielectric constant and – r is the relative magnetic permeability. Most soils are practically nonmagnetic, thus their relative magnetic permeability is close to unity. Roth et al. (1992) investigated ferric soils

Подпись: Kr Подпись: (cot)2 4 L 2 Подпись: (3.4)

and could not find any influence of magnetic properties on the volumetric water content. By inserting ce from Eq. 3.2 and rearranging, the dielectric constant can be estimated as

where the relative magnetic permeability has been set to unity.

TDR moisture probes express their readings as a volumetric water content в, defined as in Eq. 2.9 which can be related to gravimetric water content, w, as in Eq. 2.11. The volumetric water content is obtained via a relationship with the relative dielectric constant which is based on an empirical approach. A number of relationships exists which, frequently, have been derived using regressions analyses. Topp et al. (1980) gave the relationship as:

в = -5.3 x 10⁻² + 2.92 x 10⁻²Kr – 5.5 x 10-Vr2 + 4.3 x 10⁻⁴Kr3 (3.5)

Their analysis was based on a variety of soil types although many were low density agricultural soils. Jiang and Tayabji (1999) derived a similar third-order polynomial relationship for coarse grained soils as:

в = -5.7875 x 10⁻² + 3.41763 x 10⁻²Kr -1.3117 x 10⁻³к2 + 2.31 x 10⁻⁵к3 (3.6)

Thus, by combining either Eq. 3.5 or Eq. 3.6 with Eq. 3.4, it is possible to relate volumetric water content to transit time.

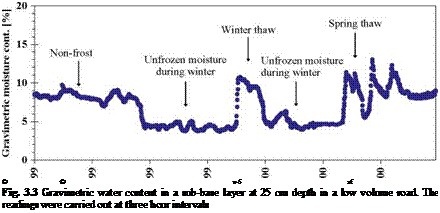
Подпись: © © т-5 rf Fig. 3.3 Gravimetric water content in a sub-base layer at 25 cm depth in a low volume road. The readings were carried out at three hour intervals

It is not uncommon that TDR sensors can measure transit time with a resolution of 10 picoseconds, which corresponds to a water content of approximately 0.1% by volume. Figure 3.3 shows readings from a TDR probe over a seven month period,

starting in the autumn of 1999, at a depth of z = 25 cm in a sub-base layer in SW Iceland (Erlingsson et al., 2000; 2002). Gravimetric water content is plotted after Eq. 2.11 has been applied to the TDR readings. In the period October to late November the actual water content decreased at a slow rate, with irregularities due to rainfalls. The freezing period started in late November which can be seen as a rapid drop in the water content. As the soil was frozen the TDR registration represents the unfrozen water content but not the actual water content in the layer. A two week long thawing period can be seen in January 2000. The spring thaw period started in early March and influenced the water content in the sub-base for more than a month.

Non-destructive Methods

A number of methods exist for estimating the soil water content of road materials in a non-destructive way assuming that the instruments are placed in the road during
the construction phase. They are all indirect methods as they involve measurements of some property of the material affected by the water content or they measure a property of some object placed in the material. Some of the more common indirect methods used in the highway environment are briefly described here.

3.2.2.1 Neutron Scattering Method

In the neutron scattering method a tube acts as a radioactive source and a detector. The radioactive source is placed at the end of a rod inserted into a pre-made hole to a depth of, typically, 150 and 300 mm. High energy neutrons are emitted from the source and the neutrons collide with nuclei of atoms in the surrounding soil, thus reducing the energy level of the neutrons. They are slowed substantially by collision with nuclei of similar mass, usually hydrogen atoms, making this tech­nique sensitive to water content. Therefore the proportion of neutrons returning to the tube’s detector is proportional to the water content of the soil the neutrons have travelled through (Hignet & Evett, 2002; Veenstra et al., 2005). As the neutron scattering method is based on radioactive decay, any other radioactive elements that are present, for example inside the pavement structure, may affect the results.

The neutron scattering method is frequently used along with gamma ray atten­uation in nuclear moisture-density devices where both water content and density measurements are provided (see Fig. 3.1). The gamma ray attenuation method uses a beam of gamma rays emitted from a radioactive isotope of caesium that is sent through a soil sample of known volume and measured by a detector. The hydrogen atoms in the water scatter neutrons and the amount of scatter is proportional to the total unit weight of the material.

Подпись: Fig. 3.1 An example of equipment where the neutron scattering method is combined with the gamma ray attenuation method is this Troxler instrument. Courtesy of the Danish Road Institute
Non-destructive Methods

Neutron scattering is an accurate and precise method for soil water content mea­surements. However it cannot be left unattended due to its radioactive source and can therefore not be used in an automated monitoring programme.

Water Content

A fundamental parameter that characterises the water movement in pavements is the water content. This provides information on the condition of the road layers regarding the moisture saturation stage, which controls the main parameters in the governing equations for water flow (see Chapter 2, Section 2.8). A number of meth­ods are available for measuring water content. They can be divided into destructive methods (gravimetric methods) and non-destructive methods that provide indirect measurements of the water content.

3.2.1 Gravimetric Method

Water Content Подпись: (3.1)

The simplest and most widely used method to measure the soil water content is the gravimetric method where a soil sample is taken and weighed, dried in an oven at 105 °C for 24 h and then reweighed. To shorten the drying period a microwave oven can be used as an alternative, although this method introduces the possibility of removing chemically bonded water which would lead to an over-estimation of water content. The gravimetric water content, w, is the mass of water per mass of dry soil (see Eq. 2.10) or

where Wb is the total (or “bulk”) weight of the soil and Wd is the dry weight of the soil.

This method has two major drawbacks: the sampling is destructive for the road and the method can not be used to make in-situ measurements in real time. However it is an accurate method and is often used to calibrate other measurement techniques.