Posted by admin on 13/ 11/ 15
Contractors will often ask if they can substitute a product that is different from the one you have specified. The specified product may be unavailable, too expensive, or too difficult to apply, or contractors may have one that they have used before and prefer. New and healthier products continue to be developed; it may be worth your while to consider certain substitutions. The first step in researching alternatives is to examine the Material Safety Data Sheet (MSDS). (Refer to the section on MSDS that follows.) You may also request a physical sample. To ensure that no substitutions are made without your consent or that of your architect, you may wish to add the following language to your agreement:
• No products may be substituted for the specified product unless agreed upon in writing by the owner or architect.
• An MSDS and product literature must be
provided on any substitution for it to be considered.
• Submit a physical sample to the owner or architect whenever possible.
Product Evaluation
Since the last edition of this book, the availability of products considered acceptable for a healthy house has skyrocketed. An emerging problem when evaluating products for use in your healthy home is determining just how healthy a product will be. Some manufacturers have deliberately sought to capitalize on the burgeoning green market by engaging in what is being termed “green washing,” making claims that are not necessarily borne out by evidence. Others have created acceptable products to satisfy regulatory compliance. Not all products that are promoted as green are acceptable for a healthy home and some are more acceptable than others. Some products are considered green because they use recycled materials; others may be labeled green because they come from a sustainable resource or conserve energy. Chemical formulations may be “safe for the environment” but when confined in an indoor area may still cause adverse reactions for people. Very few products will be universally acceptable for people with multiple chemical sensitivities. Consumers interested in healthy construction need to remain vigilant and do their homework. Chemically sensitive individuals will need to be the most vigilant.
Several resources have emerged to help consumers do their own research to find safer and more environmentally sound products. In 1986, California voters passed Proposition 65, the Safe Drinking Water and Toxic
Enforcement Act.1 It was intended by its authors to help protect Californians by informing them about chemicals known to cause cancer, birth defects, and other kinds of harm. The law states that “no person in the course of doing business shall knowingly and intentionally expose any individual to a chemical known to the state to cause cancer or reproductive toxicity without first giving clear and reasonable warning…” The governor is required to publish annually a list of chemicals that are considered problematic. The current list contains several hundred chemicals.
In 2003, the law was amended by the legislature to set aside a sizable amount of any penalties collected under this law to help pay for future enforcement. The results have been far-reaching. The law’s requirement that products with any of the hazardous ingredients listed have a warning on the label has served as an inducement for manufacturers to create healthier products for the California market, which are then often distributed nationwide. Since the list is updated annually, it is in a manufacturer s best interest to develop products that are safe so they do not have to be reformulated later.
Other incentive certification programs have been developed to help promote products that meet low-emissions criterion. One of these is the GreenGuard Certification Program for Low Emitting Products, founded in 2001. The certification is a voluntary program available to manufacturers who choose to submit their products for regular evaluation. The program is supported by fees paid by the manufacturers. Product criteria vary with the type of product, but in general a product must be tested to release less than the preestablished levels of volatile organic compounds, aldehydes, formaldehyde, and styrene. Adhesive and sealant products also have limits on the amount of 4-Phenylcyclohexene (4-PC) they can emit.
While GreenGuard certified products may be better than many of the conventional products available, certification doesn’t guarantee that the products are free of all emissions. Therefore, because products are tested individually, the total impact of several low-emissions products used together may affect sensitive individuals. Furthermore, the tests reflect levels at seven days after installation, and levels of emissions will be higher when first installed, before the rooms are flushed out. Ingredients that are listed under California’s Proposition 65, the US National Toxicology Program, and the International Agency on Research on Cancer are not prohibited for certification but must be listed. Primary or secondary outdoor pollutants cannot exceed concentrations permitted by National Air Quality Standards. Volatile organic compounds must be less than one-tenth of the Threshold Limit Value set for industrial exposure by the American Conference of Government Industrial Hygienists. Products are tested in a chamber following a set protocol and not under actual use conditions. Because the tests use an amount of material with the same “exposed surface area to room volume” found in a typical indoor environment, the results are intended to approximate an accurate picture of emissions in real – life situations.
While GreenGuard provides some level of independent certification of emission levels, it does not provide an evaluation of the products themselves and how well they work or other considerations for usage. The McDonough Braungart Design Chemistry firm offers a certification based on the principles popularized by their book Cradle to Cradle: Remaking the Way We Make Things. Throughout their lifecycle, products certified by Cradle to Cradle must satisfy established criteria for both human and environmental health. To qualify, materials need to be sustainable and able to be recycled or broken down to form beneficial nutrients. Products must identify their ingredients down to a level of 100 parts per million, meet other toxicity requirements, have a plan for using solar energy for their manufacture, conserve water, not pollute water, and be socially responsible. Cradle to Cradle certification is offered at various levels. Because at the lowest level it can be used by products that have not been evaluated for emissions, being certified does not necessarily demonstrate acceptability from a health standpoint. Even being rated at the highest level does not ensure that a product will be suitable for all chemically sensitive individuals.
Green Seal is an independent nonprofit organization dedicated to safeguarding the environment. It is continually establishing new standards and certification programs for various product and service categories. Once a product category standard is developed by Green Seal, manufacturers can submit their products for evaluation. After they become listed, products are reviewed each year to ensure they continue to comply. The Green Seal program is discussed further in the section on commercial cleaning products later in this chapter. Other product categories include adhesives and floor care products. The reader should review the standards for products of interest to determine acceptability. For example, the standard for compact fluorescent lighting allows up to 10 milligrams of mercury per lamp, although lower-level compacts are available.
Scientific Certification Systems offers an Environmental Certification Program for products meeting voluntary indoor air quality goals. The company has participated in creating independent third-party standard verifications for a number of programs. Their Indoor Advantage Gold program sets limits for formaldehyde, aldehydes, and 4-PC in paints and other household maintenance products. Requirements for products vary and should be checked on the Scientific Certification Systems website.
Although certifications provide information that products meet certain minimum criteria, the actual test results for products are kept confidential, so it is not possible for the consumer to compare the various certified products to one another to see which have the lowest emissions. Forums are beginning to emerge that provide a platform for consumers to post their experiences with a product. The potential of these venues is tremendous, especially for chemically sensitive individuals, but only time will tell which will emerge as having the greatest value. One resource for consumer review and comment on green building products is Rate It Green, which lists many of the products we recommend and will hopefully emerge as a strong companion to our book for the consumer interested in constructing a healthy house.
Posted by admin on 13/ 11/ 15
The kingdom of Urartu, in the south of Armenia, was a powerful rival of Assyria during the period from about 850 BC to 600 BC. Its capital was Tushpa, on the shores of the lake Van, whose water is too salty to be potable. Therefore this capital city’s thirst led to the development of a vast water management program in this mountainous region, developed in successive stages (Figure 2.18).
In about 800 BC, the king Menua brought water to the capital from a perennial and abundant spring located some thirty kilometers to the southeast. The 56-km canal – aqueduct built for this purpose carried at least 1.5 m3/sec, and was destined to be used
|
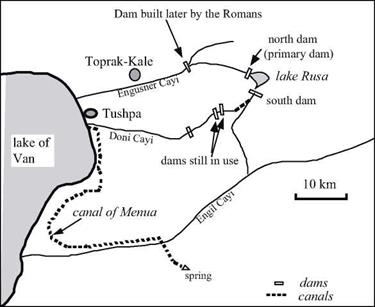
Figure 2.18 Water supply for the two successive capitals of Urartu (Tushpa and Toprak Kale) in the 8th century BC – after Garbrecht (1980, 1988).
|
for 2,500 years until it was partially renovated in 1950.
Later, probably about 670 BC, the king Rusa II[77] [78] moved the capital some ten kilometers to the north (Rusahinili, today Toprak-Kale). The two rivers that supply the two cities, the Engusner and the Doni, are intermittent. Therefore the sovereign created an artificial reservoir, the Rusa lake (today this is the lake Keshish Golti, whose water level is 10 m lower than at the time of king Rusa). The lake was created by damming two natural outlets of a mountain basin. The north dam has been measured at 15 m high and 75 m long, and the south dam at 7 m high and 62 m long.
This south dam has been well preserved (it is no longer in contact with water, for the lake is now 10m lower). It is constructed of two walls of dry stone, each 7 m thick, containing an earth fill of thickness 13 m. Water is conveyed from this south dam to a secondary dam-reservoir on the Doni Cayi, in part to provide for irrigation of the Tushpa region. Later, other dams are built downstream on the two rivers, to increase the storage capacity.
Thus we see that the water management system of lake Rusa includes several dams. Over the centuries, the north outlet of the lake has apparently been destroyed and rebuilt several times, which may explain the existence of a dam attributed to Roman times, downstream on the Engusner Cayi. Its most recent reconstruction, lower than its original height, dates from 1950. The dam-reservoirs upstream on the Doni Cayi are still in service today. These are probably the oldest dams still in use[79] in the entire world.
Posted by admin on 13/ 11/ 15
The sovereigns of Assyria begin development of their land on the upper course of
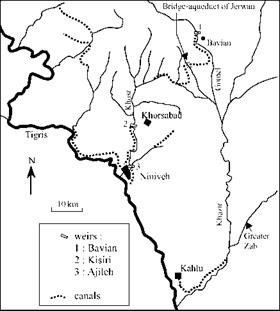
Figure 2.15 Irrigation and water supply works in Assyria in the 9th and 8th centuries BC (after Jacobsen and Lloyd, 1935; Roaf, 1990; Schnitter, 1994; Bagg, 2000)
the Tigris in about 900 BC. This date marks the flowering of an Assyrian Empire destined to reign over all of Mesopotamia, and even as far as Egypt, for about three centuries. In 860 BC, Ashurnasirpal builds a new capital Kahlu (today Nimrud) on the left bank of the Tigris near its confluence with the upper Zab. A canal called babilat nuhshi (“bringer of abundance”) is dug to irrigate the plain with waters of the Zab diverted into the canal by a dam or weir.
It is interesting to note also that a ventilation system comprising chimneys (“air doors”) provides fresh air taken from the roofs of the royal palace to its grand rooms. But it is Sennacherib, the destroyer of Babylon, whom we are now going to see in a different light. He was a lover of gardens. Since Khorsabad, the ephemeral city created by his father Sargon II, was too austere, Sennacherib re-adopts Nineveh as his capital. Taking advantage of his unlimited supply of manpower, he immediately sets out to acquire the water necessary for his horticultural aspirations (Figure 2.15). His first project, in 703 BC, is a 16-km long canal, fed by the Khosr, that brings water to the plain to the west of Nineveh. The waters of this canal, diverted into it by means of an overflow weir at Kisiri, irrigate orchards on plots allocated to the inhabitants of the capital through a lottery system:
. from the environs of Kisiri to the plain of Nineveh, across mountains and valleys, using iron picks, I dug a canal. Along a distance of one beru and a half (16 km) I took water from the river and made it flow down to irrigate the orchards.”[75]
Several years later, the area is in need of even more water. Sennacherib himself sets off into the mountains to see what springs existed. In 694 BC he had water tapped from the springs in the hills northeast of the city and brought to Ajileh, on the Khosr. The remains of two diversion weirs, constructed of large blocks of cut stone, are still visible there. But this new influx of water exacerbated the damaging floods in the Khosr. Therefore the king built a weir downstream of Ajileh to divert floodwaters into a canal going around the city to the south, and thence into artificial lakes. The king had plants and birds brought from the marshes of Babylonia, where he had admired them, to these lakes. The diversion weir was of serpentine shape, having a long crest length of 230 m that thus limited the rise of water during floods. The height of the weir itself was three meters.
But in the end even this additional water supply was insufficient, so its most spectacular feature was added to finally complete the system in 690 BC. Water was diverted from the Gomel, a tributary of the Zab to the north, and brought to the Khosr through a 55-km lined canal-aqueduct formed of lateral walls of cut stone crossing valleys on arches. At Jerwan (Figure 2.17) one can still see the remains of a magnificent bridge – aqueduct 275 m in length and 22m wide, crossing a valley by means of five arches each 4.75 m high. The diversion works on the Gomel at Bavian apparently included an oblique weir across the river. The canal, 6 m wide at its origin, passes through a short tunnel to cross a rocky spur.
Above the intake there are inscriptions that praise the hydraulic works of Sennacherib.[76] These inscriptions also describe an incident that occurred during the inauguration of the project, an incident that would surely have been very unfortunate for the engineers had the king not been in a good mood. The water pressure caused the closed gates to fail before they had been opened, allowing water to surge into the canal:
|
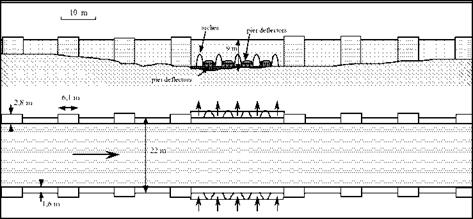
Figure 2.17 A central portion of the bridge-aqueduct of Sennacherib at Jerwan. It is made of essentially cubical 50-cm stone blocks, and is inscribed with the following text: “Thus says Sennacherib, king of the world, king of Assyria: over a great distance, bringing waters (…) of the river called Pulpullia (…), and from springs here and there along its course, I dug a canal to the edge of Nineveh. Across steep ravines, I threw a bridge of white stone blocks. And these waters, I made them cross over on this bridge.” (sketch and citation from Jacobsen and Lloyd, 1935).
|
“To inaugurate the canal, I summoned the priests (…) and made offerings of lapis lazuli (a semiprecious stone), precious stones and gold to Ea, god of springs, fountains, and prairies, and to Enbilulu, god of rivers. I prayed to the great gods, and they heard my prayer. The gate yielded and let water enter in abundance. Even though the engineers had not opened the gate, the gods assured that the water found its way. After having inspected the canal and put things back in order, I offered sacrifices to the great gods (….) To the men who had dug the canal, I offered white linen cloth and colored woolens; I decorated them with rings and daggers of gold.”
This system is perhaps the first example of cross-basin water transfer.
It is also likely during the era of the Assyrian Empire that irrigation canals were constructed on both banks of the Khabur, nearly continuously along the length of the river.
Posted by admin on 13/ 11/ 15
A ramp terminal is the portion of a ramp adjacent to the through lane on the mainline. It includes both the taper and the speed-change lane. Ohio has recently revised its terminal criteria and uses two basic terminal classifications:
High-speed terminals are intended for use on all facilities with a design speed of 50 mi/h (80 km/h) or higher. They are used in both rural and urban locales. Figure 2.41 shows the details for high-speed single-lane entrance terminals. This terminal is a taper-type design for the last 1250 ft (381 m), tapering from a 25-ft (7.6-m) offset from the mainline to zero. Tables A and B in Fig. 2.41 provide information for designing the length of the terminal to provide adequate distance for entering vehicles that matches or nearly matches the design speed of the mainline. This must be achieved by the time the terminal narrows to 12 ft (3.7 m) in width (see Fig. 2.41). Figure 2.42 provides design information for high-speed single-lane exit terminals that are used in both rural and urban locales. In the urban environment, a sharper departure curve is permitted for the exit curve, which allows for a slower speed exit. Once again, Tables A and B are provided in Fig. 2.42 to determine the proper terminal length based on mainline speed, first curve speed, and vertical grade adjustment.

* lanijth Stay За fncraassd Far Sup*rm ft *o т гол Transition +* To Do tor mint Lp. Sub f roc t is Ana Lt Fro» i„
* + + ІЛаШіпа pawad shouldtr width os rtqvi’td by

л*о r*j For Si/ufft Ian* £t1raoct Тагмілаіш
L Tht minimum accolorotiaa tangth* і &ho! t b* It *■ Lt.
2. Tht 9r to 2У woriab/t rid lb of trtoftd shootdar of Ihs *n franco tor mine I stroll bt s/apsd for 12′ as raqvirtd for яоіпііщ da sign /у*иоііу j£jm. Sft+l tectpt (or tha tost /00′ to 200′ at ths 9′ and. which It to b* stopmd os rtparrtd for praptr tarm/not grading.
X Normally sing ft font romps *гШ ho r# о width pf t6 Ths width shat! bo incr+ostd to whan th r romp гв^у)
is lass than 200′. ШЬ»л an /S’ w ids romp »j mod. ths 25* oatroac-щ tarminot width shaft to rtfoinad and th* 9‘ width rodvcod by 2*.
A. if tp tparoflol isngtht is not ropairod H f- S50*L than th» 2QQ" minimum spiral shootd b* tango* t to ths SOft Гарт
|
Uo in line Design Speed. V (mph)
|
Acceleration length, L (ft) for design speed of lost romp curve, Vr (mph)
|
|
Stop
|
IS
|
20
|
25
|
30
|
35
|
40
|
45
|
50
|
|
SO
|
720
|
660
|
610
|
550
|
450
|
350
|
130
|
–
|
–
|
|
55
|
960
|
900
|
810
|
780
|
670
|
550
|
320
|
150
|
–
|
|
60
|
1200
|
1140
|
1100
|
1020
|
910
|
800
|
550
|
420
|
180
|
|
65
|
1410
|
І350
|
1310
|
1220
|
1120
|
1000
|
770
|
600
|
370
|
|
70
|
1620
|
1560
|
1520
|
1420
|
1350
|
1230
|
1000
|
820
|
580
|
|
TABLE B High-speed entrance terminal adjustment factors as a function of grade
|
Mainline Design Speed (mph)
|
Ratio of length on grade to length on level for design speed of lost romp curve ImphJn
|
|
20
|
25
|
30
|
35
|
40
|
45
|
50
|
AH Speeds
|
|
3 to 4X upgrade
|
3 to AX downarode
|
|
50
|
1.30
|
1.35
|
1. 40
|
1.40
|
1.40
|
–
|
–
|
0.65
|
|
55
|
1.35
|
і 40
|
1.45
|
1.45
|
1.45
|
–
|
–
|
0.625
|
|
60
|
1.40
|
1.45
|
1.50
|
1.50
|
1.50
|
1.55
|
1.60
|
0.60
|
|
65
|
1.45
|
1.50
|
1.55
|
1.55
|
1.60
|
1.65
|
1. 70
|
0.60
|
|
70
|
1.50
|
1.55
|
1.60
|
1.65
|
I. 70
|
1.75
|
ISO
|
0.60
|
|
5 to 6X upgrade
|
5 to 6X downarode
|
|
50
|
1.50
|
1.60
|
1. 70
|
1.80
|
1.90
|
–
|
–
|
0.55
|
|
55
|
1.60
|
1. 70
|
1.80
|
1.90
|
2.05
|
–
|
–
|
0. 525
|
|
60
|
1. 70
|
1.80
|
1.90
|
2.05
|
2.20
|
2.35
|
2.50
|
0.50
|
|
65
|
1.85
|
1.95
|
2.05
|
2.20
|
2.40
|
2.60
|
2. 75
|
0.50
|
|
70
|
2.00
|
2.10
|
2.20
|
2.40
|
2.60
|
2.80
|
3.00
|
0.50
|
No adjustment required for grades less than 3X.
|
* Ratio from this table multiplied by acceleration length inTobfeA gives occeierotion length on grade.
The ‘’grade" in the table is the overage grade measured over the distance for which the occe ter at ion length applies.
FIGURE 2.41 High-speed single-lane entrance terminal. Conversions: 1 mi/h = 1.609 km/h, 1 ft = 0.305 m. (From Location and Design Manual, Vol. 1, Roadway Design, Ohio Department of Transportation, with permission) (Continued)
• • The Угпітит Deceleration Length, L, After Adjustment for Gradet
     
Table B, S^xj// Be 600′
• •• Or Other Design Speed Li/nitlnq Geometric Control Such As The Stopping
Sight Distance for A Vertical Ctxve Or The воск Of A Traffic Oueoe.
* uainline paved shoulder width os retired by ТсЫе 2.22 Of 223.
Notes for Single-Lone Exit Terminals
1. The Exit Cirve should nor mol I у be Г-JO’ (RuroU or 49-00′ (Jr bon) where The mainline is on Tangent. Where the mainline is on curving alignment, the maximum differential between the Exit Curve and the mcinline curve should normally
be f-JO’ iRuroll or 49-00‘ IUrbant. This differential. however, moy vary by as much os one degree in order to
ovoid a tangent exit oligrvr>ent. (See Section SOJ.6.4 for The oliowoble tronsverse breaks in superelevation cross-slope.>
2. When the First Ramp Curve does not exceed в9, the Exit Curve moy be compounded directly with the first Romp Ciwe ot a RCC КЮ’ beyond the nose. When the first Ramp Curve does exceed 69, c spiral should be placed between the Exit Curve and the first Ramp Curve and the beginning of the spiral (CS) should be ot the nose.
J. Normally single lone romps will hove a width of (S’. The width shall be increased to Ш’ when the ramp rod>us is lass than 200′. when an I6‘ wide romp Is used, the J9′ exit Terminal width shall be retained and the 2J’ width reduced by 2‘.
|
Mo in line Design Speed. V (mph)
|
Deceleration length, L (ft) for design speed of first ramp curve, Vr (mph) ***
|
|
Stop
|
15
|
го
|
25
|
30
|
35
|
40
|
45
|
50
|
|
50
|
435
|
405
|
385
|
355
|
315
|
265
|
225
|
175
|
–
|
|
55
|
460
|
455
|
440
|
410
|
380
|
350
|
285
|
235
|
–
|
|
60
|
530
|
500
|
480
|
460
|
430
|
405
|
350
|
300
|
240
|
|
65
|
570
|
540
|
520
|
500
|
470
|
440
|
390
|
340
|
■280
|
|
70
|
615
|
590
|
570
|
550
|
520
|
490
|
440
|
390
|
340
|

0 P. C.C. Or Mid-Point of 200′ Spiro I
00 Th» Minimum Deceltrotion Length, L. After Adjustment For Grode (Table В ) fS BOO*
000 Or Other Design Speed Limiting Geometric Control Such As The Stopping
Sight Distance For A Verticol Curve Or The воск Of A Troffic Queue.
|
TABLE B High-speed exit terminal adjustment factors as a function of grade
|
Mainline Design Speed (mph) •
|
Ratio of length on grade to length on level for design speed of first ramp curve (mph)*
|
|
AH Speeds
|
All Speeds
|
|
3 to 4X upgrade
|
3 to 4X downgrade
|
|
AH Speeds
|
0. 90
|
1.20
|
|
|
|
|
5 to 6X upgrade
|
5 to 6X downgrade
|
|
All Speeds
|
0.80
|
1.35
|
No adjustment required for grades less thon 3X.
|
* Ratio from this table mult ip tied by dece lerot ion length in Table A gives dece lerot ion length on grade.
The ‘grade" in the toble is the average grade measured over the distance for which the dece lerot ion length applies.
FIGURE 2.42 High-speed single-lane exit terminal. Conversions: 1 mi/h = 1.609 km/h, 1 ft = 0.305 m. (From Location and Design Manual, Vol. 1, Roadway Design, Ohio Department of Transportation, with permission) (Continued)
|
Low-speed terminals are intended for use on highways that have little or no access control except through an interchange area. Many of the features of low-speed terminals are applicable to a terminal of one ramp with another ramp in complex interchanges. Low-speed terminals are also used with collector-distributor roads. Figure 2.43 and Table 2.29 provide design details for low-speed terminals.
|
|
 |
 |
 |
|
|
|
CURBED ENTRANCE
PAVED SHOULDER DETAIL
|
|
|
|
|
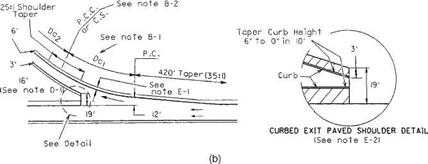
FIGURE 2.43 Low-speed ramp terminals. (a) Entrance terminals. (b) Exit terminals. See Table 2.29 for notes. Conversions: 1 ft = 0.305 m, 1 in = 25.4 mm. (From Location and Design Manual, Vol. 1, Roadway Design, Ohio Department of Transportation, with permission)
|
|
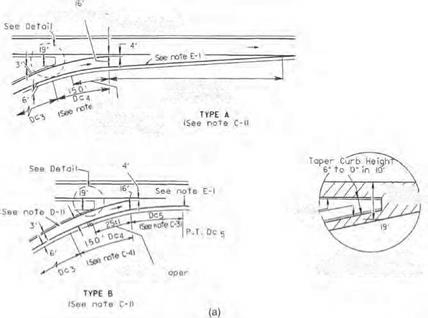
TABLE 2.29 Design Notes for Low-Speed Entrance and Exit Terminals
See Fig. 2.43
A. General
1. Low-speed terminals are intended for use on highways which have little or no access control except through an interchange area. Many of the features of low-speed terminals are applicable to a terminal of one ramp with another ramp in a freeway interchange.
B. Exit terminal
1. The curve differential between the through roadway and exit curve DC1 may vary from a minimum of 4° to the maximum allowable differential.
2. Exit curve DC1 may be either compounded or spiraled into ramp curve Dc2.
C. Entrance terminal: type A and type B
1. Type A is preferred and shall normally be used; however, when a ramp enters as an added lane or as a combined acceleration-deceleration lane, type B may be used if its use would result in a substantial savings in cost (i. e., reduced bridge width).
2. The acceleration lane of type A shall be a uniform taper (35:1) relative to the through pavement edge for either tangent or curving alignment.
3. The curve differential between the through roadway and entrance curve Dc5 of type B shall be 4°.
4. The design of the entrance terminal shall be based on the following:
(a) Ramp curve Dc3 of 8° or less. When the through roadway is on a tangent or a curve to the right, Dc4 shall be a 150-ft-long simple curve of a degree such that the differential between it and the through roadway will not exceed 4°. When the through roadway is on a curve to the left, a 150-ft tangent shall be substituted for Dc 4.
(b) Ramp curve Dc3 greater than 8°. A 150-ft spiral shall be substituted for Dc4.
D. Ramp width
1. Normally, single-lane ramps will have a width of 16 ft. The width shall be increased to 18 ft when the ramp radius is less than 200 ft. When an 18-ft-wide ramp is used, the 35-ft exit and 20-ft entrance terminal widths shall be retained and the 19- and 4-ft widths reduced 2 ft.
E. Treated shoulder
1. The width of the treated shoulders along the speed change lane shall be as shown in Fig. 2.25.
2. If the ramp or through roadway has a curb offset greater than 6 ft (or 3 ft) the greater width shall be used at the terminal. Retain the 19-ft width.
3. The special detail drawings shall apply when the through roadway is curbed.
F. Left side terminals
1. Left side entrance and exits shall be designed similarly to the drawing shown, but of opposite hand.
Conversion: 1 ft = 0.305 m.
Source: Location and Design Manual, Vol. 1, Roadway Design, Ohio Department of Transportation,
with permission.
Posted by admin on 13/ 11/ 15
An interchange ramp is a roadway that connects two legs of an interchange. Ramp crosssection elements are discussed in Art. 2.3, Cross-Section Design. Elements contributing to horizontal and vertical alignments are designed similar to any roadway once the ramp design speed has been determined.
2.5.1 Ramp Design Speed
To design horizontal and vertical alignment features, a design speed must be determined for each ramp. Since the driver expects a speed adjustment on a ramp, the design speed may vary within the ramp limits. Table 2.28 includes three ranges of ramp design speeds that vary with the design speed of the mainline roadway. The ramp design speed range is determined by judgment based on several conditions:
• The types of roadways at each end of the ramp and their design speeds
• The length of the ramp
|
PARTIAL
CLOVERLEAF
|
|
A
|
L
|
|
ALL DIRECTIONAL FOUR LEG
|
‘ST’""
|
|
|
|
SINGLE-POINT
URBAN INTERCHANGE
|
|
|
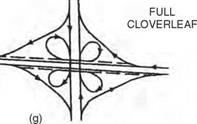
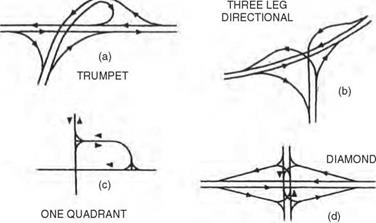
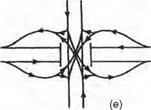
FIGURE 2.40 Common types of interchanges. (a) Trumpet. (b) Three-leg directional. (c) One quadrant. (d) Diamond. (e) Single-point urban. (f) Partial cloverleaf. (g) Full cloverleaf. (h) All directional four leg. (From A Policy on Geometric Design of Highways and Streets, American Association of State Highway Officials, 2004, with permission)
|
|
|
TABLE 2.28 Guide for Selecting Ramp Design Speed
|
Mainline design speed, mi/h
|
30
|
35
|
40
|
45
|
50
|
55
|
60
|
65
|
70
|
|
Ramp design speed, upper range, mi/h
|
25
|
30
|
35
|
40
|
45
|
45
|
50
|
55
|
60
|
|
Ramp design speed, middle range, mi/h
|
20
|
25
|
30
|
30
|
35
|
35
|
40
|
45
|
50
|
|
Ramp design speed, lower range, mi/h
|
15
|
15
|
20
|
20
|
25
|
25
|
30
|
30
|
35
|
|
Mainline design speed, km/h
|
48
|
56
|
64
|
72
|
80
|
88
|
97
|
105
|
113
|
|
Ramp design speed, upper range, km/h
|
40
|
48
|
56
|
64
|
72
|
72
|
80
|
88
|
97
|
|
Ramp design speed, middle range, km/h
|
32
|
40
|
48
|
48
|
56
|
56
|
64
|
72
|
80
|
|
Ramp design speed, lower range, km/h
|
24
|
24
|
32
|
32
|
40
|
40
|
48
|
48
|
56
|
Source: Location and Design Manual, Vol. 1, Roadway Design, Ohio Department of Transportation, with
permission.
|
• The terminal conditions at each end
• The type of ramp (diamond, loop, or directional)
Diamond ramps normally have a high-speed condition at one end and an at-grade intersection with either a stop or a slow turn condition at the other. Upper – to middle – range design speeds in Table 2.28 are normal near the high-speed facility. Middle – to lower-range design speeds are usually used closer to the at-grade intersection. Loop ramps may have a high-speed condition at one end and either a slow – or a high-speed condition at the other. Loop ramps, because of their relatively short radius, usually have lower-range design speeds in the middle – and slow-speed end of the ramp, and upper – to middle-range design speeds nearer the high-speed terminal(s). Directional ramps generally have high-speed conditions at both ends. They are normally designed using an upper – range design speed, and the absolute minimum design speed should be from the middle range.
Posted by admin on 13/ 11/ 15
If you take a lot of pride in your work or are working to detailed piping diagrams, you may find that the spacing of your offsets must be equal. Equally – spaced offsets are not only more attractive and more professional looking, they might required. You can guess and eyeball measurements to get them close, but you will need a formula to work with if you want the offsets to be accurate. Fortunately, I can provide you with such a formula, and I will.
Again, we will concentrate on 45°, 60°, and 22V2° bends, since these are the three most often used in plumbing and pipefitting. We will start with the 45° turns. In our example, you should envision two pipes rising vertically. Each pipe will be offset to the left and then the pipes will continue to rise vertically. For a visual example, refer to Fig. 2.6. It is necessary for us to determine uniform symbols for what we are doing, so let’s get that out of the way right now.
In our measurement examples, we will refer to Spread, the distance between the two offsetting pipes from center to center, as A. Set will remain with the symbol of S. Travel will be T and it will be the same as Distance of D. Run will be noted by the letter R. The letter F will be the length of pipe threads.
Now for the deal. Travel is determined in an equally-offset pipe run at a 45° angle by multiplying the Set by 1.414. Run is found by multiplying Set by
|
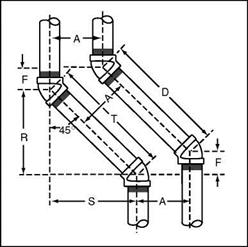
FIGURE 2.6 ■ Two-pipe 45° equal-spread offset.
|
1.000. The F measurement is found by multiplying the spread (A) by.4142. Remember that T and D are the same. Want to do the same exercise with a 60° setup? Why not?
To run a similar deal on 60° angles of equally – spaced offset pipes, you follow the same basic principles used in the previous example. Multiply the Set by 1.155 to find the Travel. Run is found by multiplying Set by.5773. The F measurement is found by multiplying the spread (A) by.5773. Remember that T and D are the same.
Need to find numbers for 22V2° bends? Well, it’s not difficult. To find figures for equally-spaced pipes with 22V2° bends, multiply the Set by 2.613 to find the Travel. Run is found by multiplying Set by 2.414. The F measurement is found by multiplying the spread (A) by.1989. Remember that T and D are the same.
| |


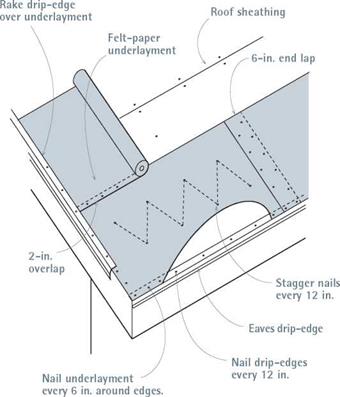 Run plywood lengths perpendicular to rafters, centering plywood edges over rafter centers. Nail every 6 in. with 8d galvanized nails. Elsewhere, use H-clips to support panel joints and create Иб-in. expansion gaps. Sweep the roof well and hammer down nail pop-ups.
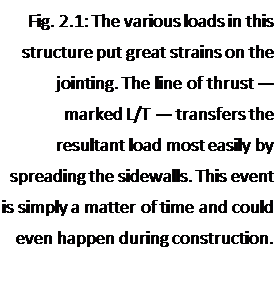 To withstand the loads on it, a house structure must meet three criteria. One, the individual members of the structure, such as beams, joists, and studs, must be strong enough. Two, the members must be attached to one another properly. The joints must be strong. Three, the lumber must be assembled so that the structure as a whole is rigid. (Clark, 1996.)
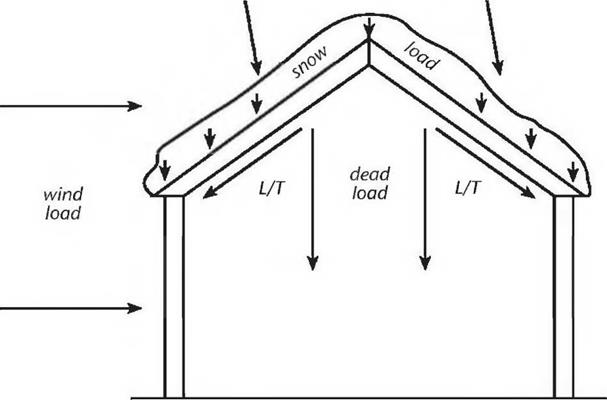 roof is downward, following gravity. But the weakness of such a building is in its joints: the connection between rafters or roof surfaces at the ridge, and the connection of the rafters or roof surface with the posts or sidewalls.

