Category HIGHWAY ENGINEERING HANDBOOK

Composite Pavement Distress—Visual Rating

Composite pavement deterioration is exhibited in a combination of some flexible pave­ment distresses and some rigid pavement distresses. The most prominent composite pavement distresses, which were defined under flexible or rigid pavement, are raveling, bleeding, rutting, corrugations, pumping, and various slab distresses.

3.8.2 Investigative Methods

If a pavement exhibits structural distresses, such as cracking, patching, potholes, faulting, etc., further evaluation may be necessary to identify the cause of the distress, the extent,

and the strength of the existing pavement system and subgrade. Roadways with high traffic volumes, especially those with high truck volumes, should also be evaluated prior to rehabilitation.

Pavement Coring. Without question, the simplest and most reliable method of identifying pavement deterioration is pavement coring. Pavement coring can be used to investigate many different pavement distress factors, from rigid joint deterioration to stripping in asphalt concrete pavement layers. The following are examples of pavement cores taken in various investigations.

Figure 3.41 shows a core of a composite pavement taken at a transverse joint. The core reveals a tight joint with aggregate interlock and little or no deterioration. The asphalt overlay is left intact. However, during the coring operation, the asphalt portion of the core should be inspected for delaminations between paving layers, rutting of any layers, or stripping of the asphalt from the aggregate.

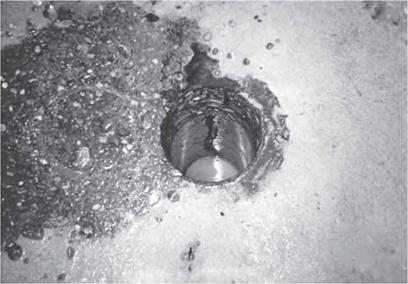
Figure 3.42 shows a core hole in the pavement taken at a midpanel transverse crack. A wealth of information can be obtained by inspection of the core hole. The core hole reveals aggregate interlock to be questionable. A close inspection revealed the reinforcing mesh to be rusted and broken, not cut by the coring operation. Because the core hole indi­cates most of the aggregate interlock is lost, this crack can be considered a working crack and should be repaired.

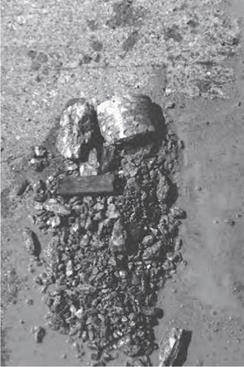
Figures 3.43 and 3.44 show the remains of cores taken at transverse joints. It is obvious that these joints need a full-depth repair. Cores should also be taken away from the joint to determine required width of repair.

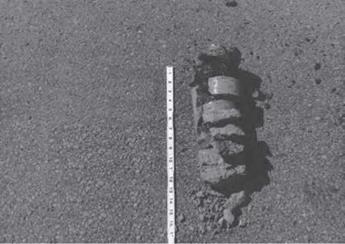
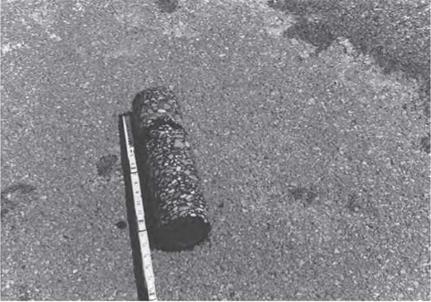
Figure 3.45 shows a core of an asphalt pavement that indicates a delamination approximately 3 in (75 mm) from the surface. Several cores should be taken to verify the extent of the flaw. A delamination found in an asphalt pavement such as this could result in debonding of the surface layer. If warranted, asphalt milling may be required to a depth sufficient to remove the delamination.

Composite Pavement Distress—Visual Rating

Composite Pavement Distress—Visual Rating

FIGURE 3.42 Hole in pavement after core was drilled at transverse crack in composite pavement.

Composite Pavement Distress—Visual Rating

FIGURE 3.43 Crumbled core taken from transverse joint in rigid pavement.

Composite Pavement Distress—Visual Rating

FIGURE 3.44 Crumbled core taken from transverse joint in composite pavement.

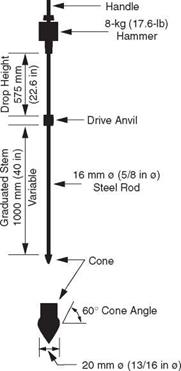
Dynamic Cone Penetrometer. The dynamic cone penetrometer (DCP) is commonly used to determine the stiffness of the base and/or subgrade. As shown in Fig. 3.46, the DCP consists of a 13/16-in (21-mm) diameter, 60° cone mounted on a 5/8-in (16-mm) rod. A 17.6-lb (8-kg) weight is attached to the top of the DCP in such a manner that it can be raised 22.6 in (574 mm) and released while the cone is resting on the base or subgrade.

Composite Pavement Distress—Visual Rating

FIGURE 3.45 Core from flexible pavement indicating delamination about 3 in (75 mm) from surface.

Composite Pavement Distress—Visual Rating

FIGURE 3.46 Schematic of dynamic cone penetrometer. (From Pavement Technology Advisory 97-7, Dynamic Cone Penetrometer, Illinois Department of Transportation, Bureau of Materials and Physical Research, 1997, with permission)

The penetration per drop of the weight is correlated to the CBR or modulus of the base or subgrade. Figure 3.47 shows one such correlation used by the Illinois Department of Transportation. The DCP is popular because it is a relatively inexpensive device that can rapidly determine the stiffness of a base or subgrade in the field.

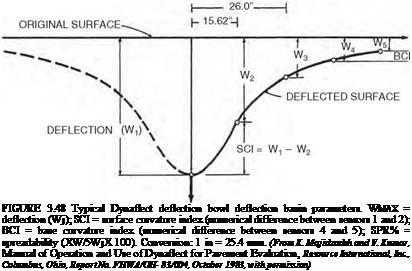
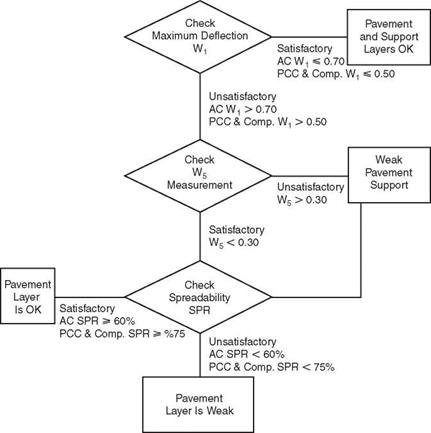
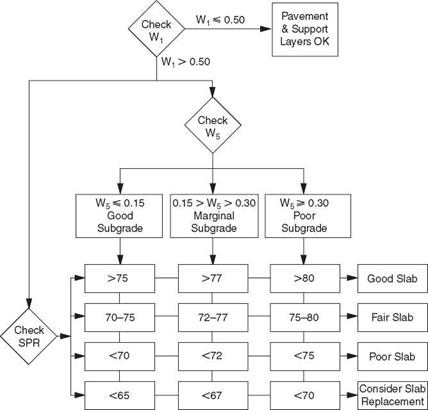
Nondestructive Testing. The most common of the nondestructive testing (NDT) methods is a deflection measuring device such as the falling weight deflectometer (FWD), road rater, and Dynaflect. These devices place a load, either impulse or cyclic, on the pavement and measure the deflection of the pavement using three or more geophones placed at various dis­tances from the load. The measured deflection at each sensor can be described as a “deflection bowl” (see Fig. 3.48). The deflection bowl can be used to evaluate the pavement and to determine the stiffness of the pavement system and individual pavement layers. Stiffness of the layers can be determined using any one of numerous backcalculation programs such as Modulus, Modcomp, Evercalc, etc.; many of which are available in the public domain. The calculated stiffness can then be used to design a rehabilitation treatment. The various deflec­tion parameters shown in Fig. 3.48 can also be used to evaluate the pavement. Table 3.27

0.1 1 10 Penetration Rate, in/blow

Подпись: FIGURE 3.47 Correlation of California Bearing Ratio (CBR) and penetration rate. Conversion: 1 in = 25.4 mm. (From Pavement Technology Advisory 97-7, Dynamic Cone Penetrometer, Illinois Department of Transportation, Bureau of Materials and Physical Research, 1997, with permission)

— . 49.03” 37.36”

Подпись: FIGURE 3.48 Typical Dynaflect deflection bowl deflection basin parameters. WMAX = deflection (Wj); SCI = surface curvature index (numerical difference between sensors 1 and 2); BCI = base curvature index (numerical difference between sensors 4 and 5); SPR% = spreadability (XW/5WjX 100). Conversion: 1 in = 25.4 mm. (From K. Majidzadeh and V. Kumar, Manual of Operation and Use of Dynaflect for Pavement Evaluation, Resource International, Inc., Columbus, Ohio, Report No. FHWA/OH- 83/004, October 1983, with permission)
P

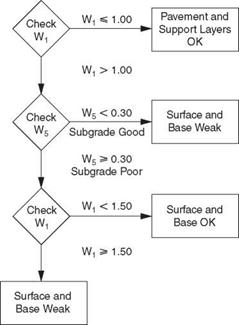
and Figs. 3.49 through 3.52 show an example of how the Dynaflect deflections can be used to determine subgrade and pavement conditions.

Ground Penetrating Radar. Improved analysis software has moved the ground pene­trating radar (GPR) from research to common usage. This GPR consists of a transmitter

TABLE 3.27 Joint Evaluation of Rigid and Composite Pavements

Dynaflect SCI (W1 – W2)

Joint condition

< 0.05

Probably frozen

0.05-0.11

Good load transfer

0.11-0.23

Fair load transfer

> 0.23

Poor load transfer

Source: K. Majidzadeh and V. Kumar, Manual of

Operation and Use of Dynaflect for Pavement Evaluation, Resource International, Inc., Columbus, Ohio, Report No. FHWA/OH-83/004, October 1983, with permission.


Composite Pavement Distress—Visual Rating

FIGURE 3.49 Rigid and flexible (thickness >6 in or 150 mm) pavement evaluation from Dynaflect measurements. (From K. Majidzadeh and V. Kumar, Manual of Operation and Use of Dynaflect for Pavement Evaluation, Resource International, Inc., Columbus, Ohio, Report No. FHWA/OH-83/004, October 1983, with permission)


Composite Pavement Distress—Visual Rating

FIGURE 3.50 Evaluation of rigid and composite pavements from Dynaflect measurements. (From K. Majidzadeh and V. Kumar, Manual of Operation and Use of Dynaflect for Pavement Evaluation, Resource International, Inc., Columbus, Ohio, Report No. FHWA/OH-83/004, October 1983, with permission)

and receiver. The GPR transmits pulses of electromagnetic energy at various frequencies into the pavement system. The pulses are reflected back to the receiver by the interface of the various pavement layers. The dielectric constant of the various pavement layers is determined by coring the pavement and calibrating the GPR. The GPR can be used to determine pavement layer thicknesses, locate voids, and locate areas with high moisture. Use of the GPR has been standardized in ASTM D-4748.

Spectral Analysis of Surface Waves. Spectral analysis of surface waves (SASW) is cur­rently a research tool but may find use as an evaluation tool in the near future. As shown in Fig. 3.53, two or more accelerometers are attached to the pavement in line with the test point. An instrumented hammer is used to generate surface waves. The accelerometers measure the travel time of the surface waves. By varying the distance between two accelerometers or by using multiple accelerometers, data can be gathered for the deeper pavement layers. Analysis of the surface waves can be used to determine the modulus and thickness of each layer in the pavement surface.

Composite Pavement Distress—Visual Rating

FIGURE 3.51 Evaluation of thin (thickness 4 to 6 in) asphalt pavements from Dynaflect measurements. (From K. Majidzadeh and V. Kumar, Manual of Operation and Use of Dynaflect for Pavement Evaluation, Resource International, Inc., Columbus, Ohio, Report No. FHWA/OH-83/004, October 1983, with permission)

Flexible Pavement Distress—Visual Rating

Flexible pavement deterioration is exhibited in any combination of the following distresses.

Raveling. Raveling, as shown in Fig. 3.31, is the result of loss of small aggregates from the pavement surface. Raveling can be caused by oxidation of the mix, improper mix design, segregation, or lack of compaction.

Bleeding. Bleeding is the flushing of excess asphalt cement to the surface of the pavement, as evident in Fig. 3.32. Asphalt cement concrete mixtures are more prone to

Flexible Pavement Distress—Visual Rating

Flexible Pavement Distress—Visual Rating

FIGURE 3.33 Example of small pothole in flexible pavement.

bleed with hotter pavement surface temperatures. Bleeding is a result of excess asphalt cement in the mix and/or low air voids in the mix.

Potholes. One of the most common problems is the development of a pothole (Fig. 3.33). Potholes are small, localized, but deep pavement failures characterized by a round shape. Potholes are caused by weak and wet subbase and/or subgrade. In freeze-thaw environments, potholes are generally formed during the thaw.

Rutting. Rutting (Fig. 3.34) is the longitudinal deformation of the pavement structure within the wheel tracks. Where found only in the uppermost portions of the pavement, it is caused by poor mixture design and lack of stability. Where rutting is deep-seated and found throughout the depth of the pavement structure, it is caused by inadequate pavement structure above the founding layers or by a weak, wet subgrade.

Corrugation. Corrugations (Fig. 3.35) are transverse waves in the pavement profile, which are found most generally at stop lights, at stop signs, or on hills. Corrugations are found in the wheel track and are the result of acceleration and deceleration of heavy trucks in a regular pattern on the roadway surface. The stability of the asphalt mix can also be a contributing factor.

Longitudinal Cracking. Longitudinal cracking, such as shown in Fig. 3.36, is most often found at paving joints established during construction. The construction joint is most gen­erally specified at lane lines. As weathering of the pavement takes place, the longitudinal joint ravels and eventually spalls. Longitudinal cracks found at locations other than paving joints are due to thermal shrinkage from seasonal temperature changes.

Transverse Cracking. As illustrated by Fig. 3.37, transverse cracking is best described by cracks that form across the pavement perpendicular to the centerline.

Flexible Pavement Distress—Visual Rating

FIGURE 3.34 Example of rutting in flexible pavement.

Transverse cracking is caused by thermal shrinkage from seasonal temperature changes and age hardening of the binder.

Block Cracking. Block cracking is the combination of longitudinal and transverse cracking, as shown in Fig. 3.38. As the cracks worsen with time as a result of weathering, they join each other and form block cracking.

Flexible Pavement Distress—Visual Rating

Flexible Pavement Distress—Visual Rating

FIGURE 3.36 Example of longitudinal cracking in flexible pavement.

Wheel Track Cracking. Wheel track cracking is shown in Fig. 3.39. It can be described as mostly longitudinal cracks found at the surface of the pavement within a 3-ft-wide (0.9-m) strip considered to be the wheel track. Wheel track cracking ranges from a single longitudinal crack to a series of interconnected longitudinal cracks, also referred to as alligator cracking. Wheel track cracking is commonly considered to be the most alarming distress found in a flexible pavement. This type of cracking starts at the bottom of the pavement structure and is transmitted to the surface. By the time alligator cracking can be detected by visual inspection, the pavement is generally considered to be failed.

Flexible Pavement Distress—Visual Rating

Flexible Pavement Distress—Visual Rating

FIGURE 3.38 Example of block cracking in flexible pavement.

Flexible Pavement Distress—Visual Rating

Flexible Pavement Distress—Visual Rating

FIGURE 3.40 Example of edge cracking in flexible pavement.

Edge Cracking. Edge cracking, as shown in Fig. 3.40, is a series of short longitudinal or irregular-shaped cracks at the outer 15 in (380 mm) of the pavement. Edge cracking is a result of lack of support outside the pavement edge.

Continuously Reinforced Rigid Pavement Distress—Visual Rating

Continuously reinforced concrete pavement deterioration is exhibited by the same dis­tresses discussed for jointed concrete pavement along with the following additional considerations.

Settlement. As previously stated, settlement as displayed by a depression in the pro­file of the pavement affects the smoothness of a pavement. It may be the result of poor construction practice such as poor compaction over a utility, poor grade control during final grading of the subgrade, or localized soil conditions that cannot resist additional overburden or increased loading. Repair methods consist of replacement to the cor­rected profile or an overlay. However, settlements are more predominant in CRC pavement, because transverse cracks are inherently more numerous. With the trans­verse cracking at a spacing of 5 to 8 ft (1.5 to 2.4 m), the pavement is able to bend more freely and does not bridge weak foundations as effectively.

Continuously Reinforced Rigid Pavement Distress—Visual Rating

FIGURE 3.28 Example of corner break in jointed rigid pavement.

Trans-verse Cracking. Although CRC pavement is designed to have transverse

cracks, the cracks should be spaced properly. Transverse cracks spaced too closely (less than 3 ft (0.9 m), as illustrated in Fig. 3.29) have a good chance of interconnect­ing, because they do not form uniformly straight and perpendicular to the centerline. Thus, as they interconnect, spalling will occur and pavement failures will result. On the other hand, transverse cracks spaced too far apart create higher stresses than the reinforcement can tolerate, and this can also result in pavement failures. Although

Continuously Reinforced Rigid Pavement Distress—Visual Rating

Continuously Reinforced Rigid Pavement Distress—Visual Rating

FIGURE 3.30 Example of punchout in continuously reinforced rigid pavement.

Continuously Reinforced Rigid Pavement Distress—Visual Rating

incorrect transverse crack spacing is not a distress by itself, it must be monitored to help pavement engineers predict failures. Once failures are evident, they must be repaired by full-depth pavement removal and replacement. It is important to reestablish conti­nuity of the reinforcement within the repair.

Punchouts. Figure 3.30 shows a punchout in a CRC pavement. A punchout is formed by the combination of intersecting transverse and longitudinal cracks over an area of weak foundation.

Jointed Rigid Pavement Distress—Visual Rating

Jointed rigid pavement deterioration is exhibited in any combination of the following distresses:

Surface Deterioration. Surface deterioration (Fig. 3.22) is the result of loss of cement at the surface of the slab (scaling). It is generally caused by excessive surface water and finishing practice, or the loss of both small aggregates and cement caused by abrasion from tires. Surface deterioration affects the noise level of a pavement and cannot be repaired. Surface deterioration by itself is generally of little concern.

TABLE 3.26 Pavement Coefficients for Flexible Section Design, Louisiana

Strength*

Coefficient

I. Surface course*

Asphaltic concrete

Types 1, 2, and 4 BC and WC

1000+

0.40

Types 3 WC

1800+

0.44

BC

1500+

0.43

II. Base course

Untreated*

Sand clay gravel—grade A

3.3—

0.08

Sand clay gravel—grade B

3.5 —

0.07

Shell and sand-shell

2.2—

0.10

Cement-treated§

Soil-cement

300+

0.15

Sand clay gravel—grade B

500+

0.18

Shell and sand-shell

500+

0.18

Shell and sand-shell

650+

0.23

Lime-treated*

Sand-shell

2.0—

0.12

Sand clay gravel—grade B

2.0—

0.12

Asphalt treated*

Hot-mix base course (type 5A)

1200+

0.34

Hot-mix base course (type 5B)

800+

0.30

III. Subbase course*

Lime-treated sand clay gravel—grade B

2.0—

0.14

Shell and sand-shell

2.0—

0.14

Sand clay gravel—grade B

3.5 —

0.11

Lime-treated soil

3.5 —

0.11

Old gravel or shell roadbed (8-in thickness) (200 mm)

0.11

Sand (R-value)

55+

0.11

Suitable material—A—6 (PI = 15—)

0.04

IV. Coefficients for bituminous concrete overlay

Base course

Bituminous concrete pavement

New

0.40

Old

0.24

Portland cement concrete pavement

New

0.50

Old, fair condition

0.40

Old, failed

0.20

Old, pumping

0.10

Old, pumping (to be undersealed)

0.35

*Refer to the following footnotes for strength designations. See the AASHTO guide referenced below for further details.

^Marshall stability number.

*Texas triaxial values.

§Compressive strength, lb/in2 (1 lb/in2 = 6.895 X 10—3 MPa)

Source: Interim Guide for Design of Pavement Structures, American Association of State

Highway and Transportation Officials, Washington, D. C., 1972 (rev. 1981), with permission.

Jointed Rigid Pavement Distress—Visual Rating

FIGURE 3.21 Procedure for determining thicknesses of layers using a layered analysis approach. a, D, m, and SN are defined in the text and are minimum required values. An asterisk indicates that the value actually used is represented; this value must be equal to or greater than the required value. (From Guide for Design of Pavement Structures,

American Association of State Highway and Transportation Officials, Washington, D. C., 1993, with permission)

Popouts. Figure 3.23 shows a typical popout. Popouts are generally due to high steel placement, but also may be the result of poor-quality aggregate, which disintegrates, causing cavities at the surface of the slab. Popouts affect the noise level of a pavement and cannot be repaired. Popouts by themselves are generally of little concern.

Pumping. Pumping is defined as the ejection of subbase or subgrade materials from under a pavement through a joint or crack and out onto the pavement and shoulder. The loss of subbase or subgrade material causes loss of support and leads to corner breaks and faulting. The existence of pumping can be determined visually by the pres­ence of soil stains at the joints or cracks on the adjacent shoulder.

Faulting. Faulting is a result of the loss of load transfer across a joint or crack, which causes the slab on one side of the joint or crack to be at a lower elevation than the slab on the other side. Faulting (Fig. 3.24) is generally a result of pumping. Faulting affects the noise level and the smoothness of a pavement. It is generally con­sidered excessive when faulting exceeds 1/4 in (6 mm). Faulting can be corrected by pavement grinding, joint or crack repair, or slab jacking. However, unless load transfer

Jointed Rigid Pavement Distress—Visual Rating

FIGURE 3.22 Example of surface deterioration in jointed rigid pavement.

Jointed Rigid Pavement Distress—Visual Rating

Jointed Rigid Pavement Distress—Visual Rating

FIGURE 3.24 Example of faulting at joint in rigid pavement; pavement on right is about 1/2 in (13 mm) lower than that on left.

is established across the joint or crack and any existing voids under the joint or crack are filled, faulting can be expected to return.

Settlement. Settlement is the result of poor construction practice. It may be due to either poor compaction over a utility, poor grade control during the final grading of the subgrade, or possible localized soil conditions that cannot resist additional over­burden or increased loading. Settlement, which is displayed by a depression in the profile of the pavement, affects smoothness. Repair methods consist of replacement to the corrected profile, or an overlay of some type. Settlements are generally of little concern unless they are numerous and severely affect the ride of the pavement.

Joint Spalling. Figure 3.25 shows typical joint spalling, defined as deterioration of the concrete slab around transverse or longitudinal joints. The deterioration is generally only to partial depth and is visible from the surface of the slab. Joint spalling may result from poor-quality aggregates (D cracking); improperly placed dowels, tie-bars, or dowel baskets; or excessive expansion of the concrete (pressure). Repair of spalled joints can be accomplished by either partial-depth joint repairs or full-depth joint repairs.

Jointed Rigid Pavement Distress—Visual Rating

FIGURE 3.25 Example of joint spalling in rigid pavement.

Trans-verse Cracking. A significant transverse crack is depicted in Fig. 3.26.

Transverse cracking severity varies from hairline cracks to cracks sufficiently wide to completely separate the slab into two distinct pieces. Hairline cracks are expected in reinforced concrete and pose no expected problems. In plain concrete pavement, a hairline crack can be a sign of future problems. Without reinforcing mesh to hold the crack together, the long-term performance of the slab is questionable; however, as long as the crack is tightly closed (hairline), it poses no problem. Regardless of

Jointed Rigid Pavement Distress—Visual Rating

Jointed Rigid Pavement Distress—Visual Rating

FIGURE 3.27 Example of longitudinal crack in jointed rigid pavement.

whether the pavement contains mesh, cracks that have separated by a distance greater than one-half of the largest aggregate diameter are generally considered to be failed.

Longitudinal Cracking. Longitudinal cracking, such as shown in Fig. 3.27, may be caused by excessive lane widths, longitudinal joints that were not sawed properly, or local conditions that increase the stress level along the pavement. Longitudinal cracking is pri­marily a concern when it occurs within the wheel track. Where a longitudinal crack is faulted, spalled, pumping, or working and is in the wheel path, it can become a safety hazard.

Corner Breaks. As illustrated in Fig. 3.28, corner breaks are cracks found at the cor­ner of the slab. They usually propagate from the transverse joint to the longitudinal joint. Corner breaks are full-depth cracks and are generally the result of loss of sup­port under the corner of the slab.

Pavement Deterioration

Pavement deterioration or distress can be classified into two basic categories for all pave­ment types—structural and functional. The most serious category is structural. Structural deterioration results in reduced ability to carry load and a decreased pavement life. Functional deterioration can lead to and accelerate structural deterioration, but it is only related to ride quality and frictional characteristics. A third type is environmental deterioration, which is a form of material-related distress. Environmental deterioration affects pavement materials and will generally exhibit itself as either functional or structural deterioration.

Pavement Deterioration

log10 MR – 8.07


+ 2.32


Подпись: Reliability, R (%)

Pavement Deterioration

S0 = 0.35 MR = 5000 lb/in2 Д (lb/in2) 1.9 Solution: SN = 5.0

FIGURE 3.17 Design chart for flexible pavements based on using mean values for each variable. Conversions: 1 kip = 4448 N, 1 lb/in2 = 6.895 X 10⁻³ MPa, 1 kip/in2 = 6.895 MPa. {From Guide for Design of Pavement Structures, American Association of State Highway and Transportation Officials, Washington, D. C., 1993, with permission)

TABLE 3.25 Recommended m Values for Modifying Structural Layer Coefficients of Untreated Base and Subbase Materials in Flexible Pavements

Quality of drainage

Percent of time pavement structure is exposed to moisture levels approaching saturation

Less than 1%

1-5%

5-25%

Greater than 25%

Excellent

1.40-1.35

1.35-1.30

1.30-1.20

1.20

Good

1.35-1.25

1.25-1.15

1.15-1.00

1.00

Fair

1.25-1.15

1.15-1.05

1.00-0.80

0.80

Poor

1.15-1.05

1.05-0.80

0.80-0.60

0.60

Very poor

1.05-0.95

0.95-0.75

0.75-0.40

0.40

Source: Guide for Design of Pavement Structures, American Association

of State Highway and Transportation Officials, Washington, D. C., 1993, with permission.


Pavement Deterioration

FIGURE 3.18 Chart for estimating structural layer coefficient (a^ of dense-graded asphalt concrete based on the resilient modulus. Conversion: 1 lb/in2 = 6.895 X 10_3 MPa. (From Guide for Design of Pavement Structures, American Association of State Highway and Transportation Officials, Washington, D. C., 1993, with permission)


0.20

0.18

0.16

0.14

0.12

0.10

0.08

0.06

0.04


40 –


Pavement DeteriorationPavement DeteriorationPavement DeteriorationPavement Deterioration

Pavement Deterioration

(1) Scale derived by averaging correlations obtained from Illinois.

(2) Scale derived by averaging correlations obtained from California, New Mexico, and Wyoming.

(31 Scale derived by averaging correlations obtained from Texas

(4) Scale derived on NCHRP project.

FIGURE 3.19 Variation in granular base layer coefficient (a2) with various base strength parameters. Conversion: 1 lb/in2 = 6.895 X 10~3 MPa. (From Guide for Design of Pavement Structures, American Association of State Highway and Transportation Officials, Washington, D. C., 1993, with permission)

Pavement deterioration is an important measurement for a pavement engineer. To determine the remaining life of a pavement, or the amount of pavement repair required to extend a pavement life for a given time period, or the most appropriate time for pavement repair, the amount and type of deterioration in a pavement must be measured. Methods of measurement of pavement deterioration vary, but most are similar in that they all require a visual inspection of the pavement and a somewhat subjective distress rating.

Pavement Deterioration

FIGURE 3.20 Variation in granular base layer coefficient (a3) with various subbase strength parameters. Conversion: 1 lb/in2 = 6.895 X 10_3 MPa. (From Guide for Design of Pavement Structures, American Association of State Highway and Transportation Officials, Washington, D. C., 1993, with permission)

PAVEMENT MANAGEMENT

Project-level pavement management is responsible for continuous evaluation of pave­ment’s present serviceability, monitoring of the pavement loading rate, determination of the cause and rate of pavement deterioration, prediction of optimal time for inter­vention, and evaluation of the most economical rehabilitation strategy.

Pavement management can be applied at the project level or at the network level. Although both levels are very dependent upon one another, they are seldom applied for the same purpose. The network level applies to the whole system in a global sense. Network refers to systemwide averages and is used for system budgeting and performance modeling. This chapter addresses only the project-level aspects. Project-level pavement management is considered to be more complicated and more important than pavement design. Pavement management is applied throughout the life of a pavement, whereas pavement design is com­pleted and forgotten once the pavement is initially in service.

FLEXIBLE PAVEMENT DESIGN PROCEDURE

Д (Ib/in2) 4.5- 1.5

1.624* 107

18.42

(Ec/k)02

s’c* cd (d0-75- і. ізг|


FLEXIBLE PAVEMENT DESIGN PROCEDURE

+ (4.22- O.32pt)*log10


215.63 *J P0J5-


Подпись: 267
Подпись: (D+ 1)8 S'c = 650 Ib/in2 J =3.2 Cd= 1.0 Д (Ib/in2) = 4.2-2.5= 1.7 W18 = 5.1 x 10⁶ (18-kip ESAL) Solution: D = 10.0 in.

(nearest half-inch, from part b )

FIGURE 3.15 Design chart for rigid pavements based on using mean values for each input variable. Conversions: 1 lb/in2 = 6.895 X 10⁻³ MPa, 1 lb/in3 = 271.4 X 10⁻⁴ N/mm2, 1 in = 25.4 mm. (From Guide for Design of Pavement Structures, American Association of State Highway and Transportation Officials, Washington, D. C., 1993, with permission)

Подпись: LПодпись: FIGURE 3.15Подпись: (Continued)FLEXIBLE PAVEMENT DESIGN PROCEDURE

10­

Note:

FLEXIBLE PAVEMENT DESIGN PROCEDURE

005


Relative

Damage


Month


Jan.


Feb


Mar.


May


June


July


Sept


Oct.


Nov.


Dec


10.0


Summation: Eu


13.0


Average: u


FLEXIBLE PAVEMENT DESIGN PROCEDURE

FLEXIBLE PAVEMENT DESIGN PROCEDURE

Подпись: (corresponds to ujEffective Roadbed Soil Resilient Modulus, M„ (Ib/in >

FIGURE 3.16 Chart for estimating effective roadbed soil resilient modulus for flexible pavements designed using the serviceability criteria. Conversion: 1 lb/in2 = 6.895 X 10_3 MPa. (From Guide for Design of Pavement Structures, American Association of State Highway and Transportation Officials, Washington, D. C., 1993, with permission)

Determine Pavement Structural Number. The flexible pavement process involves the calculation of a pavement structural number. This is an abstract number reflecting the relative strength contribution of all layers in the pavement buildup. The structural number SN is calculated using the design values determined as outlined above in the nomograph shown in Fig. 3.17. The design thickness for each layer is determined to satisfy the following equation:

SN = a1D1 + a2D2m2 + a3D3m3

where a1, a2, a3 = structural coefficients of surface, base, and subbase, respectively

D1, D2, D3 = thickness of surface, base, and subbase, respectively, in m2, m3 = drainage coefficients for base and subbase (see Table 3.25)

The structural coefficients of the asphalt layer, granular base, and subbase can be esti­mated using Figs. 3.18, 3.19, and 3.20, respectively, or can be estimated from Table 3.26.

Select Layer Material and Thickness. Once the structural coefficients are known, the thickness of the individual layers is determined by varying D1, D2, and D3 until the calcu­lated SN is equal to or greater than the required SN. Unbound bases are commonly speci­fied to the nearest 1 in (25 mm), and asphalt concrete is normally specified to the nearest 1/4 in (6 mm). The procedure shown in Fig. 3.21 illustrates one method recommended for determining layer thickness. This procedure designs the upper layers to protect the lower layers.

RIGID PAVEMENT DESIGN PROCEDURE

3.

Подпись: FIGURE 3.10 Load-response curve used to determine resilient modulus. (From M. Thompson, “Factors Affecting the Resilient Modulus of Soils and Granular Materials," Proceedings of Workshop on Resilient Modulus Testing, Oregon State University, Corvallis, 1989, with permission)

Determine the drainage coefficient for the pavement.

4. Select the design serviceability loss.

5. Estimate the total number of 18-kip (80-kN) equivalent single-axle loads for the design period.

6. Select a level of reliability and the overall standard deviation.

7. Determine slab thickness and steel reinforcement.

Подпись: k Подпись: 19.4 Подпись: (3.7)

Determine Effective Subgrade Modulus. The first step in designing the thickness of a rigid pavement is the determination of the effective modulus of subgrade reaction. The effective modulus (or composite modulus) is the modulus of subgrade reaction after cor­rection for use of subbase, seasonal variation in subgrade and subbase strength, rigid foundation within 10 ft (3 m) of the surface, and loss of support. Figure 3.11 is used to determine the composite modulus of subgrade reaction when a subbase will be used under the concrete pavement. If the pavement will be placed directly on the subgrade, the AASHTO Pavement Design Guide recommends a composite modulus of subgrade reaction of:

where k is in lb/in3 and MR is in lb/in2.

When a stiff layer (bedrock, etc.) is located within 10 ft (3 m) of the surface, the stiff layer will provide additional support for the pavement. Figure 3.12 is used to correct the composite modulus of subgrade reaction for this additional support.

Example:

DSB = 6 in (150 mm)

ESB = 20,000 lb/in2 (138 MPa)

MR = 7,000 lb/in2 (48 MPa)

RIGID PAVEMENT DESIGN PROCEDURE RIGID PAVEMENT DESIGN PROCEDURE RIGID PAVEMENT DESIGN PROCEDURE

Solution: k* = 400 lb/in3 (0.109 N/mm3)

2000 3000 5000

7000

10,000

12,000

16,000

Подпись: Roadbed Soil Resilient Modulus, MR (lb/in2)

20,000

FIGURE 3.11 Chart for estimating composite modulus of subgrade reaction kra, assuming a semi­infinite subgrade depth; defined as over 10 ft (3 m) below subgrade surface. (From Guide for Design of Pavement Structures, American Association of State Highway and Transportation Officials, Washington, D. C., 1993, with permission)

RIGID PAVEMENT DESIGN PROCEDUREIn regions where large moisture variations, freeze and thaw, etc., will affect the strength of the subgrade soils and subgrade, AASHTO provides a procedure to modify the composite modulus of subgrade reaction. Table 3.22 provides a worksheet, and Table 3.23 shows an example. The seasonal variation in strength is determined using laboratory procedures or nondestructive testing (NDT). The seasonal strength of the subbase and subgrade is entered in columns 2 and 3 of Table 3.22. The composite modulus of subgrade reaction is determined using Fig. 3.11 and entered in column 4. If a rigid foundation is present within 10 ft (3 m) of the surface, the k value is corrected

Example:

MR = 4000 Ib/in2 (27.6 MPa)

□SG = 5 ft (1.5 m)

= 230 Ib/in3 (0.062 N/mm3)

Подпись: 260Подпись:Подпись:RIGID PAVEMENT DESIGN PROCEDURESolution: к = 300 Ib/in3 (0.081 N/mm3)

Подпись: Roadbed Soil Resilient Modulus, MR (Ib/in2)Modulus of Subgrade Reaction, к (ib/in3)

(modified lo account for presence of rigid foundation near surface)

FIGURE 3.12 Chart for modifying modulus of subgrade reaction to consider effect of rigid foundation near the surface. Conversions: 1 lb/in2 = 6.895 X 10⁻³ MPa, 1 lb/in3 = 271.4 X 10⁻⁴ N/mm2, 1 ft = 0.305 m. (From Guide for Design of Pavement Structures, American Association of State Highway and Transportation Officials, Washington, D. C., 1993, with permission)

Trial subbase: Type _________________ Depth to rigid foundation, ft

Thickness, in___________ Projected slab thickness, in

Loss of support, LS______

Month

(1)

Roadbed modulus Mr, lb/in2 (2)

Subbase modulus, ESb, lb/in2

(3)

Composite k value, lb/in3 (Fig. 3.11) (4)

k value, lb/in3 on rigid foundation

(Fig. 3.12) (5)

Relative damage u (Fig. 3.13) (6)

January

February

March

April

May

June

July

August

September

October

November

December

Average: ur = ____

n

Summation: =

Effective modulus of subgrade reaction k (lb/in3) =_________

Corrected for loss of support (Fig. 3.14): k (lb/in3) =________

Conversions: 1 lb/in2 = 6.895 X 10_3 MPa, 1 lb/in3 = 271.4 X 10_4N/mm2, 1 in = 25.4 mm, 1 ft = 0.305 m. Source: Guide for Design of Pavement Structures, American Association of State Highway and

Transportation Officials, Washington, D. C., 1993, with permission.

TABLE 3.23 Example Application of Method for Estimating Effective Modulus of Subgrade Reaction

Trial subbase: Type ____ Grammar_____ Depth to rigid foundations, ft__________ 5

Thickness, in ___________ Projected slab thickness, in ___________ 99

Loss of support, LS І-0

Month

(1)

Roadbed modulus Mr, lb/in2 (2)

Subbase modulus, ESB, lb/in2

(3)

Composite k value, lb/in3 (Fig – 3-11) (4)

k value, lb/in3 on rigid foundation

(Fig – 3,12) (5)

Relative damage ur (Fig – 3-13) (6)

January

20,000

50,000

1,100

1,350

0-35

February

20,000

50,000

1,100

1,350

0-35

March

2,500

15,000

160

230

0-86

April

4,000

15,000

230

300

0-78

May

4,000

15,000

230

300

0-78

June

7,000

20,000

410

540

0-60

July

7,000

20,000

410

540

0-60

August

7,000

20,000

410

540

0-60

September

7,000

20,000

410

540

0-60

October

7,000

20,000

410

540

0-60

November

4,000

15,000

230

300

0-78

December

20,000

50,000

1,100

1,350

0-35

Summation: Xu = 7-25

Average: йг = X r =____ °-60________

r n

Effective modulus of subgrade reaction k (lb/in3) = 540 Corrected for loss of support (Fig – 3-14): k (lb/in3) = 170

Conversions: See Table 3-22-

Source: Guide for Design of Pavement Structures, American Association of State Highway and

Transportation Officials, Washington, D-C-, 1993, with permission-

RIGID PAVEMENT DESIGN PROCEDURE

FIGURE 3.13 Chart for estimating relative damage to rigid pavements based on slab thickness and underlying support. Conversions: 1 lb/in3 = 271.4 X 10_4 N/mm2, 1 in = 25.4 m. (From Guide for Design of Pavement Structures, American Association of State Highway and Transportation Officials, Washington, D. C., 1993, with permission)

using Fig. 3.12 and entered in column 5. The corrected k value is then used in Fig. 3.13 to determine the seasonal or relative damage factor, which is entered in column 6. The sum of relative damage is divided by the total number of periods to determine the average rel­ative damage factor. This value is entered in Fig. 3.13 to determine the average composite modulus of subgrade reaction for the year. Many concrete pavements fail as a result of pumping or loss of support under the slab. Figure 3.14 is provided to correct the effective modulus of subgrade reaction for loss of support. This figure lowers the k so that the

RIGID PAVEMENT DESIGN PROCEDURE

FIGURE 3.14 Chart for correction of effective modulus of subgrade reaction for potential loss of subbase support. Conversion: 1 lb/in3 = 271.4 X 10~4 N/mm2. (From Guide for Design of Pavement Structures, American Association of State Highway and Transportation Officials, Washington, D. C., 1993, with permission)

stress in the slab will be the same as for a slab with a void. Although the AASHTO procedure includes design for loss of support, it is recommended that a pavement base be designed to prevent or reduce loss of support, especially under pavements supporting a large number of heavy loads in wet areas. The cost of providing a base to resist loss of support may be less than the cost of restoring support in the future.

Select Pavement Material Properties. The next step in the design of a rigid pavement is to select material properties. The reliability level and overall standard deviation consider the variation in material properties. Therefore, average material property values must be used in design. The concrete material values needed for design are the average concrete modulus of elasticity and the average concrete modulus of rupture. These values are not known until after construction of the pavement unless the plans for the pavement contain a performance specification. Material properties from past pave­ment construction may be used for design purposes provided a similar mix will be used. American Society for Testing and Materials’ “Test Method for Static Modulus of Elasticity and Poisson’s Ratio of Concrete in Compression,” ASTM C469, details the laboratory test method for determining the concrete modulus of elasticity. ASTM C78,

TABLE 3.24 Recommended Values of Drainage Coefficient Cd for Rigid Pavement Design

Quality of

drainage

Percent of time pavement structure is exposed to moisture levels approaching saturation

Less than 1%

1-5%

5-25%

Greater than 25%

Excellent

1.25-1.20

1.20-1.15

1.15-1.10

1.10

Good

1.20-1.15

1.15-1.10

1.10-1.00

1.00

Fair

1.15-1.10

1.10-1.00

1.00-0.90

0.90

Poor

1.10-1.00

1.00-0.90

0.90-0.80

0.80

Very poor

1.00-0.90

0.90-0.80

0.80-0.70

0.70

Source: Guide for Design of Pavement Structures, American Association

of State Highway and Transportation Officials, Washington, D. C., 1993, with permission.

“Test Method for Flexural Strength of Concrete (Using Simple Beam with Third-Point Loading),” details the laboratory test method for determining the concrete flexural strength (modulus of rupture).

Determine Drainage Coefficient. The drainage coefficient is used to modify the design thickness for drainage conditions. Moisture affects the pavement performance by decreasing the strength of the subgrade and subbase material and affects the warping and curling behavior of the concrete slabs. The intent of the drainage coefficient is to allow performance prediction for pavements without a proper drainage system. Increasing the pavement thickness should not be used in lieu of a properly designed drainage system. Recommended values for the drainage coefficient are given in Table 3.24. The Federal Highway Administration’s “Highway Subdrainage Design Manual,” Report No. FHWA-TS-80-224, provides a procedure that may be used to determine drainage times for base material. (See Arts. 5.4.5 and 5.4.6.)

Select Design Serviceability Loss. The design serviceability loss is the amount of serviceability loss the agency will tolerate before rehabilitation. To select a design ser­viceability loss, the designer needs to know the initial serviceability and the terminal serviceability of the pavement. The initial serviceability is the serviceability immedi­ately after construction. Since this value is unknown at the time of construction, the designer will usually use the average initial serviceability of previously constructed pavements. The terminal serviceability is the serviceability of a pavement immediately before rehabilitation. The terminal serviceability is a function of traffic volume and speed. A low-volume road with low speeds may be allowed to deteriorate to a lower serviceability than a high-volume freeway, since the associated user costs will be lower. The terminal serviceability used by an agency is a policy decision. Common terminal serviceabilities are 2.5 for high-volume roads and 2.0 for low-volume roads.

Estimate ESALs. The daily ESAL loadings are determined as outlined in Art. 3.5.2. The total number of ESAL loadings for design is the cumulative number of ESAL loadings expected over the design life of the pavement. This value can be determined by assuming a growth rate or, if the pavement is being built on an existing alignment, by extrapolating past traffic patterns.

Determine Slab Thickness and Reinforcement. The design slab thickness is deter­mined by using the design values as outlined above in the nomograph shown in Fig. 3.15. The design thickness is usually rounded up to the nearest 1/2 or 1 in (13 or 25 mm) depending on the local practice for specifying slab thickness. As mentioned in Art. 3.5.2, if the design thickness varies significantly from the thickness used to determine the equivalency factors, the equivalency factors should be recalculated and the thickness design checked. Determination of steel reinforcement content, if used, is detailed in Art. 3.1.1.

Roadbed Soil Resilient Modulus

The resilient modulus is a measure of the ability of a soil or granular base to resist permanent deformation under repeated loading. Many soils are stress-dependent. As the stress level increases, these soils will behave in a nonlinear fashion. Fine-grain soils tend to be stress-softening, whereas granular soils tend to be stress-hardening. Laboratory procedures for determining resilient modulus have been published by AASHTO as test method T307, or NCHRP as test method 1-38A. A typical setup for the laboratory test is shown in Fig. 3.9. The stress due to the repeated load applied through the load actuator is the deviator stress and is intended to duplicate the effect of loads passing over a section of pavement. The confining stress within the chamber is intended to duplicate the confinement of the soil within the subgrade. A typical load-response curve is shown in Fig. 3.10. As shown, the resilient modulus (MR) is the ratio of deviator stress to strain in the elastic range.

The laboratory procedures for determining resilient modulus are complex and time­consuming. Many equations have been developed relating the resilient modulus to soil properties that are more easily determined. One such property is the California

TABLE 3.11 Axle Load Equivalency Factors for Rigid Pavements, Tandem Axles, and pt of 2.0

Axle load

Slab thickness D, in

kips

kN

6

7

8

9

10

11

12

13

14

2

9

0.0001

0.0001

0.0001

0.0001

0.0001

0.0001

0.0001

0.0001

0.0001

4

18

0.0006

0.0005

0.0005

0.0005

0.0005

0.0005

0.0005

0.0005

0.0005

6

27

0.002

0.002

0.002

0.002

0.002

0.002

0.002

0.002

0.002

8

36

0.006

0.006

0.005

0.005

0.005

0.005

0.005

0.005

0.005

10

44

0.014

0.013

0.013

0.012

0.012

0.012

0.012

0.012

0.012

12

53

0.028

0.026

0.026

0.025

0.025

0.025

0.025

0.025

0.025

14

62

0.051

0.049

0.048

0.047

0.047

0.047

0.047

0.047

0.047

16

71

0.087

0.084

0.082

0.081

0.081

0.080

0.080

0.080

0.080

18

80

0.141

0.136

0.133

0.132

0.131

0.131

0.131

0.131

0.131

20

89

0.216

0.210

0.206

0.204

0.203

0.203

0.203

0.203

0.203

22

98

0.319

0.313

0.307

0.305

0.304

0.303

0.303

0.303

0.303

24

107

0.454

0.449

0.444

0.441

0.440

0.439

0.439

0.439

0.439

26

116

0.629

0.626

0.622

0.620

0.618

0.618

0.618

0.618

0.618

28

125

0.852

0.851

0.850

0.850

0.850

0.849

0.849

0.849

0.849

30

133

1.13

1.13

1.14

1.14

1.14

1.14

1.14

1.14

1.14

32

142

1.48

1.48

1.49

1.50

1.51

1.51

1.51

1.51

1.51

34

151

1.90

1.90

1.93

1.95

1.96

1.97

1.97

1.97

1.97

36

160

2.42

2.41

2.45

2.49

2.51

2.52

2.53

2.53

2.53

38

169

3.04

3.02

3.07

3.13

3.17

3.19

3.20

3.20

3.21

40

178

3.79

3.74

3.80

3.89

3.95

3.98

4.00

4.01

4.01

42

187

4.67

4.59

4.66

4.78

4.87

4.93

4.95

4.97

4.97

44

196

5.72

5.59

5.67

5.82

5.95

6.03

6.07

6.09

6.10

46

205

6.94

6.76

6.83

7.02

7.20

7.31

7.37

7.41

7.43

48

214

8.36

8.12

8.17

8.40

8.63

8.79

8.88

8.93

8.96

50

222

10.00

9.69

9.72

9.98

10.27

10.49

10.62

10.69

10.73

52

231

11.9

11.5

11.5

11.8

12.1

12.4

12.6

12.7

12.8

54

240

14.0

13.5

13.5

13.8

14.2

14.6

14.9

15.0

15.1

56

249

16.5

15.9

15.8

16.1

16.6

17.1

17.4

17.6

17.7

58

258

19.3

18.5

18.4

18.7

19.3

19.8

20.3

20.5

20.7

60

267

22.4

21.5

21.3

21.6

22.3

22.9

23.5

23.8

24.0

62

276

25.9

24.9

24.6

24.9

25.6

26.4

27.0

27.5

27.7

64

285

29.9

28.6

28.2

28.5

29.3

30.2

31.0

31.6

31.9

66

294

34.3

32.8

32.3

32.6

33.4

34.4

35.4

36.1

36.5

68

302

39.2

37.5

36.8

37.1

37.9

39.1

40.2

41.1

41.6

70

311

44.6

42.7

41.9

42.1

42.9

44.2

45.5

46.6

47.3

72

320

50.6

48.4

47.5

47.6

48.5

49.9

51.4

52.6

53.5

74

329

57.3

54.7

53.6

53.6

54.6

56.1

57.7

59.2

60.3

76

338

64.6

61.7

60.4

60.3

61.2

62.8

64.7

66.4

67.7

78

347

72.5

69.3

67.8

67.7

68.6

70.2

72.3

74.3

75.8

80

356

81.3

77.6

75.9

75.7

76.6

78.3

80.6

82.8

84.7

82

365

90.9

86.7

84.7

84.4

85.3

87.1

89.6

92.1

94.2

84

374

101.

97.

94.

94.

95.

97.

99.

102.

105.

86

383

113.

107.

105.

104.

105.

107.

110.

113.

116.

88

391

125.

119.

116.

116.

116.

118.

121.

125.

128.

90

400

138.

132.

129.

128.

129.

131.

134.

137.

141.

Conversion: 1 in = 25.4 mm.

Axle load

Slab thickness D, in

kips

kN

6

7

8

9

10

11

12

13

14

2

9

0.0001

0.0001

0.0001

0.0001

0.0001

0.0001

0.0001

0.0001

0.0001

4

18

0.0003

0.0003

0.0003

0.0003

0.0003

0.0003

0.0003

0.0003

0.0003

6

27

0.0010

0.0009

0.0009

0.0009

0.0009

0.0009

0.0009

0.0009

0.0009

8

36

0.002

0.002

0.002

0.002

0.002

0.002

0.002

0.002

0.002

10

44

0.005

0.005

0.005

0.005

0.005

0.005

0.005

0.005

0.005

12

53

0.010

0.010

0.009

0.009

0.009

0.009

0.009

0.009

0.009

14

62

0.018

0.017

0.017

0.016

0.016

0.016

0.016

0.016

0.016

16

71

0.030

0.029

0.028

0.027

0.027

0.027

0.027

0.027

0.027

18

80

0.047

0.045

0.044

0.044

0.043

0.043

0.043

0.043

0.043

20

89

0.072

0.069

0.067

0.066

0.066

0.066

0.066

0.066

0.066

22

98

0.105

0.101

0.099

0.098

0.097

0.097

0.097

0.097

0.097

24

107

0.149

0.144

0.141

0.139

0.139

0.138

0.138

0.138

0.138

26

116

0.205

0.199

0.195

0.194

0.193

0.192

0.192

0.192

0.192

28

125

0.276

0.270

0.265

0.263

0.262

0.262

0.262

0.262

0.261

30

133

0.364

0.359

0.354

0.351

0.350

0.349

0.349

0.349

0.349

32

142

0.472

0.468

0.463

0.460

0.459

0.458

0.458

0.458

0.458

34

151

0.603

0.600

0.596

0.594

0.593

0.592

0.592

0.592

0.592

36

160

0.759

0.758

0.757

0.756

0.755

0.755

0.755

0.755

0.755

38

169

0.946

0.947

0.949

0.950

0.951

0.951

0.951

0.951

0.951

40

178

1.17

1.17

1.18

1.18

1.18

1.18

1.18

1.18

1.19

42

187

1.42

1.43

1.44

1.45

1.46

1.46

1.46

1.46

1.46

44

196

1.73

1.73

1.75

1.77

1.78

1.78

1.79

1.79

1.79

46

205

2.08

2.07

2.10

2.13

2.15

2.16

2.16

2.16

2.17

48

214

2.48

2.47

2.51

2.55

2.58

2.59

2.60

2.60

2.61

50

222

2.95

2.92

2.97

3.03

3.07

3.09

3.10

3.11

3.11

52

231

3.48

3.44

3.50

3.58

3.63

3.66

3.68

3.69

3.69

54

240

4.09

4.03

4.09

4.20

4.27

4.31

4.33

4.35

4.35

56

249

4.78

4.69

4.76

4.89

4.99

5.05

5.08

5.09

5.10

58

258

5.57

5.44

5.51

5.66

5.79

5.87

5.91

5.94

5.95

60

267

6.45

6.29

6.35

6.53

6.69

6.79

6.85

6.88

6.90

62

276

7.43

7.23

7.28

7.49

7.69

7.82

7.90

7.94

7.97

64

285

8.54

8.28

8.32

8.55

8.80

8.97

9.07

9.13

9.16

66

294

9.76

9.46

9.48

9.73

10.02

10.24

10.37

10.44

10.48

68

302

11.1

10.8

10.8

11.0

11.4

11.6

11.8

11.9

12.0

70

311

12.6

12.2

12.2

12.5

12.8

13.2

13.4

13.5

13.6

72

320

14.3

13.8

13.7

14.0

14.5

14.9

15.1

15.3

15.4

74

329

16.1

15.5

15.4

15.7

16.2

16.7

17.0

17.2

17.3

76

338

18.2

17.5

17.3

17.6

18.2

18.7

19.1

19.3

19.5

78

347

20.4

19.6

19.4

19.7

20.3

20.9

21.4

21.7

21.8

80

356

22.8

21.9

21.6

21.9

22.6

23.3

23.8

24.2

24.4

82

365

25.4

24.4

24.1

24.4

25.0

25.8

26.5

26.9

27.2

84

374

28.3

27.1

26.7

27.0

27.7

28.6

29.4

29.9

30.2

86

383

31.4

30.1

29.6

29.9

30.7

31.6

32.5

33.1

33.5

88

391

34.8

33.3

32.8

33.0

33.8

34.8

35.8

36.6

37.1

90

400

38.5

36.8

36.2

36.4

37.2

38.3

39.4

40.3

40.9

Conversion: 1 in = 25.4 mm.

TABLE 3.13 Axle Load Equivalency Factors for Rigid Pavements, Single Axles, and pt of 2.5

Axle load

Slab thickness D, in

kips

kN

6

7

8

9

10

11

12

13

14

2

9

0.0002

0.0002

0.0002

0.0002

0.0002

0.0002

0.0002

0.0002

0.0002

4

18

0.003

0.002

0.002

0.002

0.002

0.002

0.002

0.002

0.002

6

27

0.012

0.011

0.010

0.010

0.010

0.010

0.010

0.010

0.010

8

36

0.039

0.035

0.033

0.032

0.032

0.032

0.032

0.032

0.032

10

44

0.097

0.089

0.084

0.082

0.081

0.080

0.080

0.080

0.080

12

53

0.203

0.189

0.181

0.176

0.175

0.174

0.174

0.173

0.173

14

62

0.376

0.360

0.347

0.341

0.338

0.337

0.336

0.336

0.336

16

71

0.634

0.623

0.610

0.604

0.601

0.599

0.599

0.599

0.598

18

80

1.00

1.00

1.00

1.00

1.00

1.00

1.00

1.00

1.00

20

89

1.51

1.52

1.55

1.57

1.58

1.58

1.59

1.59

1.59

22

98

2.21

2.20

2.28

2.34

2.38

2.40

2.41

2.41

2.41

24

107

3.16

3.10

3.22

3.36

3.45

3.50

3.53

3.54

3.55

26

116

4.41

4.26

4.42

4.67

4.85

4.95

5.01

5.04

5.05

28

125

6.05

5.76

5.92

6.29

6.61

6.81

6.92

6.98

7.01

30

133

8.16

7.67

7.79

8.28

8.79

9.14

9.35

9.46

9.52

32

142

10.8

10.1

10.1

10.7

11.4

12.0

12.3

12.6

12.7

34

151

14.1

13.0

12.9

13.6

14.6

15.4

16.0

16.4

16.5

36

160

18.2

16.7

16.4

17.1

18.3

19.5

20.4

21.0

21.3

38

169

23.1

21.1

20.6

21.3

22.7

24.3

25.6

26.4

27.0

40

178

29.1

26.5

25.7

26.3

27.9

29.9

31.6

32.9

33.7

42

187

36.2

32.9

31.7

32.2

34.0

36.3

38.7

40.4

41.6

44

196

44.6

40.4

38.8

39.2

41.0

43.8

46.7

49.1

50.8

46

205

54.5

49.3

47.1

47.3

49.2

52.3

55.9

59.0

61.4

48

214

66.1

59.7

56.9

56.8

58.7

62.1

66.3

70.3

73.4

50

222

79.4

71.7

68.2

67.8

69.6

73.3

78.1

83.0

87.1

Conversion: 1 in = 25.4 mm.

Source: Guide for Design of Pavement Structures, American Association of State Highway and

Transportation Officials, Washington, D. C., 1993, with permission.

Bearing Ratio (CBR). Common equations using CBR to calculate resilient modulus values include the following:

E (lb/in2) = 1500 CBR (Shell Oil Co.)

E (lb/in2) = 5409 CBR0 711 (U. S. Army Waterway Experiment Station)

E (lb/in2) = 2550 CBR0 64 (Transport and Road Research Laboratory, England)

(See “Pavement Deflection Analysis,” FHWA Report HI-94-021, NHI, February 1994.) More detailed equations have been developed by correlating laboratory results with fundamental soil properties. R. F. Carmichael III and E. Stuart (“Predicting Resilient Modulus: A Study to Determine the Mechanical Properties of Subgrade Soils,” Transportation Research Record 1043, Transportation Research Board, National Research Council, Washington, D. C., 1985) developed the following models for the U. S. Forest Service:

Axle load

Slab thickness D, in

kips

kN

6

7

8

9

10

11

12

13

14

2

9

0.0001

0.0001

0.0001

0.0001

0.0001

0.0001

0.0001

0.0001

0.0001

4

18

0.0006

0.0006

0.0005

0.0005

0.0005

0.0005

0.0005

0.0005

0.0005

6

27

0.002

0.002

0.002

0.002

0.002

0.002

0.002

0.002

0.002

8

36

0.007

0.006

0.006

0.005

0.005

0.005

0.005

0.005

0.005

10

44

0.015

0.014

0.013

0.013

0.012

0.012

0.012

0.012

0.012

12

53

0.031

0.028

0.026

0.026

0.025

0.025

0.025

0.025

0.025

14

62

0.057

0.052

0.049

0.048

0.047

0.047

0.047

0.047

0.047

16

71

0.097

0.089

0.084

0.082

0.081

0.081

0.080

0.080

0.080

18

80

0.155

0.143

0.136

0.133

0.132

0.131

0.131

0.131

0.131

20

89

0.234

0.220

0.211

0.206

0.204

0.203

0.203

0.203

0.203

22

98

0.340

0.325

0.313

0.308

0.305

0.304

0.303

0.303

0.303

24

107

0.475

0.462

0.450

0.444

0.441

0.440

0.439

0.439

0.439

26

116

0.644

0.637

0.627

0.622

0.620

0.619

0.618

0.618

0.618

28

125

0.855

0.854

0.852

0.850

0.850

0.850

0.849

0.849

0.849

30

133

1.11

1.12

1.13

1.14

1.14

1.14

1.14

1.14

1.14

32

142

1.43

1.44

1.47

1.49

1.50

1.51

1.51

1.51

1.51

34

151

1.82

1.82

1.87

1.92

1.95

1.96

1.97

1.97

1.97

36

160

2.29

2.27

2.35

2.43

2.48

2.51

2.52

2.52

2.53

38

169

2.85

2.80

2.91

3.03

3.12

3.16

3.18

3.20

3.20

40

178

3.52

3.42

3.55

3.74

3.87

3.94

3.98

4.00

4.01

42

187

4.32

4.16

4.30

4.55

4.74

4.86

4.91

4.95

4.96

44

196

5.26

5.01

5.16

5.48

5.75

5.92

6.01

6.06

6.09

46

205

6.36

6.01

6.14

6.53

6.90

7.14

7.28

7.36

7.40

48

214

7.64

7.16

7.27

7.73

8.21

8.55

8.75

8.86

8.92

50

222

9.11

8.50

8.55

9.07

9.68

10.14

10.42

10.58

10.66

52

231

10.8

10.0

10.0

10.6

11.3

11.9

12.3

12.5

12.7

54

240

12.8

11.8

11.7

12.3

13.2

13.9

14.5

14.8

14.9

56

249

15.0

13.8

13.6

14.2

15.2

16.2

16.8

17.3

17.5

58

258

17.5

16.0

15.7

16.3

17.5

18.6

19.5

20.1

20.4

60

267

20.3

18.5

18.1

18.7

20.0

21.4

22.5

23.2

23.6

62

276

23.5

21.4

20.8

21.4

22.8

24.4

25.7

26.7

27.3

64

285

27.0

24.6

23.8

24.4

25.8

27.7

29.3

30.5

31.3

66

294

31.0

28.1

27.1

27.6

29.2

31.3

33.2

34.7

35.7

68

302

35.4

32.1

30.9

31.3

32.9

35.2

37.5

39.3

40.5

70

311

40.3

36.5

35.0

35.3

37.0

39.5

42.1

44.3

45.9

72

320

45.7

41.4

39.6

39.8

41.5

44.2

47.2

49.8

51.7

74

329

51.7

46.7

44.6

44.7

46.4

49.3

52.7

55.7

58.0

76

338

58.3

52.6

50.2

50.1

51.8

54.9

58.6

62.1

64.8

78

347

65.5

59.1

56.3

56.1

57.7

60.9

65.0

69.0

72.3

80

356

73.4

66.2

62.9

62.5

64.2

67.5

71.9

76.4

80.2

82

365

82.0

73.9

70.2

69.6

71.2

74.7

79.4

84.4

88.8

84

374

91.4

82.4

78.1

77.3

78.9

82.4

87.4

93.0

98.1

86

383

102.

92.

87.

86.

87.

91.

96.

102.

108.

88

391

113.

102.

96.

95.

96.

100.

105.

112.

119.

90

400

125.

112.

106.

105.

106.

110.

115.

123.

130.

Conversion: 1 in = 25.4 mm.

TABLE 3.15 Axle Load Equivalency Factors for Rigid Pavements, Triple Axles, and pt of 2.5

Axle load

Slab thickness D, in

kips

kN

6

7

8

9

10

11

12

13

14

2

9

0.0001

0.0001

0.0001

0.0001

0.0001

0.0001

0.0001

0.0001

0.0001

4

18

0.0003

0.0003

0.0003

0.0003

0.0003

0.0003

0.0003

0.0003

0.0003

6

27

0.001

0.001

0.001

0.001

0.001

0.001

0.001

0.001

0.001

8

36

0.003

0.002

0.002

0.002

0.002

0.002

0.002

0.002

0.002

10

44

0.006

0.005

0.005

0.005

0.005

0.005

0.005

0.005

0.005

12

53

0.011

0.010

0.010

0.009

0.009

0.009

0.009

0.009

0.009

14

62

0.020

0.018

0.017

0.017

0.016

0.016

0.016

0.016

0.016

16

71

0.033

0.030

0.029

0.028

0.027

0.027

0.027

0.027

0.027

18

80

0.053

0.048

0.045

0.044

0.044

0.043

0.043

0.043

0.043

20

89

0.080

0.073

0.069

0.067

0.066

0.066

0.066

0.066

0.066

22

98

0.116

0.107

0.101

0.099

0.098

0.097

0.097

0.097

0.097

24

107

0.163

0.151

0.144

0.141

0.139

0.139

0.138

0.138

0.138

26

116

0.222

0.209

0.200

0.195

0.194

0.193

0.192

0.192

0.192

28

125

0.295

0.281

0.271

0.265

0.263

0.262

0.262

0.262

0.262

30

133

0.384

0.371

0.359

0.354

0.351

0.350

0.349

0.349

0.349

32

142

0.490

0.480

0.468

0.463

0.460

0.459

0.458

0.458

0.458

34

151

0.616

0.609

0.601

0.596

0.594

0.593

0.592

0.592

0.592

36

160

0.765

0.762

0.759

0.757

0.756

0.755

0.755

0.755

0.755

38

169

0.939

0.941

0.946

0.948

0.950

0.951

0.951

0.951

0.951

40

178

1.14

1.15

1.16

1.17

1.18

1.18

1.18

1.18

1.18

42

187

1.38

1.38

1.41

1.44

1.45

1.46

1.46

1.46

1.46

44

196

1.65

1.65

1.70

1.74

1.77

1.78

1.78

1.78

1.79

46

205

1.97

1.96

2.03

2.09

2.13

2.15

2.16

2.16

2.16

48

214

2.34

2.31

2.40

2.49

2.55

2.58

2.59

2.60

2.60

50

222

2.76

2.71

2.81

2.94

3.02

3.07

3.09

3.10

3.11

52

231

3.24

3.15

3.27

3.44

3.56

3.62

3.66

3.68

3.68

54

240

3.79

3.66

3.79

4.00

4.16

4.26

4.30

4.33

4.34

56

249

4.41

4.23

4.37

4.63

4.84

4.97

5.03

5.07

5.09

58

258

5.12

4.87

5.00

5.32

5.59

5.79

5.85

5.90

5.93

60

267

5.91

5.59

5.71

6.08

6.42

6.64

6.77

6.84

6.87

62

276

6.80

6.39

6.50

6.91

7.33

7.62

7.79

7.88

7.93

64

285

7.79

7.29

7.37

7.82

8.33

8.70

8.92

9.04

9.11

66

294

8.90

8.28

8.33

8.83

9.42

9.88

10.17

10.33

10.42

68

302

10.1

9.4

9.4

9.9

10.6

11.2

11.5

11.7

11.9

70

311

11.5

10.6

10.6

11.1

11.9

12.6

13.0

13.3

13.5

72

320

13.0

12.0

11.8

12.4

13.3

14.1

14.7

15.0

15.2

74

329

14.6

13.5

13.2

13.8

14.8

15.8

16.5

16.9

17.1

76

338

16.5

15.1

14.8

15.4

16.5

17.6

18.4

18.9

19.2

78

347

18.5

16.9

16.5

17.1

18.2

19.5

20.5

21.1

21.5

80

356

20.6

18.8

18.3

18.9

20.2

21.6

22.7

23.5

24.0

82

365

23.0

21.0

20.3

20.9

22.2

23.8

25.2

26.1

26.7

84

374

25.6

23.3

22.5

23.1

24.5

26.2

27.8

28.9

29.6

86

383

28.4

25.8

24.9

25.4

26.9

28.8

30.5

31.9

32.8

88

391

31.5

28.6

27.5

27.9

29.4

31.5

33.5

35.1

36.1

90

400

34.8

31.5

30.3

30.7

32.2

34.4

36.7

38.5

39.8

Conversion: 1 in = 25.4 mm.

Подпись:
Cohesive soils:

MR = 37.431 – 0.4566(PI) – 0.6179(%W) – 0.1424(S200) +

Подпись: (3.5)0.1791(CS) – 0.3248(DS) + 36.422(CH) + 17.097(MH)

Подпись: where MR PI %W S200 CS DS CH MH resilient modulus, kips/in2 plasticity index percentage water

percentage passing the no. 200 sieve confining stress, lb/in2 deviator stress, lb/in2

1 for CH soil (Unified Soil Classification, Art. 8.3.2)

0 otherwise

1 for MH soil (Unified Soil Classification)

0 otherwise

TABLE 3.17 Axle Load Equivalency Factors for Rigid Pavements, Tandem Axles, andpt of 3.0

Axle load

Slab thickness D, in

kips

kN

6

7

8

9

10

11

12

13

14

2

9

0.0001

0.0001

0.0001

0.0001

0.0001

0.0001

0.0001

0.0001

0.0001

4

18

0.0007

0.0006

0.0005

0.0005

0.0005

0.0005

0.0005

0.0005

0.0005

6

27

0.003

0.002

0.002

0.002

0.002

0.002

0.002

0.002

0.002

8

36

0.008

0.006

0.006

0.006

0.005

0.005

0.005

0.005

0.005

10

44

0.018

0.015

0.013

0.013

0.013

0.012

0.012

0.012

0.012

12

53

0.036

0.030

0.027

0.026

0.026

0.025

0.025

0.025

0.025

14

62

0.066

0.056

0.050

0.048

0.047

0.047

0.047

0.047

0.047

16

71

0.111

0.095

0.087

0.083

0.081

0.081

0.081

0.080

0.080

18

80

0.174

0.153

0.140

0.135

0.132

0.131

0.131

0.131

0.131

20

89

0.260

0.234

0.217

0.209

0.205

0.204

0.203

0.203

0.203

22

98

0.368

0.341

0.321

0.311

0.307

0.305

0.304

0.303

0.303

24

107

0.502

0.479

0.458

0.447

0.443

0.440

0.440

0.439

0.439

26

116

0.664

0.651

0.634

0.625

0.621

0.619

0.618

0.618

0.618

28

125

0.859

0.857

0.853

0.851

0.850

0.850

0.850

0.849

0.849

30

133

1.09

1.10

1.12

1.13

1.14

1.14

1.14

1.14

1.14

32

142

1.38

1.38

1.44

1.47

1.49

1.50

1.51

1.51

1.51

34

151

1.72

1.71

1.80

1.88

1.93

1.95

1.96

1.97

1.97

36

160

2.13

2.10

2.23

2.36

2.45

2.49

2.51

2.52

2.52

38

169

2.62

2.54

2.71

2.92

3.06

3.13

3.17

3.19

3.20

40

178

3.21

3.05

3.26

3.55

3.76

3.89

3.95

3.98

4.00

42

187

3.90

3.65

3.87

4.26

4.58

4.77

4.87

4.92

4.95

44

196

4.72

4.35

4.57

5.06

5.50

5.78

5.94

6.02

6.06

46

205

5.68

5.16

5.36

5.95

6.54

6.94

7.17

7.29

7.36

48

214

6.80

6.10

6.25

6.93

7.69

8.24

8.57

8.76

8.86

50

222

8.09

7.17

7.26

8.03

8.96

9.70

10.17

10.43

10.58

52

231

9.57

8.41

8.40

9.24

10.36

11.32

11.96

12.33

12.54

54

240

1.13

9.8

9.7

10.6

11.9

13.1

14.0

14.5

14.8

56

249

13.2

11.4

11.2

12.1

13.6

15.1

16.2

16.9

17.3

58

258

15.4

13.2

12.8

13.7

15.4

17.2

18.6

19.5

20.1

60

267

17.9

15.3

14.7

15.6

17.4

19.5

21.3

22.5

23.2

62

276

20.6

17.6

16.8

17.6

19.6

22.0

24.1

25.7

26.6

64

285

23.7

20.2

19.1

19.9

22.0

24.7

27.3

29.2

30.4

66

294

27.2

23.1

21.7

22.4

24.6

27.6

30.6

33.0

34.6

68

302

31.1

26.3

24.6

25.2

27.4

30.8

34.3

37.1

39.2

70

311

35.4

29.8

27.8

28.2

30.6

34.2

38.2

41.6

44.1

72

320

40.1

33.8

31.3

31.6

34.0

37.9

42.3

46.4

49.4

74

329

45.3

38.1

35.2

35.4

37.7

41.8

46.8

51.5

55.2

76

338

51.1

42.9

39.5

39.5

41.8

46.1

51.5

56.9

61.3

78

347

57.4

48.2

44.3

44.0

46.3

50.7

56.6

62.7

67.9

80

356

64.3

53.9

49.4

48.9

51.1

55.8

62.1

68.9

74.9

82

365

71.8

60.2

55.1

54.3

56.5

61.2

67.9

75.5

82.4

84

374

80.0

67.0

61.2

60.2

62.2

67.0

74.2

82.4

90.3

86

383

89.0

74.5

67.9

66.5

68.5

73.4

80.8

89.8

98.7

88

391

98.7

82.5

75.2

73.5

75.3

80.2

88.0

97.7

107.5

90

400

109.

91.

83.

81.

83.

88.

96.

106.

117

Conversion: 1 in = 25.4 mm.

Axle load

Slab thickness D, in

kips

kN

6

7

8

9

10

11

12

13

14

2

9

0.0001

0.0001

0.0001

0.0001

0.0001

0.0001

0.0001

0.0001

0.0001

4

18

0.0004

0.0003

0.0003

0.0003

0.0003

0.0003

0.0003

0.0003

0.0003

6

27

0.001

0.001

0.001

0.001

0.001

0.001

0.001

0.001

0.001

8

36

0.003

0.003

0.002

0.002

0.002

0.002

0.002

0.002

0.002

10

44

0.007

0.006

0.005

0.005

0.005

0.005

0.005

0.005

0.005

12

53

0.013

0.011

0.010

0.009

0.009

0.009

0.009

0.009

0.009

14

62

0.023

0.020

0.018

0.017

0.017

0.016

0.016

0.016

0.016

16

71

0.039

0.033

0.030

0.028

0.028

0.027

0.027

0.027

0.027

18

80

0.061

0.052

0.047

0.045

0.044

0.044

0.043

0.043

0.043

20

89

0.091

0.078

0.071

0.068

0.067

0.066

0.066

0.066

0.066

22

98

0.132

0.114

0.104

0.100

0.098

0.097

0.097

0.097

0.097

24

107

0.183

0.161

0.148

0.143

0.140

0.139

0.139

0.138

0.138

26

116

0.246

0.221

0.205

0.198

0.195

0.193

0.193

0.192

0.192

28

125

0.322

0.296

0.277

0.268

0.265

0.263

0.262

0.262

0.262

30

133

0.411

0.387

0.367

0.357

0.353

0.351

0.350

0.349

0.349

32

142

0.515

0.495

0.476

0.466

0.462

0.460

0.459

0.458

0.458

34

151

0.634

0.622

0.607

0.599

0.595

0.594

0.593

0.592

0.592

36

160

0.772

0.768

0.762

0.758

0.756

0.756

0.755

0.755

0.755

38

169

0.930

0.934

0.942

0.947

0.949

0.950

0.951

0.951

0.951

40

178

1.11

1.12

1.15

1.17

1.18

1.18

1.18

1.18

1.18

42

187

1.32

1.33

1.38

1.42

1.44

1.45

1.46

1.46

1.46

44

196

1.56

1.56

1.64

1.71

1.75

1.77

1.78

1.78

1.78

46

205

1.84

1.83

1.94

2.04

2.10

2.14

2.15

2.16

2.16

48

214

2.16

2.12

2.26

2.41

2.51

2.56

2.58

2.59

2.60

50

222

2.53

2.45

2.61

2.82

2.96

3.03

3.07

3.09

3.10

52

231

2.95

2.82

3.01

3.27

3.47

3.58

3.63

3.66

3.68

54

240

3.43

3.23

3.43

3.77

4.03

4.18

4.27

4.31

4.33

56

249

3.98

3.70

3.90

4.31

4.65

4.86

4.98

5.04

5.07

58

258

4.59

4.22

4.42

4.90

5.34

5.62

5.78

5.86

5.90

60

267

5.28

4.80

4.99

5.54

6.08

6.45

6.66

6.78

6.84

62

276

6.06

5.45

5.61

6.23

6.89

7.36

7.64

7.80

7.88

64

285

6.92

6.18

6.29

6.98

7.76

8.36

8.72

8.93

9.04

66

294

7.89

6.98

7.05

7.78

8.70

9.44

9.91

10.18

10.33

68

302

8.96

7.88

7.87

8.66

9.71

10.61

11.20

11.55

11.75

70

311

10.2

8.9

8.8

9.6

10.8

11.9

12.6

13.1

13.3

72

320

11.5

10.0

9.8

10.6

12.0

13.2

14.1

14.7

15.0

74

329

12.9

11.2

10.9

11.7

13.2

14.7

15.8

16.5

16.9

76

338

14.5

12.5

12.1

12.9

14.5

16.2

17.5

18.4

18.9

78

347

16.2

13.9

13.4

14.2

15.9

17.8

19.4

20.5

21.1

80

356

18.2

15.5

14.8

15.6

17.4

19.6

21.4

22.7

23.5

82

365

20.2

17.2

16.4

17.2

19.1

21.4

23.5

25.1

26.1

84

374

22.5

19.1

18.1

18.8

20.8

23.4

25.8

27.6

28.8

86

383

25.0

21.2

19.9

20.6

22.6

25.5

28.2

30.4

31.8

88

391

27.6

23.4

21.9

22.5

24.6

27.7

30.7

33.2

35.0

90

400

30.5

25.8

24.1

24.6

26.8

30.0

33.4

36.3

38.3

Conversion: 1 in = 25.4 mm.

Analysis period


years


Location


Assumed SN or D =____________ in


Roadbed Soil Resilient Modulus

Granular soils:


Roadbed Soil Resilient Modulus

(3.6)


Analysis period =_____ 20____ years

Assumed SN or D =_____ 9_____ in

Current

Growth

Design

ESAL

Design

Vehicle types

traffic (A)

factors (B)

traffic (C)

factor (D)

ESAL (E)

2%

Passenger cars

5,925

24.30

52,551,787

0.0008

42,041

Buses

35

24.30

310,433

0.6806

211,280

Panel and pickup trucks

1,135

24.30

10,066,882

0.0122

122,816

Other 2-axle/4-tire trucks

3

24.30

26,609

0.0052

138

2-axle/6-tire trucks

372

24.30

3,299,454

0.1890

623,597

3 or more axle trucks All single-unit trucks

34

24.30

301,563

0.1303

39,294

3-axle tractor semitrailers

19

24.30

168,521

0.8646

145,703

4-axle tractor semitrailers

49

24.30

434,606

0.6560

285,101

5+ axle tractor semitrailers All tractor semitrailers

1,880

24.30

16,674,660

2.3719

39,550,626

5-axle double trailers

103

24.30

913,559

2.3187

2,118,268

6+ axle double trailers All double trailer combos

0

24.30

3-axle truck-trailers

208

24.30

1,844,856

0.0152

28,042

4-axle truck-trailers

305

24.30

2,705,198

0.0152

41,119

5+ axle truck-trailers All truck-trailer combos

125

24.30

1,108,688

0.5317

589,489

All vehicles

10,193

90,406,816

Design

ESAL

43,772,314

Location

Example 1

Source: Guide for Design of Pavement Structures, American Association of State Highway and

Transportation Officials, Washington, D. C., 1993, with permission.

TABLE 3.21 Equivalency Factors for Determining ESAL

Rigid pavement

Flexible pavement

Function classification

B

C

B

C

Rural interstate

2.27

0.914

1.60

0.735

All other rural

2.16

1.02

1.44

0.777

Urban interstate, freeway, and expressway

2.50

1.48

1.74

1.13

All other urban

1.61

0.673

1.11

0.534

Notes: B = tractor-trucks with semitrailers and trucks with trailers. C = single-unit trucks (2 axles, 6 tires or more).

Source: Ohio Department of Transportation, Location and Design Manual, Vol. 1,

Roadway Design, December 1990, revised October 1992, with permission.

Подпись: LOAD CELL
Подпись: CHAMBER PISTON ROD
Подпись: BALL SEAT (DIVOT)
Roadbed Soil Resilient Modulus
Подпись: LVDT
Подпись: CELL PRESSURE INLET
Подпись: COVER PLATE
Подпись: CHAMBER (lexan or acrylic)
Roadbed Soil Resilient Modulus Подпись: SPECIMEN Roadbed Soil Resilient Modulus

Roadbed Soil Resilient ModulusREPEATED LOAD ACTUATOR

:SOLID BASES

SECTION VIEW

Подпись: NOT TO SCALENote: LVDT tips shall rest on the triaxial cell itself or on a

plate/bracket which is rigidly attached to the tnaxial cell

FIGURE 3.9 Triaxial test chamber for determining resilient modulus of soil specimen. (From NRC Operational Guide No. SHRP-LTPP-OG-004, “SHRP-LTPP Interim Guide for Laboratory Material Handling and Testing," with permission)

Reliability and Overall Standard Deviation

Rarely does the actual traffic loading to failure equal the predicted traffic loading; the difference is due to the deviations that exist. These deviations include (1) lack of fit of the AASHTO design equations, since these are empirical equations; (2) variations in construction, which cause variations in the equation input factors such as the strength and thickness of pavement layers; and (3) variations in the predicted traffic (see App. EE of Vol. 2 of the AASHTO Guide for Design of Pavement Structures, August 1986 edition). The AASHTO equations account for these variations by multiplying the predicted traffic by a safety factor. The safety factor is determined by the reliability desired and

TABLE 3.5 Axle Load Equivalency Factors for Flexible Pavements, Tandem Axles, and pt of 2.5

Axle load

Pavement structural number (SN)

kips

kN

1

2

3

4

5

6

2

9

0.0001

0.0001

0.0001

0.0000

0.0000

0.0000

4

18

0.0005

0.0005

0.0004

0.0003

0.0003

0.0002

6

27

0.002

0.002

0.002

0.001

0.001

0.001

8

36

0.004

0.006

0.005

0.004

0.003

0.003

10

44

0.008

0.013

0.011

0.009

0.007

0.006

12

53

0.015

0.024

0.023

0.018

0.014

0.013

14

62

0.026

0.041

0.042

0.033

0.027

0.024

16

71

0.044

0.065

0.070

0.057

0.047

0.043

18

80

0.070

0.097

0.109

0.092

0.077

0.070

20

89

0.107

0.141

0.162

0.141

0.121

0.110

22

98

0.160

0.198

0.229

0.207

0.180

0.166

24

107

0.231

0.273

0.315

0.292

0.260

0.242

26

116

0.327

0.370

0.420

0.401

0.364

0.342

28

125

0.451

0.493

0.548

0.534

0.495

0.470

30

133

0.611

0.648

0.703

0.695

0.658

0.633

32

142

0.813

0.843

0.889

0.887

0.857

0.834

34

151

1.06

1.08

1.11

1.11

1.09

1.08

36

160

1.38

1.38

1.38

1.38

1.38

1.38

38

169

1.75

1.73

1.69

1.68

1.70

1.73

40

178

2.21

2.16

2.06

2.03

2.08

2.14

42

187

2.76

2.67

2.49

2.43

2.51

2.61

44

196

3.41

3.27

2.99

2.88

3.00

3.16

46

205

4.18

3.98

3.58

3.40

3.55

3.79

48

214

5.08

4.80

4.25

3.98

4.17

4.49

50

222

6.12

5.76

5.03

4.64

4.86

5.28

52

231

7.33

6.87

5.93

5.38

5.63

6.17

54

240

8.72

8.14

6.95

6.22

6.47

7.15

56

249

10.3

9.6

8.1

7.2

7.4

8.2

58

258

12.1

11.3

9.4

8.2

8.4

9.4

60

267

14.2

13.1

10.9

9.4

9.6

10.7

62

276

16.5

15.3

12.6

10.7

10.8

12.1

64

285

19.1

17.6

14.5

12.2

12.2

13.7

66

294

22.1

20.3

16.6

13.8

13.7

15.4

68

302

25.3

23.3

18.9

15.6

15.4

17.2

70

311

29.0

26.6

21.5

17.6

17.2

19.2

72

320

33.0

30.3

24.4

19.8

19.2

21.3

74

329

37.5

34.4

27.6

22.2

21.3

23.6

76

338

42.5

38.9

31.1

24.8

23.7

26.1

78

347

48.0

43.9

35.0

27.8

26.2

28.8

80

356

54.0

49.4

39.2

30.9

29.0

31.7

82

365

60.6

55.4

43.9

34.4

32.0

34.8

84

374

67.8

61.9

49.0

38.2

35.3

38.1

86

383

75.7

69.1

54.5

42.3

38.8

41.7

88

391

84.3

76.9

60.6

46.8

42.6

45.6

90

400

93.7

85.4

67.1

51.7

46.8

49.7

Axle load

Pavement structural number (SN)

kips

kN

1

2

3

4

5

6

2

9

0.0000

0.0000

0.0000

0.0000

0.0000

0.0000

4

18

0.0002

0.0002

0.0002

0.0001

0.0001

0.0001

6

27

0.0006

0.0007

0.0005

0.0004

0.0003

0.0003

8

36

0.001

0.002

0.001

0.001

0.001

0.001

10

44

0.003

0.004

0.003

0.002

0.002

0.002

12

53

0.005

0.007

0.006

0.004

0.003

0.003

14

62

0.008

0.012

0.010

0.008

0.006

0.006

16

71

0.012

0.019

0.018

0.013

0.011

0.010

18

80

0.018

0.029

0.028

0.021

0.017

0.016

20

89

0.027

0.042

0.042

0.032

0.027

0.024

22

98

0.038

0.058

0.060

0.048

0.040

0.036

24

107

0.053

0.078

0.084

0.068

0.057

0.051

26

116

0.072

0.103

0.114

0.095

0.080

0.072

28

125

0.098

0.133

0.151

0.128

0.109

0.099

30

133

0.129

0.169

0.195

0.170

0.145

0.133

32

142

0.169

0.213

0.247

0.220

0.191

0.175

34

151

0.219

0.266

0.308

0.281

0.246

0.228

36

160

0.279

0.329

0.379

0.352

0.313

0.292

38

169

0.352

0.403

0.461

0.436

0.393

0.368

40

178

0.439

0.491

0.554

0.533

0.487

0.459

42

187

0.543

0.594

0.661

0.644

0.597

0.567

44

196

0.666

0.714

0.781

0.769

0.723

0.692

46

205

0.811

0.854

0.918

0.911

0.868

0.838

48

214

0.979

1.015

1.072

1.069

1.033

1.005

50

222

1.17

1.20

1.24

1.25

1.22

1.20

52

231

1.40

1.41

1.44

1.44

1.43

1.41

54

240

1.66

1.66

1.66

1.66

1.66

1.66

56

249

1.95

1.93

1.90

1.90

1.91

1.93

58

258

2.29

2.25

2.17

2.16

2.20

2.24

60

267

2.67

2.60

2.48

2.44

2.51

2.58

62

276

3.09

3.00

2.82

2.76

2.85

2.95

64

285

3.57

3.44

3.19

3.10

3.22

3.36

66

294

4.11

3.94

3.61

3.47

3.62

3.81

68

302

4.71

4.49

4.06

3.88

4.05

4.30

70

311

5.38

5.11

4.57

4.32

4.52

4.84

72

320

6.12

5.79

5.13

4.80

5.03

5.41

74

329

6.93

6.54

5.74

5.32

5.57

6.04

76

338

7.84

7.37

6.41

5.88

6.15

6.71

78

347

8.83

8.28

7.14

6.49

6.78

7.43

80

356

9.92

9.28

7.95

7.15

7.45

8.21

82

365

11.1

10.4

8.8

7.9

8.2

9.0

84

374

12.4

11.6

9.8

8.6

8.9

9.9

86

383

13.8

12.9

10.8

9.5

9.8

10.9

88

391

15.4

14.3

11.9

10.4

10.6

11.9

90

400

17.1

15.8

13.2

11.3

11.6

12.9

TABLE 3.7 Axle Load Equivalency Factors for Flexible Pavements, Single Axles, and pt of 3.0

Axle load

Pavement structural number (SN)

kips

kN

1

2

3

4

5

6

2

9

0.0008

0.0009

0.0006

0.0003

0.0002

0.0002

4

18

0.004

0.008

0.006

0.004

0.002

0.002

6

27

0.014

0.030

0.028

0.018

0.012

0.010

8

36

0.035

0.070

0.080

0.055

0.040

0.034

10

44

0.082

0.132

0.168

0.132

0.101

0.086

12

53

0.173

0.231

0.296

0.260

0.212

0.187

14

62

0.332

0.388

0.468

0.447

0.391

0.358

16

71

0.594

0.633

0.695

0.693

0.651

0.622

18

80

1.00

1.00

1.00

1.00

1.00

1.00

20

89

1.60

1.53

1.41

1.38

1.44

1.51

22

98

2.47

2.29

1.96

1.83

1.97

2.16

24

107

3.67

3.33

2.69

2.39

2.60

2.96

26

116

5.29

4.72

3.65

3.08

3.33

3.91

28

125

7.43

6.56

4.88

3.93

4.17

5.00

30

133

10.2

8.9

6.5

5.0

5.1

6.3

32

142

13.8

12.0

8.4

6.2

6.3

7.7

34

151

18.2

15.7

10.9

7.8

7.6

9.3

36

160

23.8

20.4

14.0

9.7

9.1

11.0

38

169

30.6

26.2

17.7

11.9

11.0

13.0

40

178

38.8

33.2

22.2

14.6

13.1

15.3

42

187

48.8

41.6

27.6

17.8

15.5

17.8

44

196

60.6

51.6

34.0

21.6

18.4

20.6

46

205

74.7

63.4

41.5

26.1

21.6

23.8

48

214

91.2

77.3

50.3

31.3

25.4

27.4

50

222

110.

94.

61.

37.

30.

32.

Source: Guide for Design of Pavement Structures, American Association of State Highway

and Transportation Officials, Washington, D. C., 1993, with permission.

the amount of total variation or the overall standard deviation. AASHTO recommends the following reliability based on the functional classification of the road:

Recommended

level of reliability

Functional classification

Urban

Rural

Interstate/freeway

85-99.9

80-99.9

Principal arterials

80-99

75-95

Collectors

80-95

75-95

Local

50-80

50-80

Overall standard deviation values recommended by AASHTO are 0.30 to 0.40 for rigid pavements and 0.40 to 0.50 for flexible pavements. The lower values are more appropriate when traffic predictions are more reliable. Values derived from the AASHTO Road Test are 0.39 for rigid pavements and 0.49 for flexible pavements.

Axle load

Pavement structural number (SN)

kips

kN

1

2

3

4

5

6

2

9

0.0002

0.0002

0.0001

0.0001

0.0000

0.0000

4

18

0.001

0.001

0.001

0.000

0.000

0.000

6

27

0.003

0.004

0.003

0.002

0.001

0.001

8

36

0.006

0.011

0.009

0.005

0.003

0.003

10

44

0.011

0.024

0.020

0.012

0.008

0.007

12

53

0.019

0.042

0.039

0.024

0.017

0.014

14

62

0.031

0.066

0.068

0.045

0.032

0.026

16

71

0.049

0.096

0.109

0.076

0.055

0.046

18

80

0.075

0.134

0.164

0.121

0.090

0.076

20

89

0.113

0.181

0.232

0.182

0.139

0.119

22

98

0.166

0.241

0.313

0.260

0.205

0.178

24

107

0.238

0.317

0.407

0.358

0.292

0.257

26

116

0.333

0.413

0.517

0.476

0.402

0.360

28

125

0.457

0.534

0.643

0.614

0.538

0.492

30

133

0.616

0.684

0.788

0.773

0.702

0.656

32

142

0.817

0.870

0.956

0.953

0.896

0.855

34

151

1.07

1.10

1.15

1.15

1.12

1.09

36

160

1.38

1.38

1.38

1.38

1.38

1.38

38

169

1.75

1.71

1.64

1.62

1.66

1.70

40

178

2.21

2.11

1.94

1.89

1.98

2.08

42

187

2.75

2.59

2.29

2.19

2.33

2.50

44

196

3.39

3.15

2.70

2.52

2.71

2.97

46

205

4.15

3.81

3.16

2.89

3.13

3.50

48

214

5.04

4.58

3.70

3.29

3.57

4.07

50

222

6.08

5.47

4.31

3.74

4.05

4.70

52

231

7.27

6.49

5.01

4.24

4.57

5.37

54

240

8.65

7.67

5.81

4.79

5.13

6.10

56

249

10.2

9.0

6.7

5.4

5.7

6.9

58

258

12.0

10.6

7.7

6.1

6.4

7.7

60

267

14.1

12.3

8.9

6.8

7.1

8.6

62

276

16.3

14.2

10.2

7.7

7.8

9.5

64

285

18.9

16.4

11.6

8.6

8.6

10.5

66

294

21.8

18.9

13.2

9.6

9.5

11.6

68

302

25.1

21.7

15.0

10.7

10.5

12.7

70

311

28.7

24.7

17.0

12.0

11.5

13.9

72

320

32.7

28.1

19.2

13.3

12.6

15.2

74

329

37.2

31.9

21.6

14.8

13.8

16.5

76

338

42.1

36.0

24.3

16.4

15.1

17.9

78

347

47.5

40.6

27.3

18.2

16.5

19.4

80

356

53.4

45.7

30.5

20.1

18.0

21.0

82

365

60.0

51.2

34.0

22.2

19.6

22.7

84

374

67.1

57.2

37.9

24.6

21.3

24.5

86

383

74.9

63.8

42.1

27.1

23.2

26.4

88

391

83.4

71.0

46.7

29.8

25.2

28.4

90

400

92.7

78.8

51.7

32.7

27.4

30.5

TABLE 3.9 Axle Load Equivalency Factors for Flexible Pavements, Triple Axles, and pt of 3.0

Axle load

Pavement structural number (SN)

kips

kN

1

2

3

4

5

6

2

9

0.0001

0.0001

0.0001

0.0000

0.0000

0.0000

4

18

0.0005

0.0004

0.0003

0.0002

0.0001

0.0001

6

27

0.001

0.001

0.001

0.001

0.000

0.000

8

36

0.003

0.004

0.002

0.001

0.001

0.001

10

44

0.005

0.008

0.005

0.003

0.002

0.002

12

53

0.007

0.014

0.010

0.006

0.004

0.003

14

62

0.011

0.023

0.018

0.011

0.007

0.006

16

71

0.016

0.035

0.030

0.018

0.013

0.010

18

80

0.022

0.050

0.047

0.029

0.020

0.017

20

89

0.031

0.069

0.069

0.044

0.031

0.026

22

98

0.043

0.090

0.097

0.065

0.046

0.039

24

107

0.059

0.116

0.132

0.092

0.066

0.056

26

116

0.079

0.145

0.174

0.126

0.092

0.078

28

125

0.104

0.179

0.223

0.168

0.126

0.107

30

133

0.136

0.218

0.279

0.219

0.167

0.143

32

142

0.176

0.265

0.342

0.279

0.218

0.188

34

151

0.226

0.319

0.413

0.350

0.279

0.243

36

160

0.286

0.382

0.491

0.432

0.352

0.310

38

169

0.359

0.456

0.577

0.524

0.437

0.389

40

178

0.447

0.543

0.671

0.626

0.536

0.483

42

187

0.550

0.643

0.775

0.740

0.649

0.593

44

196

0.673

0.760

0.889

0.865

0.777

0.720

46

205

0.817

0.894

1.014

1.001

.920

.865

48

214

0.984

1.048

1.152

1.148

1.080

1.030

50

222

1.18

1.23

1.30

1.31

1.26

1.11

52

231

1.40

1.43

1.47

1.48

1.45

1.43

54

240

1.66

1.66

1.66

1.66

1.66

1.66

56

249

1.95

1.92

1.86

1.85

1.88

1.91

58

258

2.28

2.21

2.09

2.06

2.13

2.20

60

267

2.66

2.54

2.34

2.28

2.39

2.50

62

276

3.08

2.92

2.61

2.52

2.66

2.84

64

285

3.56

3.33

2.92

2.77

2.96

3.19

66

294

4.09

3.79

3.25

3.04

3.27

3.58

68

302

4.68

4.31

3.62

3.33

3.60

4.00

70

311

5.34

4.88

4.02

3.64

3.94

4.44

72

320

6.08

5.51

4.46

3.97

4.31

4.91

74

329

6.89

6.21

4.94

4.32

4.69

5.40

76

338

7.78

6.98

5.47

4.70

5.09

5.93

78

347

8.76

7.83

6.04

5.11

5.51

6.48

80

356

9.84

8.75

6.67

5.54

5.96

7.06

82

365

11.0

9.8

7.4

6.0

6.4

7.7

84

374

12.3

10.9

8.1

6.5

6.9

8.3

86

383

13.7

12.1

8.9

7.0

7.4

9.0

88

391

15.3

13.4

9.8

7.6

8.0

9.6

90

400

16.9

14.8

10.7

8.2

8.5

10.4

Axle load

Slab thickness D, in

kips

kN

6

7

8

9

10

11

12

13

14

2

9

0.0002

0.0002

0.0002

0.0002

0.0002

0.0002

0.0002

0.0002

0.0002

4

18

0.002

0.002

0.002

0.002

0.002

0.002

0.002

0.002

0.002

6

27

0.011

0.010

0.010

0.010

0.010

0.010

0.010

0.010

0.010

8

36

0.035

0.033

0.032

0.032

0.032

0.032

0.032

0.032

0.032

10

44

0.087

0.084

0.082

0.081

0.080

0.080

0.080

0.080

0.080

12

53

0.186

0.180

0.176

0.175

0.174

0.174

0.173

0.173

0.173

14

62

0.353

0.346

0.341

0.338

0.337

0.336

0.336

0.336

0.336

16

71

0.614

0.609

0.604

0.601

0.599

0.599

0.598

0.598

0.598

18

80

1.00

1.00

1.00

1.00

1.00

1.00

1.00

1.00

1.00

20

89

1.55

1.56

1.57

1.58

1.58

1.59

1.59

1.59

1.59

22

98

2.32

2.32

2.35

2.38

2.40

2.41

2.41

2.41

2.42

24

107

3.37

3.34

3.40

3.47

3.51

3.53

3.54

3.55

3.55

26

116

4.76

4.69

4.77

4.88

4.97

5.02

5.04

5.06

5.06

28

125

6.58

6.44

6.52

6.70

6.85

6.94

7.00

7.02

7.04

30

133

8.92

8.68

8.74

8.98

9.23

9.39

9.48

9.54

9.56

32

142

11.9

11.5

11.5

11.8

12.2

12.4

12.6

12.7

12.7

34

151

15.5

15.0

14.9

15.3

15.8

16.2

16.4

16.6

16.7

36

160

20.1

19.3

19.2

19.5

20.1

20.7

21.1

21.4

21.5

38

169

25.6

24.5

24.3

24.6

25.4

26.1

26.7

27.1

27.4

40

178

32.2

30.8

30.4

30.7

31.6

32.6

33.4

34.0

34.4

42

187

40.1

38.4

37.7

38.0

38.9

40.1

41.3

42.1

42.7

44

196

49.4

47.3

46.4

46.6

47.6

49.0

50.4

51.6

52.4

46

205

60.4

57.7

56.6

56.7

57.7

59.3

61.1

62.6

63.7

48

214

73.2

69.9

68.4

68.4

69.4

71.2

73.3

75.3

76.8

50

222

88.0

84.1

82.2

82.0

83.0

84.9

87.4

89.8

91.7

Conversion: 1 in = 25.4 mm.

Source: Guide for Design of Pavement Structures, American Association of State Highway and

Transportation Officials, Washington, D. C., 1993, with permission.